Gunbot Crypto BlasterThis script is developed for GUNBOT ( crypto trading bot ) to have trading, on all price hikes.
Features
1> Uses 7+ Indicators
2> Uses 10+ EMA's for suitable for all time frames
3> TSSL implemented for price hikes ( + profits )
4> Down trend Detection, ( buy at bottom )
Cost
0.02 BTC per month
Can be used with gunbot or manually
Support For All buyers on telegram !
Ripple

A Long-Term Trading Opportunity To Buy in Ripple/Euro ...Technical analysis:
. RIPPLE/EURO is in a Range Bound and Beginning of uptrend is expected.
. The price is below the 21-Day WEMA which acts as a dynamic resistance.
. The RSI is at 44.
Trading suggestion:
There is a possibility of temporary retracement to suggested support zone (0.55 to 0.38). if so, traders can set orders based on Daily-Trading-Opportunities and expect to reach short-term targets.
. Beginning of entry zone (0.55)
. Ending of entry zone (0.38)
Entry signal:
Signal to enter the market occurs when the price comes to "Buy zone" then forms one of the reversal patterns, whether "Bullish Engulfing" , "Hammer" or "Valley" , in other words,
NO entry signal when the price comes to the zone BUT after any of reversal patterns is formed in the zone.
To learn more about "Entry signal" and the special version of our "Price Action" strategy FOLLOW our lessons:
Take Profits:
TP1= @ 0.76
TP2= @ 0.96
TP3= @ 1.39
TP4= @ 2.33
TP5= @ 2.86
TP6= Free

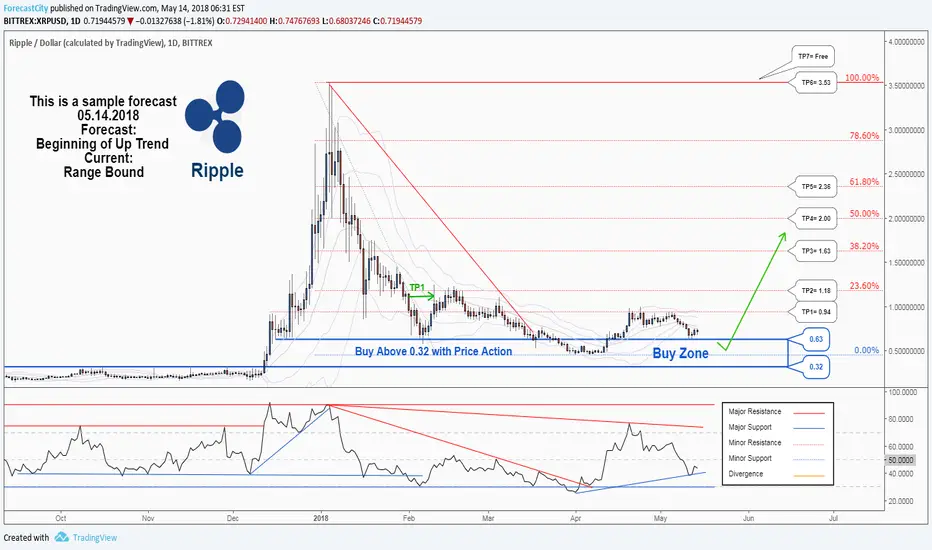
There is a possibility for the beginning of uptrend in RippleTechnical analysis:
. RIPPLE/DOLLAR is in a Range Bound and Beginning of up trend is expected.
. The price is below the 21-Day WEMA which acts as a dynamic resistance.
. The RSI is at 44.
Trading suggestion:
There is a possibility of temporary retracement to suggested support zone (0.63 to 0.32). if so, traders can set orders based on Daily-Trading-Opportunities and expect to reach short-term targets.
. Beginning of entry zone (0.63)
. Ending of entry zone (0.32)
Entry signal:
Signal to enter the market occurs when the price comes to "Buy zone" then forms one of the reversal patterns, whether "Bullish Engulfing" , "Hammer" or "Valley" , in other words,
NO entry signal when the price comes to the zone BUT after any of reversal patterns is formed in the zone.
To learn more about "Entry signal" and special version of our "Price Action" strategy FOLLOW our lessons:
Take Profits:
TP1= @ 0.94
TP2= @ 1.18
TP3= @ 1.63
TP4= @ 2.00
TP5= @ 2.36
TP6= @ 3.53
TP7= Free
There is still possibility to buy in XRPBTC ...Technical analysis:
RIPPLE/BITCOIN is in a range bound and Beginning of up trend is expected.
The price is below the 21-Day WEMA which acts as a dynamic resistance.
The RSI is at 44.
Trading suggestion:
*The price is in a range bound, but we forecast the uptrend would begin.
*Price is in the support zone (0.00009 to 0.00006), traders can set orders based on Daily-Trading-Opportunities and expect to reach short-term targets.
Beginning of entry zone (0.00009)
Ending of entry zone (0.00006)
Entry signal:
Signal to enter the market occurs when the price comes to "Buy zone" then forms one of the reversal patterns, whether "Bullish Engulfing" , "Hammer" or "Valley" , in other words,
NO entry signal when the price comes to the zone BUT after any of reversal patterns is formed in the zone.
To learn more about "Entry signal" and special version of our "Price Action" strategy FOLLOW our lessons:
Trade Setup:
We opened 5 Buy trade(s) @ 0.00008110 (day close price) based on 'Hammer' at 04.12.2018 signaled by our "Daily Trading Opportunity".
Total Profit: 2135 pip
Closed trade(s): 0 pip Profit
Open trade(s): 2135 pip Profit
Open Profit:
Profit for one trade is 0.00008537(current price) - 0.00008110(open price)= 427 pip
5 trade(s) still open, therefore total profit for open trade(s) is 427 x 5= 2135 pip
Take Profits:
TP1= @ 0.000125
TP2= @ 0.000146
TP3= @ 0.000178
TP4= @ 0.000229
TP5= Free

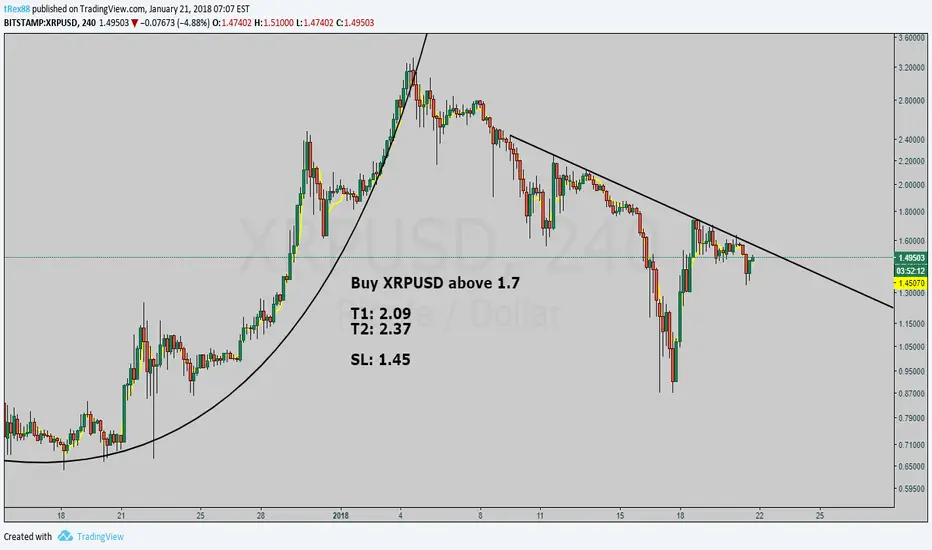
XRP Short Term Trend The trend lines in blue are for a the short term trend, and the trend lines in red are for the shorter terms trend. We see a a wedge created by the short term trend, and the point of the wedge XRP shot below the bottom trend line and sustained for over 5 sessions, confirming the down trend. The shorter trend shows downward parallel channels, meaning XRP could be trading sideways or downward for the next day or two before being able to break over current resistance. In the shorter term trend, resistance is at $1.20 and support at $1.03. MACD at the same level when XRP hit a lower low, indicative of the same difference between moving averages even at a lower level, meaning the 5 day average has gotten lower and hitting resistance becomes more likely. Likely breakout for XRP to be seen within 3-4 days. Huge breakouts are highly co-related with large increases in volume, especially for XRP. Keep a check on RSI, Volume, and Money flow index (if necessary) . Buy price between $1.1-1.2 if market doesn't go into a corrective mode, below $1 if the bottom trend is broken.

Bitcoin Price could hit $50,000 this year with $1 Trillion ?In spite of the current sell-off which the digital coins faced, the experts are still very positive about cryptocurrencies and they told CNBC that cryptocurrencies can rise higher than the previous year and could even go beyond a trillion-dollar mark in terms of value.

XRP/USD - Short term target 3 plusXRP
CMP 2.71.
Cup pattern breakout observed in 4h chart.
Target 3 plus

Is XRP going to touch 1.5 USD on Dec 28. Dec 14.. It climb .45 USD to .83 USD -- Diff 38 cents
Dec 21.. it went up . 71 USD tp 1.12 USD .. Diff 41 cents
Dec 28 .. expect for 1.5 USD..
