Venus Pipes: A Breakout Story in the MakingNSE:VENUSPIPES : A Breakout Story in the Making
Price Action Analysis:
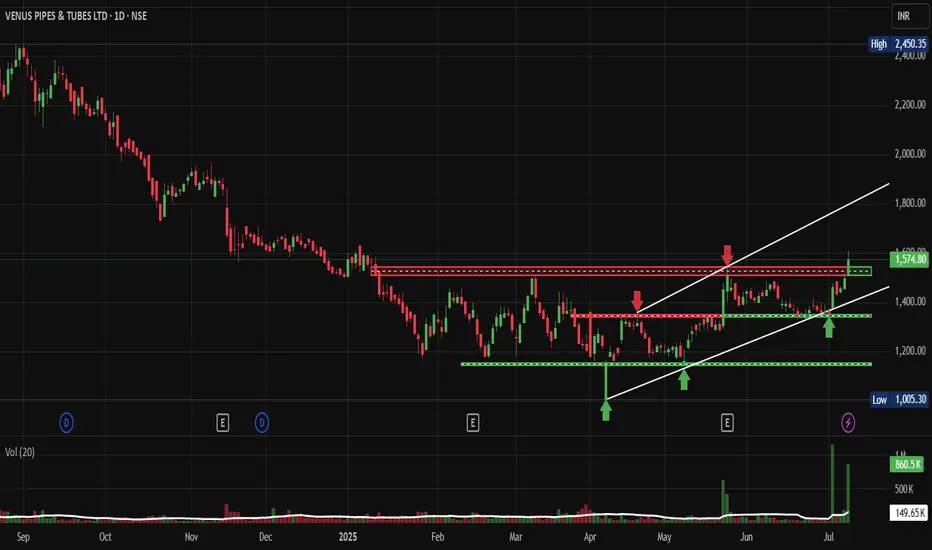
• Price consolidated between 1,200-1,600 levels from January 2025 to June 2025
• Recent breakout above 1,600 resistance with strong volume confirmation
• Currently trading at 1,574.80 after hitting a high of 2,450.35
• Pullback to retest the breakout level suggests healthy consolidation
Volume Spread Analysis:
• Significant volume spike during the recent breakout phase
• Volume increased from an average of 149.65K to 860.5K, indicating institutional interest
• Higher volume during up moves compared to down moves shows buying pressure
• Volume pattern supports the breakout thesis with strong participation
Key Technical Levels:
Support Levels:
• Primary Support: 1,200 (previous base level)
• Secondary Support: 1,400 (mid-range support)
• Immediate Support: 1,500 (recent pullback low)
Resistance Levels:
• Immediate Resistance: 1,650 (recent high)
• Major Resistance: 2,450 (lifetime high)
• Psychological Resistance: 2,000 and 2,500
Base Formation:
• Strong base formed between 1,200-1,400 levels over 6 months
• Multiple retests of support levels showing accumulation
• Base provides a strong foundation for upward movement
Technical Patterns:
Primary Pattern:
• Bullish continuation pattern with horizontal resistance at 1,600 and rising support line
• Pattern duration: 8 months (Jan 2025 to July 2025)
• Breakout confirmed with volume expansion
Secondary Patterns:
• Higher low pattern indicating underlying strength
• Volume-price divergence resolved with a recent breakout
Trade Setup:
Entry Strategy:
• Conservative Entry: On pullback to 1,500-1,520 levels
• Aggressive Entry: Current levels around 1,570-1,580
• Breakout Entry: Above 1,650 with volume confirmation
Exit Strategy:
• Target 1: 1,800 (immediate target)
• Target 2: 2,100 (50% retracement of lifetime high)
• Target 3: 2,400-2,500 (lifetime high retest)
Stop-Loss Levels:
• For entries around 1,570: Stop at 1,450 (below base support)
• For entries around 1,500: Stop at 1,350 (below key support)
• Trailing stop: 8-10% below recent swing highs
Risk Management:
Position Sizing:
• Risk per trade: Maximum 2% of portfolio
• Position size calculation: Portfolio value × 2% ÷ (Entry price - Stop loss)
• Gradual position building is recommended, given the volatility
Risk Assessment:
• Risk-Reward Ratio: 1:2 to 1:3 for current setup
• Time horizon: 3-6 months for primary targets
• Market correlation: Monitor broader market sentiment
Sectoral Backdrop:
Steel Pipes and Tubes Industry:
• Infrastructure spending boost under government initiatives
• Demand from the oil and gas sector supports growth
• Housing sector recovery driving construction demand
• Water supply projects creating additional opportunities
Industry Trends:
• Consolidation phase in the sector, favouring established players
• Raw material cost pressures being managed through pricing power
• Export opportunities emerging in neighbouring markets
• Technology upgrades improving operational efficiency
Fundamental Backdrop:
Company Overview:
• Venus Pipes & Tubes is a leading manufacturer of steel pipes and tubes
• Established presence in water supply, structural, and industrial applications
• Strong distribution network across India
• Focus on quality and customer service
Recent Developments:
• Capacity expansion plans to meet growing demand
• Strategic partnerships with infrastructure companies
• Improved working capital management
• Strong order book visibility for coming quarters
Financial Health:
• Steady revenue growth trajectory
• Improving margin profile
• Healthy balance sheet with manageable debt levels
• Strong cash flow generation capabilities
My Take:
Short-term View (1-3 months):
• Consolidation expected around current levels
• Potential for retest of breakout levels
• Volume patterns to be monitored for direction
Medium-term View (3-6 months):
• Upside potential to 2,000-2,200 levels
• Sector rotation could benefit the stock
• Infrastructure spending cycle supporting fundamentals
Long-term View (6-12 months):
• Structural growth story intact
• Market leadership position strengthening
• Potential for significant value creation
Keep in the Watchlist.
NO RECO. For Buy/Sell.
📌Thank you for exploring my idea! I hope you found it valuable.
🙏FOLLOW for more
👍BOOST if you found it useful.
✍️COMMENT below with your views.
Meanwhile, check out my other stock ideas on the right side until this trade is activated. I would love your feedback.
Disclaimer: "I am not a SEBI REGISTERED RESEARCH ANALYST AND INVESTMENT ADVISER."
This analysis is intended solely for informational and educational purposes and should not be interpreted as financial advice. It is advisable to consult a qualified financial advisor or conduct thorough research before making investment decisions.
Risingtrendchannel
Triveni Turbine - Chart of the Week NSE:TRITURBINE has a beautiful structure on the Weekly Timeframe to Qualify for my Chart of the Week idea, it saw Decent Volumes around the marked Key Levels which is 0.786% Fib Retracement Levels and also a Rising trendline which has been defending since June 2022 Several Times.
About:
NSE:TRITURBINE primarily manufactures and supplies power-generating equipment and solutions. It was a division of NSE:TRIVENI since the 1970s and was demerged w.e.f from Oct 2010 into a separate entity.
Trade Setup:
Could be a good Positional Trade with the Rising Trendline Being a Major Support along with FIb Levels.
📌Thank you for exploring my idea! I hope you found it valuable.
🙏FLLOW for more
👍BOOST if useful
✍️COMMENT Below your views.
Meanwhile, check out my other stock ideas on the right side until this trade is activated. I would love your feedback.
Disclaimer: "I am not SEBI REGISTERED RESEARCH ANALYST AND INVESTMENT ADVISER."
This analysis is intended solely for informational and educational purposes only and should not be interpreted as financial advice. It is advisable to consult a qualified financial advisor or conduct thorough research before making investment decisions.

Synergy Green - A chart pretty CleanOne way of looking at it is a uptrend followed by a sideways consolidation.
This consolidation usually forms a continuation pattern by way of a cup and handle pattern, Inverted head and shoulder pattern and in this case as well, it has been forming a rising channel.
The volume also suggests that there was a decent accumulation on the way up followed by some profit booking. That level is a major supply zone and once that level is consumed, we could see a fresh demand in this script.
I suspect that another attempt to 480 will push itself into making a small contraction before it zooms towards the targets.
Trail the SL.

DRREDDY - PRICE REENTERING RISING WEDGE CHANNELHi All,
This idea is about Dr Reddys Lab
Fundamentals
Mkt Cap - 106810 Cr
Stock PE - 19.2
ROE - 21%
ROCE - 27%
Mkt Cap/Sales - 3.8
OPM - 28%
Technicals
Price was pushed back to follow the rising wedge pattern & if it sustains above the marked (white line) resistance, can further show an upside of 8-10% to reach the upper channel of rising wedge
Happy Trading,
Thanks,
Stock-n-Shine

SENCO - POST 20% CORRECTION, PA MIGHT REVERSE FRM BOTTOM CHANNELHi All,
This idea is about Senco Gold Ltd
The stock has corrected over 20% in this month alone & now have reached the lower channel of rising wedge formation. Volumes have dried up indicating the supply may have exhausted & Price action might soon reverse from this point
Stock can be bought if it gives a closing above 980 for further targets of T1 1010, T2 1070, T3 1150.
If the stock shows further downside then the support levels are S1 916, S2 864
The correction is due to poor quaterly results owing to heat wave, elections, and fewer wedding days although the sales was up 9% YoY
Fundamentals
Market Cap
₹ 7,398 Cr.
Current Price
₹ 952
High / Low
₹ 1,177 / 365
Stock P/E
39.2
Book Value
₹ 177
Dividend Yield
0.11 %
ROCE
13.4 %
ROE
16.2 %
Face Value
₹ 10.0
Equity capital
₹ 77.7 Cr.
No. Eq. Shares
7.77
EPS
₹ 24.3
Promoter holding
68.4 %
Change in Prom Hold
-0.01 %
Chg in Prom Hold 3Yr
%
Pledged percentage
0.00 %
Market Cap to Sales
1.41
Sales growth
28.3 %
PEG Ratio
1.92
EVEBITDA
20.3
Quick ratio
0.40
Trade receivables
₹ 64.4 Cr.
Sales
₹ 5,230 Cr.
Debt to equity
1.28
Price to book value
5.37
Free Cash Flow
₹ -324 Cr.
CMP / FCF
-42.4
Happy Trading,
Thanks,
Stock-n-Shine

FIEM INDUSTRIESThe co. enjoys a significant market share for the supply of automotive lighting & signaling equipment and rearview mirrors to Two-wheeler and Four-wheeler OEMs. It has diversified its product portfolio by venturing into LED Luminaires for Indoor and Outdoor applications and Integrated Passenger Information Systems with LED Display. It is a sole Supplier to Ola Electric for Headlamps, Tail Lamps, Indicators, Rear Fender Assembly and Mirrors. From 2018 to 2022, the co. has launched 7 models using the World’s smallest Bi-functional LED Headlight.
The market share in the conventional lighting side in FY22, is estimated to be more than 30%.
Its top three customers contributed ~71% of revenues in FY22
Some of the top clients of the co. are :
Two Wheeler- Honda, TVS, Yamaha, Suzuki, Eicher Royal Enfield
Four Wheeler- Tata Marcopolo, Force Motors, Honda Siel, Hyundai
EV- Ola, Hero Electric
