ChennaiPetro: Wedge & Trendline BO with 61.8%, Chart of the WeekNSE:CHENNPETRO Explosive Breakout: Why This Refinery Stock Could Rally Another 30% After Its Q2 Turnaround. This PSU Refinery Stock Broke Through ₹979 Levels - Here's What Traders Need to Know About the Next Move. Let's Analyse in our Chart of the Week Below.
As per the Latest SEBI Mandate, this isn't a Trading/Investment RECOMMENDATION nor for Educational Purposes; it is just for Informational purposes only. The chart data used is 3 Months old, as Showing Live Chart Data is not allowed according to the New SEBI Mandate.
Disclaimer: "I am not a SEBI REGISTERED RESEARCH ANALYST AND INVESTMENT ADVISER."
This analysis is intended solely for informational purposes and should not be interpreted as financial advice. It is advisable to consult a qualified financial advisor or conduct thorough research before making investment decisions.
Price Action Analysis:
Trend Structure and Momentum:
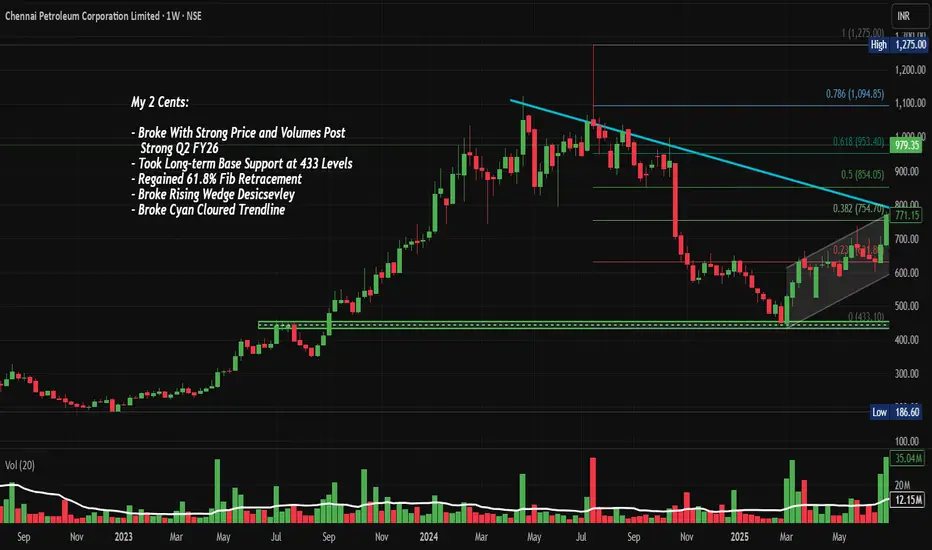
- The stock experienced a prolonged uptrend from March 2023 to July 2024, rallying from base levels around ₹433 to a peak of ₹1,275, representing approximately 195% appreciation
- Post the July 2024 peak, the stock entered a corrective phase characterised by lower highs and consolidation
- Recent price action shows a breakout above the descending cyan trendline that had been capping rallies since mid-2024
- Current price of ₹979.35 (as of October 31, 2025) represents a 26.80% gain, indicating strong buying momentum
- The stock is trading above all key Fibonacci retracement levels, having reclaimed the 61.8% level at approximately ₹953
Candlestick Patterns and Formations:
- The most recent candle shows a strong bullish close with a substantial body, indicating conviction in the upward move
- The chart displays a rising wedge/descending channel pattern that was broken decisively in recent sessions
- Prior consolidation between ₹700-₹850 formed a re-accumulation base, which has now been breached to the upside
- The breakout candle demonstrates strong price and volume expansion, a classic sign of institutional participation
Volume Spread Analysis:
Volume Characteristics:
- Recent volume surge to 90.39 million shares significantly exceeds the average volume of 13.46 million, representing approximately 6.7x normal trading activity
- The volume spike coincides with the price breakout, validating the move as genuine rather than a false breakout
- Historical volume analysis shows similar spikes during major trend reversals, particularly during the March 2023 base breakout
- Volume expansion without corresponding price weakness suggests strong demand absorption at current levels
Volume-Price Relationship:
- The volume profile indicates heavy accumulation in the ₹700-₹800 zone, which now serves as a critical support cluster
- Recent sessions show sustained above-average volume, suggesting institutional interest rather than retail speculation
- The volume pattern aligns with a classic "breakout with expansion" scenario, increasing the probability of trend continuation
Support and Resistance Levels:
Key Support Zones:
- Primary Support (S1): ₹854 - This represents the 0.5 Fibonacci retracement level and previous consolidation high
- Secondary Support (S2): ₹754 - The 0.382 Fibonacci level and recent breakout point from the descending trendline
- Critical Support (S3): ₹631 - The 0.236 Fibonacci level and long-term base support at ₹433-₹450 zone
- The grey trendline originating from the 2024 lows provides dynamic support, currently positioned around ₹720
Key Resistance Zones:
- Immediate Resistance (R1): ₹1,094 - The 0.786 Fibonacci retracement level
- Major Resistance (R2): ₹1,275 - The all-time high achieved in July 2024 and psychological resistance
- Extended Resistance (R3): ₹1,400-₹1,500 - Projected based on measured move from the consolidation range
Technical Patterns and Indicators:
Chart Patterns:
- Descending Channel Breakout: The stock has successfully breached the cyan-colored descending trendline that acted as resistance since July 2024
- Rising Wedge Resolution: The consolidation pattern between August and October 2025 has resolved to the upside
- Base-on-Base Formation: The ₹433 level established in early 2024 served as the foundation for the subsequent rally, demonstrating strong long-term base support
- Cup and Handle (Potential): If the stock consolidates between ₹950-₹1,050 and then breaks out, it could form a cup and handle pattern projecting toward ₹1,400+
Fibonacci Analysis:
- The 61.8% Fibonacci retracement at ₹953 has been convincingly reclaimed, suggesting the corrective phase may be complete
- Golden ratio support held perfectly during the September-October consolidation
- The next Fibonacci target at 0.786 (₹1,094) represents the immediate upside objective
- Fibonacci extension levels project Upmove at ₹1,350 (1.272 extension) and ₹1,500 (1.618 extension) if the rally extends
Risk Factors and Invalidation Levels:
- A close below ₹920 would signal a potential false breakout
- Sustained trading below ₹850 would invalidate the bullish setup and suggest resumption of the downtrend
- Weekly close below the broken trendline (currently around ₹940) would be a bearish reversal signal
- Failure to maintain above 61.8% Fibonacci retracement could trigger another corrective leg
Fundamental and Sectoral Backdrop:
Company Fundamentals:
- Chennai Petroleum Corporation (CPCL) reported Q2 FY26 revenue of ₹16,327 crore with profit after tax of ₹719 crore
- The company achieved a crude throughput of 3.013 million metric tonnes (MMT) with a Gross Refining Margin (GRM) of $9.04 per barrel in Q2 FY26
- However, Q1 FY26 saw challenges with a net loss of ₹40 crore compared to a profit of ₹357 crore in Q1 FY25, primarily due to inventory losses and lower GRM of $3.22 per barrel
- For H1 FY26, CPCL recorded net profit of ₹689.68 crore versus a net loss of ₹294.45 crore in H1 FY25, with average GRM at $6.17 per barrel
- The company achieved a record crude throughput of 11.642 MMT with 111% capacity utilisation
Business Operations and Product Portfolio:
- CPCL is engaged in refining crude oil to produce various petroleum products, including LPG, Motor Spirit, Kerosene, Aviation Turbine Fuel, High Speed Diesel, Naphtha, Fuel Oil, and Bitumen
- The company also produces speciality products like Paraffin Wax, Mineral Turpentine Oil, Hexane, and Petrochemical feedstocks
- Most fuel products are marketed by the parent company, Indian Oil Corporation (IOC), while CPCL directly markets speciality products
- In 2024, CPCL commissioned new infrastructure, including Pharma Grade Hexane production and Sustainable Aviation Fuel
Financial Metrics and Valuation:
- Market capitalisation stands at approximately ₹14,584 crore, with the company maintaining a healthy dividend payout of 35%
- CPCL has demonstrated strong return on equity with a 3-year ROE of 31% and has reduced debt levels
- Current price-to-earnings and other valuation metrics suggest the stock is reasonably valued considering sectoral challenges
Sector Outlook and Industry Trends:
- India's refining capacity increased to 258.1 MMTPA as of FY25, with domestic consumption at 239.2 MMTPA
- India is expected to drive global oil demand growth, with consumption projected at 5.74 million barrels per day in 2025 and 5.99 million bpd in 2026
- The country plans to expand refining capacity to 309.5 MMTPA by 2028
- Refinery output has been strong, with manufacturing IIP for refined petroleum products rising 4.24% in June 2025, driven by auto-fuel demand growth of 7.9% year-on-year
- However, refining margins are expected to fall below mid-cycle levels in FY25, indicating potential profitability challenges
Opportunities and Challenges:
Opportunities:
- Downstream activities driven by refinery-petrochemical integration are projected to post the highest 5.2% CAGR through 2030
- Growing domestic demand for petroleum products with urbanisation and economic growth
- Government initiatives supporting energy infrastructure development
- Indian refiners have benefited from processing discounted Russian crude, generating significant margins
Challenges:
- Net profit declined for the last two quarters, with an average decrease of 108.5% per quarter, and revenue fell 14.1% per quarter
- Volatile crude oil prices and fluctuating gross refining margins
- India's domestic crude oil production has fallen 26.3% and natural gas by 24.1% during FY12-FY25, leading to increased import dependency
- Environmental regulations and pressure to transition toward cleaner energy
- Institutional investment in CPCL decreased by 37.83% over the past 30 days
Competitive Position:
- CPCL is a subsidiary of Indian Oil Corporation, providing strategic advantages in product marketing and distribution
- The company competes with major refiners, including Reliance Industries, Bharat Petroleum, Hindustan Petroleum, and Mangalore Refinery
- CPCL's core vision is to be the most admired Indian energy company, creating value through world-class performance and ethical governance
- The company's location in South India provides strategic advantages for serving the region's growing energy needs
Fundamental Risks:
- The stock trades at reasonable valuations with potential upside to fair value estimates around ₹1,050
- Strong Q2 performance suggests earnings momentum is improving after a weak Q1
- Sectoral tailwinds from growing domestic demand support medium-term prospects
- Key risks include GRM volatility, crude price fluctuations, and regulatory changes
My 2 Cents:
- CPCL presents a compelling technical setup following the breakout from a multi-month consolidation pattern
- The combination of volume expansion, Fibonacci support, and trendline breach suggests potential for further upside
- Risk management is critical given sectoral volatility; strict adherence to stop losses is recommended
Full Coverage on my Newsletter this Week
Keep in the Watchlist and DOYR.
NO RECO. For Buy/Sell.
📌Thank you for exploring my idea! I hope you found it valuable.
🙏FOLLOW for more
👍BOOST if you found it useful.
✍️COMMENT below with your views.
Meanwhile, check out my other stock ideas on the right side until this trade is activated. I would love your feedback.
As per the Latest SEBI Mandate, this isn't a Trading/Investment RECOMMENDATION nor for Educational Purposes; it is just for Informational purposes only. The chart data used is 3 Months old, as Showing Live Chart Data is not allowed according to the New SEBI Mandate.
Disclaimer: "I am not a SEBI REGISTERED RESEARCH ANALYST AND INVESTMENT ADVISER."
This analysis is intended solely for informational purposes and should not be interpreted as financial advice. It is advisable to consult a qualified financial advisor or conduct thorough research before making investment decisions.
Risingwedgebreakout
CARTRADE: Breaks Free with Rising Wedge Breakout Post Q1 FY 26NSE:CARTRADE Breaks Free: The Rising Wedge Breakout That's Driving This Auto-Tech Giant to New All-Time Heights with Strong Q1 FY 26
Price Action:
Price Movement and Trend Structure:
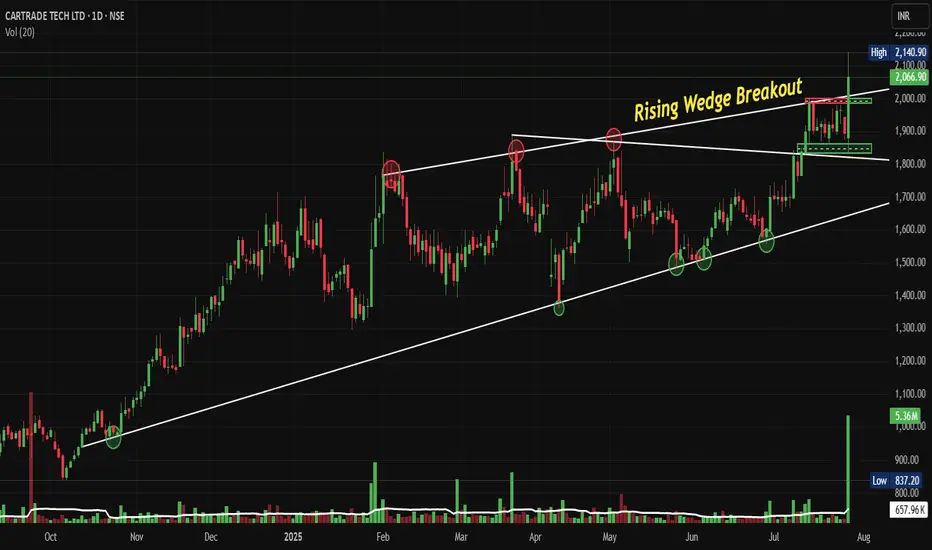
• Current Price: ₹2,066.90 (as of July 28, 2025)
• Daily Change: +₹172.20 (+9.09%) - Strong bullish momentum
• Price Range: High ₹2,140.90 | Low ₹2,100.90 | Volume 5.36M shares
• Price Trajectory: Consistent higher highs and higher lows pattern from October 2024
• Recent Action: Sharp acceleration in price movement post-July breakout
• Momentum Character: Strong bullish momentum with gap-up openings and sustained buying
Volume Spread Analysis:
Volume Characteristics:
• Breakout Volume: Exceptional volume spike during the breakout phase (5.36M shares)
• Volume Pattern: Generally increasing volume during upward moves, declining during consolidations
• Average Volume: Approximately 1-2M shares on regular trading days
• Volume Confirmation: The breakout is well-supported by above-average volume, validating the move
Volume Indicators:
• Volume Expansion: 3-4x normal volume during breakout sessions
• Distribution vs Accumulation: Clear accumulation pattern throughout the wedge formation
• Volume-Price Relationship: Positive correlation between volume and price advancement
Chart Patterns:
• Rising Wedge Breakout: The stock has successfully broken out of a long-term rising wedge pattern that was forming since October 2024
• Timeframe: Daily chart showing progression from October 2024 to July 2025
• Breakout Confirmation: Strong breakout above the upper trendline of the wedge with significant volume expansion
• Breakout Level: Approximately ₹1,850-1,900 range
• Pattern Completion: Clean breakout with follow-through buying confirming pattern validity
Key Price Levels:
• All-Time High: ₹2,140.90 (recent high)
• Previous Resistance Zones: ₹1,800, ₹1,900, ₹2,000
• Immediate Support: ₹1,850-1,900 (previous breakout zone)
• Major Support: ₹1,650-1,700 (middle of previous consolidation)
• Long-term Support: ₹1,400-1,450 (bottom of the rising wedge)
Trend Analysis:
• Primary Trend: Strong bullish momentum with consistent higher highs and higher lows
• Secondary Trend: Recently accelerated upward movement post-breakout
• Trend Strength: Multiple touchpoints on both trendlines confirm the validity of the wedge pattern validity
• Momentum: Increasing momentum as evidenced by the steepening price action
Key Support and Resistance Levels:
Key Resistance Levels:
• Immediate Resistance: ₹2,150-2,200 (psychological and technical resistance)
• Next Target: ₹2,300-2,350 (measured move from wedge breakout)
• Long-term Target: ₹2,500+ (extension based on wedge height projection)
Critical Support Levels:
• First Support: ₹1,950-2,000 (recent consolidation zone)
• Strong Support: ₹1,850-1,900 (breakout confirmation level)
• Major Support: ₹1,650-1,700 (50% retracement of recent move)
• Ultimate Support: ₹1,400-1,450 (wedge bottom - unlikely to be tested)
Base Formation:
• Base Pattern: Rising wedge base formed over 9 months (October 2024 to July 2025)
• Base Depth: Approximately ₹1,000 to ₹1,900 range
• Base Quality: High-quality base with multiple retests of support and resistance
• Breakout Strength: Clean breakout with gap-up opening confirming institutional interest
Technical Patterns and Indicators:
Chart Patterns:
• Completed Pattern: Rising Wedge Breakout (Bullish continuation pattern)
• Pattern Reliability: High - well-defined trendlines with multiple touchpoints
• Measured Move Target: ₹2,300-2,400 (based on wedge height projection)
• Time Frame: 9-month pattern completion
Technical Formations:
• Flag and Pennant Potential: Post-breakout consolidation may form continuation patterns
• Gap Analysis: Potential gap fills not immediately concerning given strong fundamentals
• Trend Channel: Stock is establishing a new, steeper upward channel post-breakout
Trade Setup and Strategy:
Entry Levels:
• Aggressive Entry: ₹2,050-2,070 (current market price on dips)
• Conservative Entry: ₹1,950-1,980 (on pullback to breakout zone)
• Momentum Entry: ₹2,100-2,120 (on continuation above resistance)
• Scale-in Strategy: 40% at ₹2,000, 35% at ₹1,950, 25% at ₹1,900
Exit Levels and Targets:
• Target 1: ₹2,200-2,250 (immediate resistance zone) - Book 30% profits
• Target 2: ₹2,350-2,400 (measured move target) - Book 40% profits
• Target 3: ₹2,500-2,600 (extension target) - Book remaining 30%
• Trail Strategy: Trail stop-loss 8-10% below recent swing lows after Target 1
Stop-Loss Strategy:
• Aggressive Stop: ₹1,900-1,920 (below recent support)
• Conservative Stop: ₹1,850-1,870 (below breakout zone)
• Disaster Stop: ₹1,750-1,780 (below major support)
• Risk-Reward Ratio: Minimum 1:2, targeting 1:3 for optimal entries
Position Sizing and Risk Management:
Position Sizing Guidelines:
• Conservative Allocation: 2-3% of portfolio (suitable for risk-averse investors)
• Moderate Allocation: 4-5% of portfolio (balanced approach)
• Aggressive Allocation: 6-8% of portfolio (for high-conviction trades)
• Maximum Position: Not exceeding 10% of the total portfolio, regardless of conviction
Risk Management Rules:
• Single Trade Risk: Maximum 1-2% of portfolio value per trade
• Stop-Loss Discipline: Strict adherence to predetermined stop-loss levels
• Profit Booking Strategy: Systematic profit booking at predetermined targets
• Position Monitoring: Daily review of technical levels and volume patterns
Risk Mitigation Techniques
• Diversification: Avoid overconcentration in a single stock or sector
• Hedging Options: Consider protective puts for large positions
• Correlation Analysis: Monitor correlation with broader auto and tech indices
• News Sensitivity: Be prepared for volatility around earnings and sector news
Sectoral and Fundamental Backdrop:
Industry Landscape:
• Auto Marketplace Growth: India's online auto marketplace is growing at a 27.5% CAGR (2025-2030)
• Digital Transformation: Increasing shift from offline to online vehicle transactions
• Market Leadership: CarTrade Tech is India's leading and only profitable auto marketplace
• Competitive Advantage: Multi-platform presence with CarWale, BikeWale, CarTrade, and OLX India
Business Model Strength:
• Asset-Light Model: Operates 114 auto malls, mostly leased, ensuring capital efficiency
• Revenue Diversification: Multiple revenue streams including listing fees, transaction commissions, and financial services
• Platform Integration: Comprehensive ecosystem covering new cars, used cars, commercial vehicles, and two-wheelers
• Strategic Acquisitions: OLX India acquisition for ₹535.54 crore, strengthening market position
Recent Fundamental Performance:
• Q1 FY26 Results: Revenue of ₹173 crore (22% YoY growth)
• Profit Growth: Net profit doubled year-on-year in Q1 FY26
• Market Capitalization: ₹9,801 crore (up 139% in past year)
• Valuation Metrics: Trading at 4.42 times book value
• EBITDA Performance: EBITDA almost doubled in Q1 FY26
Growth Catalysts:
• Market Expansion: Penetration into tier-2 and tier-3 cities
• Technology Enhancement: AI and ML integration for better user experience
• Financial Services: Growing fintech vertical with loan facilitation
• Electric Vehicle Segment: Positioning for EV marketplace opportunities
• B2B Growth: Expanding dealer and OEM partnerships
Sector Tailwinds:
• Digital Adoption: Accelerated post-pandemic shift to online platforms
• Used Car Market: Growing preference for certified pre-owned vehicles
• Credit Penetration: Increasing vehicle financing accessibility
• Regulatory Support: Government push for digitization and transparency
• Consumer Behaviour: Millennial and Gen-Z preference for online research and transactions
Risk Factors and Considerations:
Technical Risks:
• Overbought Conditions: Stock may be due for consolidation after a sharp run-up
• Gap Risk: Potential for gap-down on negative news or market corrections
• Volume Sustainability: Need for continued high volume to sustain momentum
• Market Correlation: High beta stock susceptible to broader market volatility
Fundamental Risks:
• Economic Slowdown: Auto sales sensitivity to economic cycles
• Competition Intensification: New entrants and existing players' aggressive strategies
• Regulatory Changes: Potential policy changes affecting online marketplaces
• Technology Disruption: Emergence of new technologies or business models
Market Risks:
• Sector Rotation: Shift in investor preference away from auto-tech stocks
• Liquidity Concerns: Mid-cap stock with potential liquidity constraints during market stress
• Earnings Expectations: High growth expectations leading to volatility on any disappointment
• Valuation Concerns: Premium valuations make stock sensitive to market sentiment changes
My Take and Investment Thesis:
NSE:CARTRADE presents a compelling technical setup with a successful rising wedge breakout supported by strong volume and robust fundamental performance. The stock has established itself as a leader in India's growing auto marketplace sector with a diversified business model and strong growth trajectory.
The technical breakout, combined with excellent Q1 FY26 results showing doubled profits and 22% revenue growth, creates a favourable risk-reward scenario for investors. However, given the stock's significant run-up (146% in 11 months), careful position sizing and strict risk management are essential.
The investment thesis is supported by both technical momentum and fundamental strength, making it suitable for investors seeking exposure to India's digital transformation in the automotive sector. The key to success will be disciplined execution of the outlined entry, exit, and risk management strategies while monitoring both technical levels and fundamental developments closely.
Keep in the Watchlist and DOYR.
NO RECO. For Buy/Sell.
📌Thank you for exploring my idea! I hope you found it valuable.
🙏FOLLOW for more
👍BOOST if you found it useful.
✍️COMMENT below with your views.
Meanwhile, check out my other stock ideas on the right side until this trade is activated. I would love your feedback.
Disclaimer: "I am not a SEBI REGISTERED RESEARCH ANALYST AND INVESTMENT ADVISER."
This analysis is intended solely for informational and educational purposes and should not be interpreted as financial advice. It is advisable to consult a qualified financial advisor or conduct thorough research before making investment decisions.
CRAFTSMAN: Rising Wedge Breakout Post Q1 FY26NSE:CRAFTSMAN Breaks Above Rising Wedge: A Bullish Technical Play Worth Watching Post Decent Q1 FY26 Results
Price Action Analysis:
Current Price Movement:
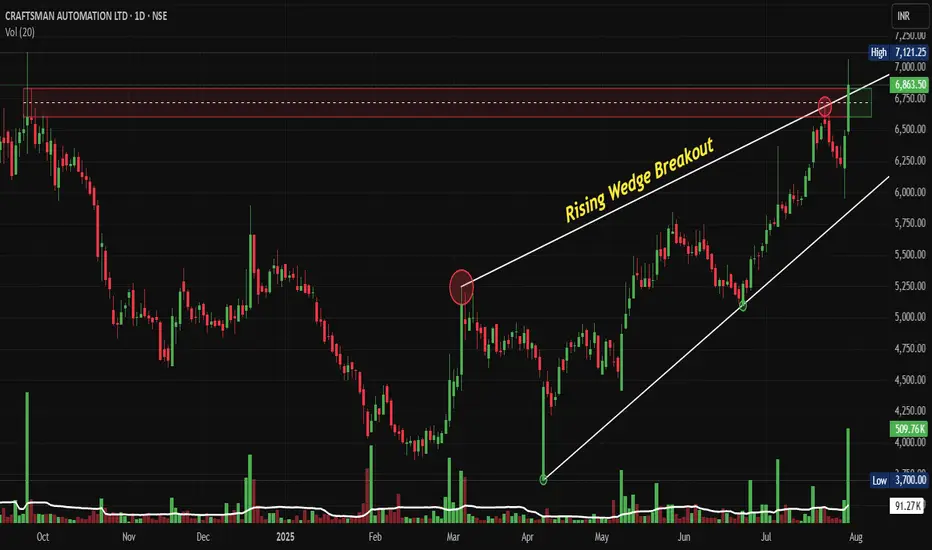
• Current Price: ₹6,863.50 (as of July 30, 2025)
• Day's Performance: +₹415.50 (+6.44%)
• Volume: 91.27K shares
• 52-Week Range: ₹3,700 - ₹7,121.25
Price Structure Analysis:
• Trend: Strong uptrend from March 2025 lows
• Higher Highs: Consistent formation since March 2025
• Higher Lows: Well-defined support levels during pullbacks
• Momentum: Acceleration post-breakout with gap-up opening
Volume Spread Analysis:
• Volume Patterns: Decreasing volume during the consolidation phase
• Breakout Volume: Significant surge indicating institutional participation
• Volume Profile: Above-average participation at key resistance levels
Key Price Levels:
• All-Time High: ₹7,121.25 (immediate target zone)
• Breakout Level: ₹6,500 (now acting as support)
• Previous Resistance: ₹6,200-6,300 (now support zone)
• Major Support: ₹5,800-6,000 (rising trendline confluence)
Base Formation:
• Primary Base: Extended consolidation between ₹4,800-6,500 from March to July 2025
• Duration: Approximately 4 months
• Depth: Shallow correction of 15-20% from previous highs
• Character: Healthy sideways movement with diminishing volatility
Key Support and Resistance Levels:
• Major Resistance: ₹7,121.25 (all-time high)
• Immediate Resistance: ₹6,900-7,000 zone
• Strong Support: ₹6,500 (breakout level)
• Major Support: ₹5,800-6,000 (rising wedge upper trendline)
• Critical Support: ₹5,200-5,300 (previous consolidation zone)
Technical Pattern:
Rising Wedge Breakout:
• Pattern: Bullish breakout from a rising wedge formation
• Formation Period: March 2025 to July 2025
• Breakout Level: ₹6,500 approximately
• Volume Confirmation: Strong volume spike on breakout day
Trade Setup:
Entry Strategy:
• Primary Entry: ₹6,850-6,900 (current levels on any minor dip)
• Aggressive Entry: ₹6,800-6,850 (immediate entry)
• Conservative Entry: ₹6,650-6,700 (on pullback to breakout level)
Target Levels:
• Target 1: ₹7,200-7,300 (immediate resistance zone)
• Target 2: ₹7,800-8,000 (measured move target)
• Target 3: ₹8,500-9,000 (cup and handle projection)
Stop-Loss Levels:
• Aggressive Stop: ₹6,400 (below breakout level)
• Conservative Stop: ₹6,200 (below rising wedge support)
• Trailing Stop: Move to breakeven once Target 1 is achieved
Position Sizing:
• Risk per trade: Maximum 2% of portfolio
• Position size calculation based on stop-loss distance
• For ₹6,850 entry with ₹6,400 stop: Risk = ₹450 per share
• Recommended allocation: 1-2% of equity portfolio
Risk Management:
Risk Factors:
• Market-wide correction could drag the stock down
• Sector rotation out of engineering/auto components
• Profit booking at all-time high levels
• Global economic headwinds affecting the auto sector
Risk Mitigation:
• Strict stop-loss adherence
• Partial profit booking at each target level
• Position size limiting to manage portfolio risk
• Monitoring broader market sentiment
Exit Strategy:
• Book 30% profits at Target 1
• Book another 40% at Target 2
• Trail remaining 30% with rising stop-loss
Sectoral and Fundamental Backdrop:
Business Overview:
• Diversified engineering company with vertically integrated manufacturing
• Three main segments: Automotive Powertrain (51%), Aluminium Products (21%), Industrial & Engineering (28%)
• Market capitalization: ₹16,357 crores
• Revenue: ₹6,323 crores with profit of ₹211 crores (TTM)
Recent Financial Performance(Q1 FY26):
• Q1 FY26 results: Revenue of ₹1,784 crores, profit of ₹70 crores
• PAT growth: 31% YoY in Q1 FY26
• Segment performance: Aluminium Products revenue up 102.82% YoY
• Powertrain revenue: ₹496.41 crores (up 19.23% YoY)
Sector Dynamics:
• Automotive sector recovery post-pandemic
• Increasing adoption of aluminium components for weight reduction
• Growing demand for powertrain components in commercial vehicles
• Beneficiary of the Make in India initiative
Key Clients and Market Position:
• Supplies to tier 1 OEMs including Tata Motors, Cummins, M&M, Royal Enfield
• Strong presence in commercial vehicles, two-wheelers, and tractor segments
• Established player in aluminium die-casting and machining
Growth Drivers:
• Capacity utilization improvements
• Focus on higher-margin aluminium products
• Expansion in industrial and engineering segments
• Increasing content per vehicle trends
Analyst Outlook after Q1 FY26:
• Average 1-year price target: ₹5,754 (though this appears conservative given current price)
• Price target range: ₹4,318 to ₹8,085
• Positive sentiment on aluminium business growth
• Capex guidance of ₹100-120 crores annually for maintenance and debottlenecking
My Take:
The technical setup for NSE:CRAFTSMAN presents a compelling bullish case with the successful breakout from a rising wedge pattern, supported by strong volume and a healthy fundamental backdrop. The stock is well-positioned to test new highs, though traders should remain disciplined with risk management given the proximity to all-time high levels. The diversified business model and strong sectoral tailwinds provide fundamental support to the technical breakout.
Keep in the Watchlist and DOYR.
NO RECO. For Buy/Sell.
📌Thank you for exploring my idea! I hope you found it valuable.
🙏FOLLOW for more
👍BOOST if you found it useful.
✍️COMMENT below with your views.
Meanwhile, check out my other stock ideas on the right side until this trade is activated. I would love your feedback.
Disclaimer: "I am not a SEBI REGISTERED RESEARCH ANALYST AND INVESTMENT ADVISER."
This analysis is intended solely for informational and educational purposes and should not be interpreted as financial advice. It is advisable to consult a qualified financial advisor or conduct thorough research before making investment decisions.
RAIN: Breaks Out of Rising Wedge Pattern Signals Fresh UptrendNSE:RAIN Breaks Out: Rising Wedge Pattern Signals Potential Bullish Run to 180+ Levels
Signals Fresh Uptrend After Months of Consolidation
Price Action:
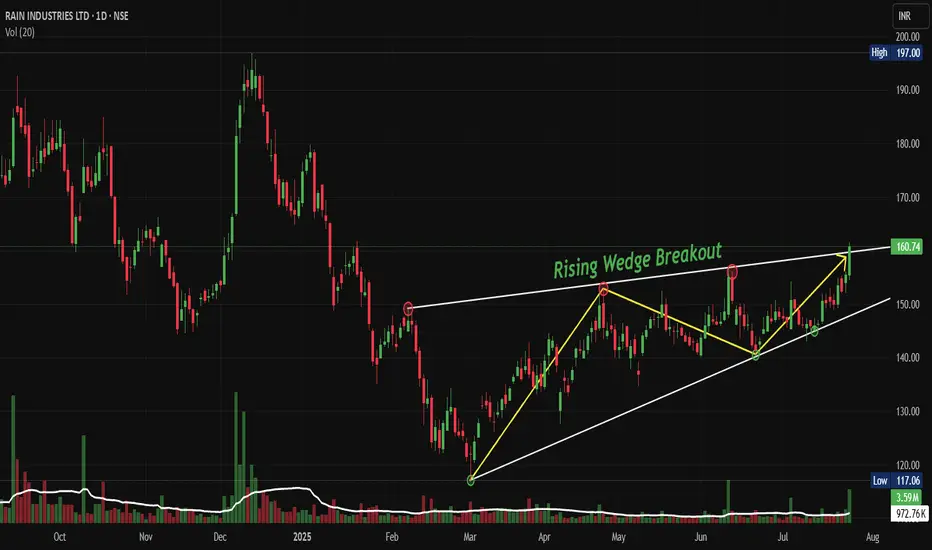
- NSE:RAIN has been trading within a well-defined rising wedge pattern since March 2025
- The stock has recently broken out above the upper trendline of the wedge at approximately 160 levels
- Current price of 160.74 represents a significant move above the key resistance zone
- The breakout is accompanied by increased volume, suggesting genuine buying interest
Volume Spread Analysis:
• Volume breakout accompanied the wedge pattern breakout
• Higher volumes during up moves compared to down moves indicate bullish participation
• Volume spike visible during the recent breakout at 160+ levels
• Average volume of 972K around today, 3.59M shares with recent surge to higher levels
Base Formation and Accumulation Zone:
• The stock established a strong base between 117-125 levels from March to July 2025
• Multiple retests of the 117 support level showed strong buying interest
• Base formation lasted approximately 4 months, indicating thorough accumulation
• Volume during base formation remained relatively stable with occasional spikes
Key Support and Resistance Levels:
• Primary Support: 117.06 (marked as swing low and base support)
• Secondary Support: 140-145 zone (previous resistance turned support)
• Immediate Resistance: 165-170 zone (next major hurdle)
• Target Resistance: 180-185 zone (measured move target)
• 52-week High: 197.00 (ultimate resistance level)
Technical Patterns:
Rising Wedge Breakout Pattern:
• Clear rising wedge pattern formed over 4-5 months
• Lower highs and higher lows converged into a wedge formation
• Breakout occurred at 160+ levels with strong volume confirmation
• Pattern suggests continuation of the broader uptrend
Trend Analysis:
• Long-term trend: Bullish (higher highs and higher lows since March 2025)
• Medium-term trend: Bullish breakout from consolidation
• Short-term trend: Strong bullish momentum post-breakout
• Moving averages alignment suggests sustained upward momentum
Chart Patterns and Indicators:
• Cup and handle formation visible in the broader timeframe
• Multiple flag patterns during the consolidation phase
• Price above all key moving averages, indicating bullish sentiment
Trade Setup and Strategy:
Entry Levels:
• Aggressive Entry: 155-160 levels (on any minor pullback)
• Conservative Entry: 145-150 levels (on deeper retracement to support)
• Breakout Entry: Above 165 levels with volume confirmation
• averaging between 150-160 for position building
Exit Levels and Targets:
• Target 1: 180-185 levels (initial profit booking - 15-20% upside)
• Target 2: 195-200 levels (testing previous highs - 25-30% upside)
• Target 3: 220-230 levels (extended target - 40-45% upside)
• Swing high exit: Trail stops below key support levels
Stop-Loss Strategy:
• Initial Stop-Loss: Below 140 levels (10-12% risk from current levels)
• Trailing Stop-Loss: Below 150 levels once 180 is achieved
• Pattern Stop-Loss: Below the wedge support around 145 levels
• Time-based stop: Exit if no progress in 2-3 months
Position Sizing and Risk Management:
• Maximum position size: 2-3% of total portfolio
• Risk per trade: Not more than 1% of portfolio value
• Scale in approach: 50% at entry, 30% on dip, 20% on breakout confirmation
• Maintain a risk-reward ratio of a minimum of 1:3
Sectoral and Fundamental Backdrop:
Company Overview:
• NSE:RAIN is one of the world's largest producers of calcined petroleum coke, coal tar pitch and other high-quality basic and speciality chemicals
• Market Cap: 5,405 Crore with Revenue: 15,472 Cr
• Promoter Holding: 41.2% indicating stable management control
Financial Health Assessment:
• The company has a low interest coverage ratio, which poses some financial risk
• Net Profit: ₹-115.10Cr as on March 2025 (Q4 FY25) showing current losses
• The company has delivered a poor sales growth of 4.46% over the past five years
• Recent debt reduction efforts as management focuses on prepaying obligations
Business Segments Performance:
• Carbon Business: Environment-friendly and energy-efficient practices have made RAIN's carbon business highly profitable and sustainable
• The carbon business co-generates energy at six calcined petroleum coke plants with a combined power-generation capacity of approximately 135 MW
• The speciality chemicals segment is showing resilience despite market challenges
Sector Outlook and Industry Trends:
• In 2025, the industry is expected to continue its recovery, adjusting to new market drivers while balancing short- and long-term goals
• Chemical industry focusing on decarbonization and innovation initiatives
• India Ratings affirms Rain Industries' credit rating at IND A/Stable with stable outlook and improved operational outlook
Key Risk Factors:
• Cyclical nature of the chemical industry affecting margins
• High debt levels and interest coverage concerns
• Global economic slowdown has an impact on demand
• Raw material price volatility
• Environmental regulations affecting operations
Positive Catalysts
• Debt reduction strategy showing management commitment
• Stable credit rating with improved operational outlook
• Strong technical breakout indicating renewed investor interest
• Global chemical industry recovery supporting sector sentiment
• Energy co-generation capabilities providing cost advantages
Risk Assessment and Monitoring:
Key Levels to Watch:
• Break below 145: Bearish signal, consider exit
• Sustain above 165: Bullish confirmation for higher targets
• Volume patterns: Declining volume on up moves would be concerning
• Sector rotation: Monitor chemical sector performance relative to the broader market
Regular Review Parameters:
• Weekly closing above key moving averages
• Monthly volume trends and institutional participation
• Quarterly earnings performance and guidance
• Industry developments and regulatory changes
• Management commentary on debt reduction progress
Exit Triggers:
• Fundamental deterioration in business metrics
• Break of key technical support levels
• Adverse sector developments
• Better opportunities in other stocks/sectors
• Achievement of target levels with profit booking
My Take:
NSE:RAIN presents a technically attractive setup with the rising wedge breakout, but investors should be cautious about the fundamental challenges. The trade setup offers good risk-reward ratios for short to medium-term positions, while long-term investors should wait for clearer signs of fundamental improvement.
Keep in the Watchlist and DOYR.
NO RECO. For Buy/Sell.
📌Thank you for exploring my idea! I hope you found it valuable.
🙏FOLLOW for more
👍BOOST if you found it useful.
✍️COMMENT below with your views.
Meanwhile, check out my other stock ideas on the right side until this trade is activated. I would love your feedback.
Disclaimer: "I am not a SEBI REGISTERED RESEARCH ANALYST AND INVESTMENT ADVISER."
This analysis is intended solely for informational and educational purposes and should not be interpreted as financial advice. It is advisable to consult a qualified financial advisor or conduct thorough research before making investment decisions.
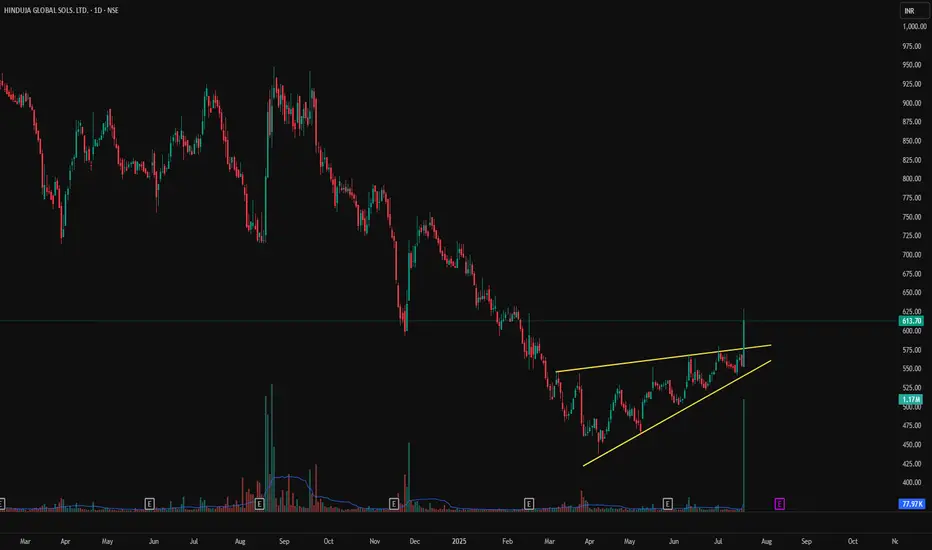
HGS - Rising Wedge Breakout on Volume Spike | Daily Chart📊 HGS – Rising Wedge Breakout on Volume Spike | RSI Above 70 | Fresh Bullish Momentum
📅 Chart Date: July 17, 2025
📍 CMP: ₹613.70 (+10.72%)
📈 Symbol: NSE:HGS | 1D Timeframe
🔍 Technical Analysis Breakdown
🔺 Rising Wedge Breakout
Price broke above the upper resistance of a rising wedge pattern.
Strong confirmation with a wide bullish candle and volume spike.
📊 Volume Surge
Volume: 1.17M against average volume of ~78K
Sudden institutional interest or news-based momentum likely behind the move.
📉 RSI (14, close): 73.03
RSI crossed into overbought territory, showing strong bullish momentum but could warrant caution or consolidation soon.
📌 Support & Resistance Levels
Breakout Zone: ₹580–₹590
Next Resistance: ₹650+ (gap-fill zone from earlier breakdown)
Support: ₹560 (upper trendline of broken wedge)
📌 Key Observations
First strong breakout since months of sideways to bullish accumulation.
Sustained close above ₹590–₹600 will confirm continuation.
Caution if price retraces inside wedge again.
🏁 Trade Setup
Entry: On Retest of ₹590–₹600
Target: ₹650 / ₹675
Stoploss: Below ₹560
Risk Level: Moderate (due to overbought RSI)
⚠️ Disclaimer: This is an educational chart setup and not trading advice. Please conduct your own research and risk management.
📣 Follow @PriceAction_Pulse for more such clean breakouts and chart pattern analysis!
🔁 Drop a comment if HGS is on your radar for the next breakout rally 📈
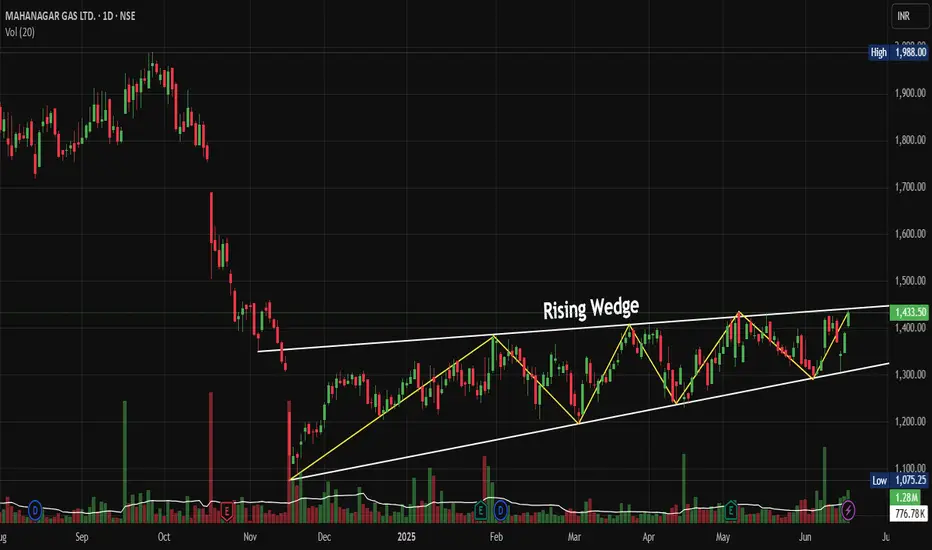
MGL: Rising Wedge Breakout Sets Stage for Explosive RallyNSE:MGL : Rising Wedge Breakout Sets Stage for Explosive Rally after management guidance of double-digit volume growth for the next three to four years.
Price Action Analysis:
• Stock has formed a classic Rising Wedge pattern from November 2024 lows around 1,075 to current levels near 1,433
• The wedge shows converging trendlines with higher highs and higher lows, typical of consolidation before a breakout
• Recent breakout above the upper trendline around 1,400 levels confirms bullish momentum
• Price has rallied 33% from the wedge base, indicating strong underlying demand
Volume Spread Analysis:
• Volume spikes are visible during key breakout moments, particularly in recent sessions
• Higher volume on up days compared to down days suggests institutional accumulation
• Volume expansion during the wedge breakout confirms genuine buying interest
• Recent green volume bars indicate sustained buying pressure supporting the uptrend
Key Technical Levels:
Support Levels:
• Immediate support at 1,380-1,400 (previous resistance turned support)
• Secondary support at 1,300 (middle of the rising wedge)
• Major support at 1,200-1,250 (lower trendline of the wedge)
• Critical support at 1,075 (November 2024 lows)
Resistance Levels:
• Immediate resistance at 1,450-1,470 (psychological levels)
• Next resistance at 1,500 (round number resistance)
• Extended target at 1,600-1,650 based on wedge height projection
• 52-Week high resistance around 1,988 (historical peak)
Technical Patterns:
• Rising Wedge pattern near to completion with successful breakout
• Multiple higher highs and higher lows confirming uptrend structure
• Potential cup and handle formation on longer timeframes
• Bullish flag consolidation patterns within the broader uptrend
Trade Setup:
Entry Strategy:
• Primary entry on pullback to 1,400-1,420 levels (retest of breakout zone)
• Aggressive entry at the current market price of around 1,433 for momentum players
• Scale-in approach: 50% at 1,420, 25% at 1,380, 25% at 1,350
Exit Levels:
• First target: 1,500 (16% upside from current levels)
• Second target: 1,600 (22% upside potential)
• Extended target: 1,700-1,750 for long-term holders
• Trailing stop-loss strategy recommended above 1,500 levels
Stop-Loss Placement:
• Conservative stop-loss: 1,320 (below wedge support)
• Aggressive stop-loss: 1,380 (below immediate support)
• Risk-reward ratio of 1:2 to 1:3 depending on entry and exit points
Position Sizing and Risk Management:
• Allocate a maximum of 2-3% of the portfolio to a single position
• Use a 1% risk per trade rule based on stop-loss distance
• Consider partial profit booking at 1,500 levels
• Maintain position size discipline to avoid overexposure
Sectoral and Fundamental Backdrop:
Sector Analysis:
• City Gas Distribution (CGD) sector showing resilience amid energy transition
• The government push for clean fuel adoption, supporting the natural gas demand
• Infrastructure expansion in tier-2 and tier-3 cities benefiting CGD companies
• Regulatory environment remains supportive with steady tariff mechanisms
Fundamental Strengths:
• NSE:MGL operates in prime Mumbai and adjoining areas with stable demand
• Strong cash flows from residential and industrial customer base
• Consistent dividend-paying track record with healthy payout ratios
• Robust balance sheet with minimal debt and strong return on equity
• Expanding PNG and CNG network, providing growth visibility
Key Catalysts:
• Increasing vehicle conversion to CNG, supporting volume growth
• Industrial demand recovery post-pandemic is driving commercial sales
• Government policies favouring cleaner fuel alternatives
• Potential for geographical expansion into new license areas
Risk Factors:
• Crude oil price volatility is affecting input costs
• Competition from electric vehicles in the transportation segment
• Regulatory changes in gas pricing mechanisms
• Economic slowdown impacting industrial demand
My Take:
The technical setup suggests NSE:MGL is well-positioned for continued upward momentum following the rising wedge breakout. The combination of strong fundamentals, supportive sector dynamics, and bullish technical patterns creates an attractive risk-reward proposition for both swing and positional traders. However, traders should remain disciplined with position sizing and risk management given the stock's premium valuation at current levels.
Keep in the Watchlist.
NO RECO. For Buy/Sell.
📌Thank you for exploring my idea! I hope you found it valuable.
🙏FOLLOW for more
👍BOOST if you found it useful.
✍️COMMENT below with your views.
Meanwhile, check out my other stock ideas on the right side until this trade is activated. I would love your feedback.
Disclaimer: "I am not a SEBI REGISTERED RESEARCH ANALYST AND INVESTMENT ADVISER."
This analysis is intended solely for informational and educational purposes and should not be interpreted as financial advice. It is advisable to consult a qualified financial advisor or conduct thorough research before making investment decisions.
DRREDDY - PRICE REENTERING RISING WEDGE CHANNELHi All,
This idea is about Dr Reddys Lab
Fundamentals
Mkt Cap - 106810 Cr
Stock PE - 19.2
ROE - 21%
ROCE - 27%
Mkt Cap/Sales - 3.8
OPM - 28%
Technicals
Price was pushed back to follow the rising wedge pattern & if it sustains above the marked (white line) resistance, can further show an upside of 8-10% to reach the upper channel of rising wedge
Happy Trading,
Thanks,
Stock-n-Shine

SUNDARAM FINANCE - RISING WEDGE SINCE AN YR Hi All,
This idea is about Sundaram Finance Holding
Fundamentals
Market Cap - 6k Cr
Mkt Cap/Sales - 20.9
ROE - 12%
P/BV - 1.27
Div Yield - 2.81%
Technicals
Price action has been in a rising wedge pattern since Jul 23 & currently consolidating at the bottom of channel for past few days. It can give a upmove of nearly 25% in very short term.
Traders can take positional trades to capture the move.
There is a small resistance for which traders need to be careful. Price reverted twice from that level
SL will be lower channel breach
Hope for a successful trade,
Thanks,
Stock-n-Shine

Rising Wedge Pattern Breakout in GRASIM INDUGRASIM INDUSTRIES
Key highlights: 💡⚡
✅On 1Hour Time Frame Stock Showing Breakout of Rising wedge Pattern .
✅ Strong Bullish Candlestick Form on this timeframe.
✅It can give movement up to the Breakout target of 1855+.
✅Can Go Long in this stock by placing a stop loss below 1740-.

FDC LTD - 42% RETURNS!!!BUY - FDC LTD
CMP - Rs. 299
Target - 1: Rs. 360
Target - 2: Rs. 400
Target - 3: Rs. 430
.
.
Technicals - Trendline nearing BO
.
This is just a view by an expert analyst, please invest at your own risk.
.
Follow me for more!

BankNifty Tidal Wave- Ride or Crash? 15th May 2023Welcome back to another episode of Wave Talks. Bank Nifty's Tidal Wave -Ride or Crash: Index can face a significant shift with the unfolding ending diagonal. Will you ride the wave to profit or crash on the shore? Unfolding wedge pattern
It's time to reconsider Bank Nifty's pattern as it poses a risk. Let us discuss in details price objective & outlook for next few weeks with key & critical levels for better risk management.
Last Idea - BankNifty's Danger -Is this a rising wedge

Rising wedge breakout in LTLT has given a breakout from rising wedge pattern.
However, today's candle is an inverted hammer which might be a sign of reversal and hence, it is a wait and watch scenario.
One can enter if there is a retest and continuation of uptrend from 2250-2300 levels

MINDA ON BOOOMIt can be buy but after break out another it will go down or conform the downtrend or it will go down and up and conform the uptreand and my opinion is it can be a buy but after breakout and a conformatioin of a green candle and target 1 is 1123 and target 2 is 1275 and you know that it giving split and diviend on 9 jun and market trend is bullish pls like and follow me TECHDARSHRESEARCHER and wait for new idea bye take care
Pls trade on your own risk bye

PGHH possibly to move down.PGHH possible to move down
A rising wedge formed in price action area,
A bearish divergence shown.

Brigade - Super Buliish !!Stock has broken previous swing high (acting as resistance) and also the rising wedge formation with high volumes.
Looks good to break ATH of 327 in coming sessions
SWING - Target 340, 350 SL 299
Intraday - 327 above 321
P.S. Can accumulate at lower levels as well if stock comes down to 305 levels for pullback before again moving up

Rising Wedge pattern in weekly chart of TCSProbable scenario:- The rising wedge pattern is a probable sign of a strong bearish movement. In the case of TCS, if the price doesn't hold the support line it might go bearish . If the price doesn't find immediate support while retracing it might go for a strong bearish move.
Alternate Scenario:- If the price breakouts the resistance level and holds that position for some period then the strong bullish trend might continue which is less probable to happen.
Probable scenario: Alternate Scenario = 70 : 30

BAJAJ FINSERV TRADE PLAN Clearly, we can see that a rising wedge has been formed, gave breakdown and retest. This is a wonderful opportunity to short sell futures.

RISING WEDGE-BEARISHRising wedge pattern on INDUSIND BANK 1 hr timeframe.
this is not advice. I'm in a learning phase and am looking for suggestions. and feedback.
also on the same chart at 5 min timeframe, there is a descending triangle pattern indicating bearish momentum and downside breakout.

BANKNIFTY ANALYSIS FOR 15/04/2021# RISING WEDGE PATTERN
# SHORT BANKNIFTY
# FOLLOW AND LIKE FOR DAILY UPDATES

#ZEEL is ready for shortingA Rising wedge pattern has formed in NSE:ZEEL
DISCLAIMER : This is just for educational purpose....

XAUUSD - sell down 4h chartXAUUSD : xauusd is currently going to sell down for beyond the technical analysis XAUUSD sell down
REASONS :
1. Trend reversed into the down trend
2. Continuation Pattern : rising wedge formed..
3. xauusd is corrective wave also completed to going down.........
