M&M _ Rising Wedge Formation📊 M&M – Technical & Educational Snapshot
Ticker: NSE: M&M | Sector: 🚙 Auto
CMP: ₹2,7XX (as of 16 Aug 2025)
Rating (for learning purpose): ⭐⭐⭐⭐
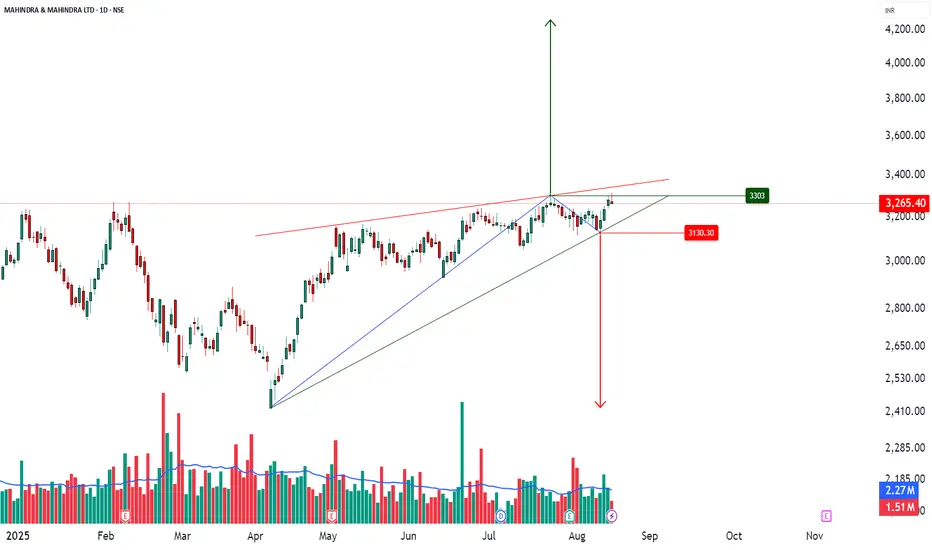
Pattern Observed: 📉 Rising Wedge Formation (Bearish Reversal Case Study)
🔑 Key Reference Levels (For Learning)
Support / Breakdown Zone: Lower wedge trendline
Resistance / Rejection Zone: Upper wedge trendline
Bearish Projection (Case Study): ~₹2,410
Bullish Continuation (Alternative View): ~₹3,300
📌 Pattern Observations
✅ Price forming higher highs & higher lows but within converging trendlines
✅ Momentum slowing → smaller swings inside wedge
✅ Typical bearish reversal structure (confirmation needed)
✅ Volume + RSI divergence can add conviction
📝 STWP Trade Analysis (Educational Illustration Only)
1️⃣ Bearish Breakdown (Primary Scenario)
Observation: Breakdown below wedge support often studied as bearish signal
Stop Loss (Learning Reference): Above upper wedge / recent swing high
Downside potential: ₹2,410 (measured move projection)
2️⃣ Bullish Breakout (Alternative Scenario)
Observation: Breakout above wedge resistance may lead to continuation
Stop Loss (Learning Reference): Below wedge / recent swing low
Upside potential: ₹3,300
📊 Risk Management & Confirmation
Traders typically wait for daily close outside wedge boundaries
Volume confirmation is key → spikes above average strengthen the move
RSI divergence often adds confidence to the setup
📌 Summary (Learning View Only)
The M&M Rising Wedge is a classic reversal study.
Key lesson: A wedge pattern teaches how slowing momentum can shift market control — but confirmation with volume + price close is essential before validating either direction.
⚠️ Disclaimer – Please Read Carefully
The information shared here is meant purely for learning and awareness. It is not a buy or sell recommendation and should not be taken as investment advice. I am not a SEBI-registered investment advisor, and all views expressed are based on personal study, chart patterns, and publicly available market data.
Trading — whether in stocks or options — carries risk. Markets can move unexpectedly, and losses can sometimes be larger than the money you have invested. Past performance or past setups do not guarantee future results.
If you are a beginner, treat this as a guide to understand how the market works — practice on paper trades before risking real money. If you are an experienced trader, remember to assess your own risk, position sizing, and strategy suitability before entering any trade.
Consult a SEBI-registered financial advisor before making any real trading decision.
By reading, watching, or engaging with this content, you acknowledge that you take full responsibility for your own trades and investments.
________________________________________
💬 Found this useful?
🔼 Give this post a Boost to help more traders discover clean, structured learning.
✍️ Drop your thoughts, questions, or setups in the comments — let’s grow together!
🔁 Share with fellow traders and beginners to spread awareness.
✅ Follow simpletradewithpatience for beginner-friendly setups, price action insights & disciplined trading content.
🚀 Stay Calm. Stay Clean. Trade With Patience.
Trade Smart | Learn Zones | Be Self-Reliant 📊
Risingwedgepattern
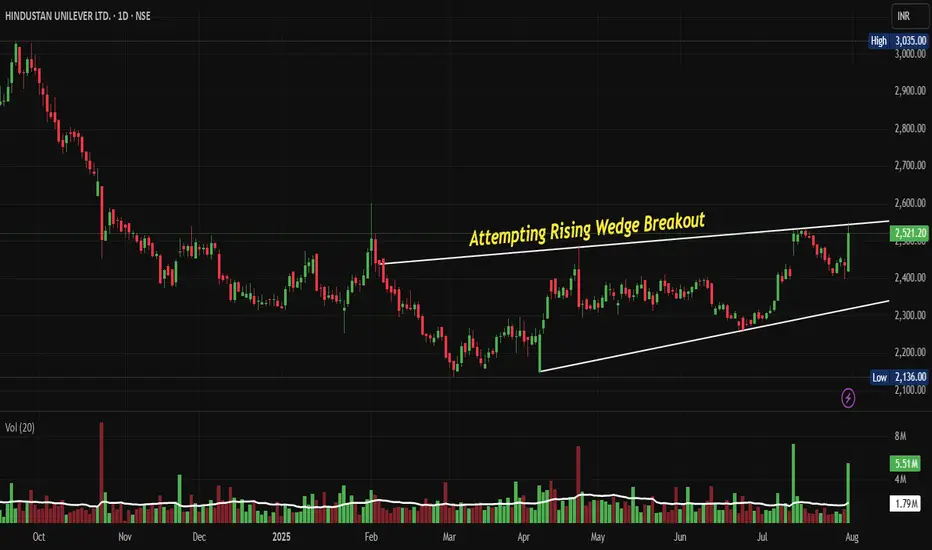
HINDUNILVR: Attempting Rising Wedge Breakout Post Q1 FY 26NSE:HINDUNILVR Attempting Rising Wedge Breakout: A Technical Revival Story Worth Watching Post Decent above Estimate Volume Growth and Q1 FY26 Results.
Price Action:
• Trading within a well-defined rising wedge pattern from February 2025 to July 2025
• The stock experienced a significant decline from its peak around ₹3,035 in September 2024 to a low of ₹2,136 in March 2025
• Currently trading at ₹2,521.20 with a gain of ₹83.80 (+3.44%)
• The stock appears to be attempting a breakout from the upper trendline of the rising wedge
Volume Spread Analysis:
• Volume has been relatively subdued during the consolidation phase within the wedge
• Recent sessions show increased volume activity with 5.51M shares traded, indicating renewed interest
• The volume pattern suggests accumulation during the lower levels of the wedge formation
• Volume spike accompanies the current breakout attempt, confirming the move
Key Technical Levels:
Key Support Levels:
• Immediate support: ₹2,420-₹2,450 (recent consolidation zone)
• Strong support: ₹2,300-₹2,350 (lower trendline of the rising wedge)
• Critical support: ₹2,136 (52-week low established in March 2025)
Resistance Levels:
• Immediate resistance: ₹2,550-₹2,580 (upper trendline breakout zone)
• Next resistance: ₹2,700-₹2,750 (previous swing highs)
• Major resistance: ₹3,035 (52-week high from September 2024)
Technical Patterns:
• Rising Wedge Pattern: A bearish reversal pattern that has been forming since Feb 2025
• Breakout Attempt: The stock is testing the upper boundary of the rising wedge with increased volume
• Higher Lows Formation: Despite the wedge pattern, the stock has been making higher lows since March 2025
Trade Setup:
Entry Strategy:
• Primary Entry: On sustained breakout above ₹2,550 with volume confirmation
• Secondary Entry: On pullback to ₹2,480-₹2,500 after successful breakout
• Aggressive Entry: Current levels around ₹2,520 for short-term traders
Exit Levels:
• Target 1: ₹2,680-₹2,700 (8-10% upside potential)
• Target 2: ₹2,850-₹2,900 (15-18% upside potential)
• Target 3: ₹3,000-₹3,050 (20-25% upside potential)
Stop-Loss Strategy:
• Conservative: ₹2,350 (below the rising wedge support)
• Moderate: ₹2,420 (below immediate support zone)
• Tight: ₹2,480 (for breakout trades)
Position Sizing:
• Conservative investors: 2-3% of portfolio allocation
• Moderate risk appetite: 4-5% of portfolio allocation
• Aggressive traders: 6-8% of portfolio allocation
Risk Management:
• Risk-Reward Ratio: Maintain a minimum 1:2 ratio for all entries
• Trailing Stop: Implement a 5-7% trailing stop after 10% gains
• Partial Profit Booking: Book 30% profits at Target 1, 40% at Target 2, and hold 30% for Target 3
Sectoral and Fundamental Backdrop:
FMCG Sector Overview:
• BSE FMCG index was up 1 per cent, as compared to a 0.5 per cent decline in the BSE Sensex
• The FMCG sector is showing resilience amid broader market volatility
• Rural demand recovery is expected to support sector growth in the coming quarters
Financial Performance:
• TTM Revenue: 63,928 Cr, TTM Profit: 10,827 Cr
• The company has delivered a poor sales growth of 10% over the past five years
• Annual revenue for March 2025 reached Rs 63,121 Crore, up 2%. Net profit rose 3.8% to Rs 10,671 Crore
Valuation Metrics:
• HUL's stock trades at a Price-to-Earnings (P/E) ratio around 55.70x, slightly below its historical averages (~61x over 5 years)
• Stock is trading at 12 times its book value
• Market Cap: 5,92,476 Crore (down -6.82% in 1 year)
Business Fundamentals:
• Promoter Holding: 61.9%
• Strong brand portfolio across multiple FMCG categories
• Extensive distribution network covering both urban and rural markets
• Urban markets contribute 60 per cent to HUL's sales, while rural markets comprise the rest
Recent Developments:
• Motilal Oswal analysts believe that volume growth for HUL has reached its lowest point and foresee a gradual recovery in volumes during FY25
• Brokerages tracked by Business Standard estimate HUL's net profit to decline 1.2 per cent year-on-year (Y-o-Y) on average, to ₹2,540.6 crore
• The company is expected to benefit from improving rural demand and premiumization trends
My Take:
• HUL remains a defensive play in the FMCG space with strong market positioning
• The technical breakout attempt coincides with expectations of volume recovery
• Long-term investors can consider accumulating on dips while traders can play the breakout momentum
Keep in the Watchlist and DOYR.
NO RECO. For Buy/Sell.
📌Thank you for exploring my idea! I hope you found it valuable.
🙏FOLLOW for more
👍BOOST if you found it useful.
✍️COMMENT below with your views.
Meanwhile, check out my other stock ideas on the right side until this trade is activated. I would love your feedback.
Disclaimer: "I am not a SEBI REGISTERED RESEARCH ANALYST AND INVESTMENT ADVISER."
This analysis is intended solely for informational and educational purposes and should not be interpreted as financial advice. It is advisable to consult a qualified financial advisor or conduct thorough research before making investment decisions.
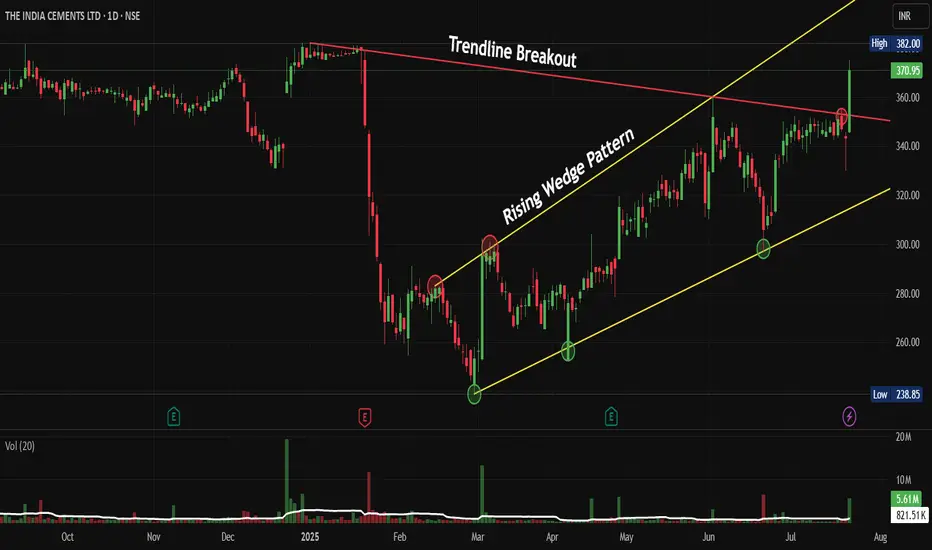
INDIACEM: Trendline Breakout Inside a Rising Wedge PatternNSE:INDIACEM Breaks Key Resistance: Is This the Start of a New Bull Run, after Ultratech Cement's Bullish Commentary Post Results?
Price Action:
• The stock has demonstrated a classic rising wedge pattern formation throughout 2025, indicating controlled accumulation
• Current price of ₹370.95 represents a significant breakout above the Trendline resistance
• The breakout is accompanied by substantial volume expansion (5.61M vs average), confirming institutional participation
• Price has recovered strongly from the March 2025 low of approximately ₹240, representing a 54% rally
Volume Spread Analysis:
• Volume spike visible during the recent breakout phase, indicating genuine buying interest
• Historical volume patterns show increased participation during key support bounces
• Current volume of 821.51K is significantly above average, supporting the breakout thesis
• Volume profile suggests institutional accumulation during the consolidation phases
Technical Patterns and Levels:
Base Formation:
• Primary base established between ₹240-280 levels during February-March 2025
• Secondary base formed around the ₹300-320 range during the wedge consolidation
• Multiple successful tests of these base levels confirm strong demand zones
Support Levels:
• Immediate support: ₹350 (previous resistance now turned support)
• Secondary support: ₹320-330 (wedge midpoint)
• Strong support: ₹300 (multiple bounce level)
• Ultimate support: ₹240-250 (March 2025 low)
Resistance Levels:
• Immediate resistance: ₹380-382 (current high area)
• Next target: ₹400-420 (measured move from wedge)
• Long-term resistance: ₹450-470 (based on pattern projection)
Technical Patterns:
• Rising Wedge Pattern: Successfully above wedge Support with volume
• Trendline Break: Clean break above descending trendline resistance
• Multiple Bottom Formation: Strong base building around ₹240-280 levels
• Volume Expansion: Confirming the validity of the current breakout
Trade Setup:
Entry Strategy:
• Primary Entry: ₹365-370 (current levels on any minor pullback)
• Aggressive Entry: ₹371-375 (momentum continuation)
• Conservative Entry: ₹350-355 (retest of breakout level)
Target Levels:
• Target 1: ₹400 (immediate resistance, 8% upside)
• Target 2: ₹430 (wedge measured move, 16% upside)
• Target 3: ₹470 (extended target, 27% upside)
Stop-Loss Levels:
• Tight Stop: ₹345 (below breakout level, 7% risk)
• Comfortable Stop: ₹320 (below wedge support, 14% risk)
• Long-term Stop: ₹300 (major support breach, 19% risk)
Risk Management:
Position Sizing:
• Conservative Approach: 2-3% of portfolio (given sector volatility)
• Moderate Risk: 4-5% of portfolio for experienced traders
• Maximum allocation: Not more than 7-8% considering stock-specific risks
Risk-Reward Analysis:
• Risk-Reward Ratio: 1:2 to 1:3 depending on entry and stop levels
• Probability of success: High (70-75%) given technical setup
• Time horizon: 3-6 months for target achievement
Portfolio Considerations:
• Diversification across cement stocks recommended
• Monitor sector rotation and infrastructure spending announcements
• Consider hedging through index options if holding large positions
Sectoral and Fundamental Backdrop:
Cement Industry Outlook 2025:
• Industry expects 7-8% growth in cement demand for FY25, driven by infrastructure development
• Government allocated ₹2.87 lakh crore for road infrastructure, supporting cement demand
• Capacity utilization expected to improve to 72% from current levels
• Addition of 35-40 million tonnes of new capacity, primarily in eastern and southern India
India Cements Fundamentals:
• Market capitalization: ₹11,511 crores as of current levels
• Manufacturing capacity: 14.75 MTPA after recent expansions
• Product mix: 35% Ordinary Portland Cement, 65% Portland Pozzolana Cement
• Notable sponsorship: IPL franchise Chennai Super Kings (brand visibility)
• Revenue: ₹1,025 crores in Q1 FY26 (-0.20% YoY decline but improving margins)
Growth Catalysts:
• Infrastructure spending boost from Union Budget 2025-26
• India cement market projected to grow at 7.6% CAGR through 2033
• Rising construction activities in the southern and eastern regions
• Potential for market consolidation benefiting established players
• Promoter holding increased to 81.49% (from 28.42% in June 2024), indicating strong confidence
Risk Factors:
• Raw material cost inflation impacting margins
• Seasonal demand variations affecting quarterly performance
• Competition from larger players like Ambuja Cements
• Environmental regulations potentially increasing compliance costs
• Regional demand concentration in southern markets
My Take:
NSE:INDIACEM presents a compelling technical setup with the successful breakout from a Trendline into a rising wedge pattern. The combination of strong volume support, improving sectoral fundamentals, and a favourable government policy backdrop creates an attractive risk-reward proposition. However, traders should maintain proper position sizing and risk management given the inherent volatility in cement stocks.
Keep in the Watchlist and DOYR.
NO RECO. For Buy/Sell.
📌Thank you for exploring my idea! I hope you found it valuable.
🙏FOLLOW for more
👍BOOST if you found it useful.
✍️COMMENT below with your views.
Meanwhile, check out my other stock ideas on the right side until this trade is activated. I would love your feedback.
Disclaimer: "I am not a SEBI REGISTERED RESEARCH ANALYST AND INVESTMENT ADVISER."
This analysis is intended solely for informational and educational purposes and should not be interpreted as financial advice. It is advisable to consult a qualified financial advisor or conduct thorough research before making investment decisions.
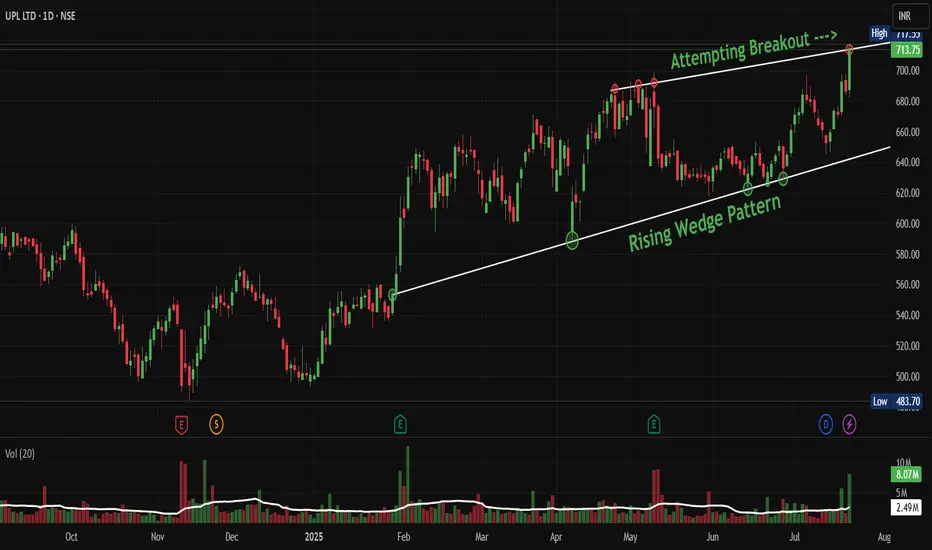
UPL: Rising Wedge Breakout Could Signal Fresh HighsNSE:UPL : Rising Wedge Breakout Could Signal Fresh Highs, But Manage Risk Carefully
Price Action Analysis:
- Current Price: ₹713.75 (+3.92%)
- 52-Week High: ₹717.55
- 52-Week Low: ₹483.70
- The stock is trading near all-time highs with strong momentum
Volume Spread Analysis
- Volume spikes are visible during key breakout points
- Recent volume of 8.07M is above average, confirming breakout attempt
- Volume pattern shows selling pressure during declines and buying interest on rallies
- The volume surge in July suggests institutional participation
Chart Pattern:
Rising Wedge Pattern:
- A classic rising wedge pattern has formed from February 2025 to July 2025
- The pattern shows converging trendlines with higher highs and higher lows
- Volume has been decreasing during the formation, which is typical for rising wedges
- The stock is attempting a breakout from the upper trendline resistance
Key Technical Levels:
Support Levels:
- Immediate Support: ₹680 (recent consolidation zone)
- Strong Support: ₹640 (rising trendline support)
- Major Support: ₹580 (previous resistance turned support)
Resistance Levels:
- Immediate Resistance: ₹720 (psychological level)
- Next Resistance: ₹750 (projected target based on wedge height)
- Extended Target: ₹800 (measured move from base)
Base Formation Analysis:
- The stock formed a solid base between ₹480-₹550 from October 2024 to January 2025
- This accumulation phase lasted approximately 4 months
- Strong buying emerged from the ₹500 level multiple times
- The breakout from this base began in February 2025
Trade Setup:
Entry Strategy:
- Aggressive Entry: ₹714-₹716 (current levels on confirmed breakout)
- Conservative Entry: ₹695-₹700 (on any pullback to support)
- Accumulation Entry: ₹680-₹685 (if stock retraces to wedge support)
Target Levels:
- Target 1: ₹750 (immediate target - 5% upside)
- Target 2: ₹780 (medium-term target - 9% upside)
- Target 3: ₹820 (extended target - 15% upside)
Stop Loss Levels:
- For Aggressive Entry: ₹675 (5.5% risk)
- For Conservative Entry: ₹665 (5% risk)
- For Accumulation Entry: ₹655 (4% risk)
Position Sizing Guidelines:
- Risk per trade: 2% of portfolio maximum
- For ₹100,000 portfolio with ₹714 entry and ₹675 stop: 51 shares maximum
- Adjust position size based on individual risk tolerance
Risk Management Framework:
Trade Management Rules:
- Book 30% profits at Target 1
- Trail stop loss to breakeven after Target 1 is hit
- Book another 40% profits at Target 2
- Let the remaining 30% run with a trailing stop
Risk Factors to Monitor:
- Rising wedge patterns have a 60% failure rate historically
- Global agrochemical sector volatility
- Monsoon dependency for Indian agriculture
- Currency fluctuation impact on exports
Sectoral and Fundamental Backdrop:
Company Overview:
- NSE:UPL provides crop protection solutions, manufacturing and marketing agrochemicals, industrial chemicals, and speciality chemicals
- Global provider with annual revenue exceeding $5 billion, ranking among the top 5 agriculture solutions companies worldwide
Financial Performance:
- Market Cap: ₹58,088 Crore (up 37.1% in 1 year), Revenue: ₹46,637 Cr, Profit: ₹820 Cr
- Revenues grew 8.21% last year.
- The company has delivered a poor sales growth of 5.46% over the past five years
Recent Performance Metrics:
- Year-to-date increase of 29.48%, significantly outperforming the Sensex's 4.44% gain
- Delivered a robust return of 37.1% over the past year, compared to the Sensex's 12.13%
Credit Rating and Outlook:
- Fitch has revised its Long-Term Issuer Default Rating outlook on UPL Corp from 'Negative' to 'Stable', affirming the IDR at 'BB'
Sectoral Outlook:
- The company focuses on reducing environmental impact while enhancing soil health and water conservation through sustainable agriculture
- UPL ranked No. 1 globally in the agrochemical sector by Sustainalytics
- Growing focus on biological solutions and sustainable farming practices
Recent Corporate Actions:
- UPL's subsidiary to acquire 100% of Wuhan Advanta Seeds for USD 4,200 by Sept 2025
- Strategic partnership with Indian Potash Limited to revolutionise sugarcane farming in India
Investment/Trading Thesis:
Positive Factors:
- Strong technical breakout from the rising wedge pattern on cards
- Outperforming the broader market significantly
- Leading position in the global agrochemical sector
- Strategic acquisitions and partnerships
- Improved credit rating outlook
Risk Considerations:
- The company has a low interest coverage ratio
- Historical slow sales growth over 5 years
- Monsoon and weather dependency
- Rising wedge patterns can be bearish reversal signals
- Global commodity price volatility
My Take:
NSE:UPL presents a compelling technical setup with fundamental tailwinds from the agricultural sector. The rising wedge breakout, if sustained, could lead to significant upside. However, traders should maintain strict risk management given the pattern's inherent risks and the company's mixed fundamental metrics.
Keep in the Watchlist and DOYR.
NO RECO. For Buy/Sell.
📌Thank you for exploring my idea! I hope you found it valuable.
🙏FOLLOW for more
👍BOOST if you found it useful.
✍️COMMENT below with your views.
Meanwhile, check out my other stock ideas on the right side until this trade is activated. I would love your feedback.
Disclaimer: "I am not a SEBI REGISTERED RESEARCH ANALYST AND INVESTMENT ADVISER."
This analysis is intended solely for informational and educational purposes and should not be interpreted as financial advice. It is advisable to consult a qualified financial advisor or conduct thorough research before making investment decisions.
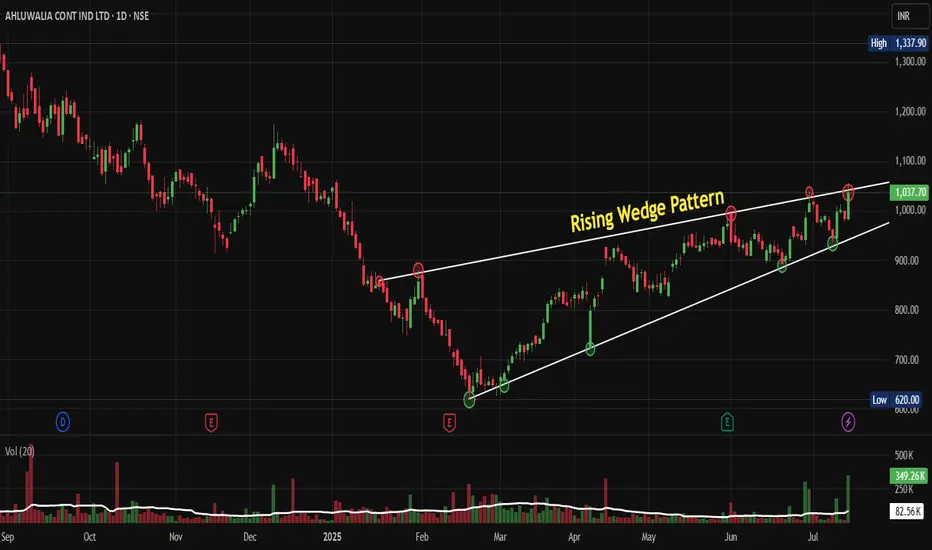
AHLUCONT: Rising Wedge pattern formationNSE:AHLUCONT Rising from the Ashes: How This Construction Giant is Trying to Break Out of Its Year-Long Consolidation Pattern. Let's Analyze
Price Action Analysis:
• The stock is displaying a classic Rising Wedge pattern formation over the past several months
• Current price of ₹1,037.70 represents a +54.00 gain (+5.49%) from the previous close
• The stock has established a strong base formation around the ₹620-650 levels as indicated by the low marker
• Multiple higher lows have been formed along the rising trendline, demonstrating buying interest at progressively higher levels
• The pattern shows a narrowing price range as it approaches the apex, typical of wedge formations
Volume Spread Analysis:
• Volume has been relatively subdued during the consolidation phase, which is characteristic of wedge patterns
• Recent session shows increased volume at 349.26K compared to the average, suggesting institutional participation
• Volume spikes appear to coincide with key support and resistance tests, indicating active participation at critical levels
Key Technical Levels:
Support Levels:
• Primary Support: ₹950-970 (recent breakout level)
• Secondary Support: ₹850-880 (previous consolidation zone)
• Major Support: ₹620-650 (base formation area)
Resistance Levels:
• Immediate Resistance: ₹1,050-1,070 (psychological level)
• Key Resistance: ₹1,100-1,120 (pattern target)
• Major Resistance: ₹1,300-1,337 (52-week high zone)
Technical Patterns:
• Rising Wedge Pattern: The stock has formed a rising wedge over several months, which typically indicates a continuation pattern in an uptrend
• Base Formation: A solid base has been established in the ₹620-650 range, providing strong support for future moves
Trade Setup:
Entry Strategy:
• Primary Entry: ₹1,040-1,050 (current levels with momentum confirmation)
• Secondary Entry: ₹980-1,000 (on any retracement to support)
• Breakout Entry: Above ₹1,070 with volume confirmation
Exit Strategy:
• Target 1: ₹1,120-1,150 (short-term target)
• Target 2: ₹1,200-1,250 (medium-term target)
• Target 3: ₹1,300+ (long-term target based on pattern projection)
Risk Management:
• Stop Loss: ₹950 (below recent support and breakout level)
• Position Size: Risk 1-2% of portfolio per trade
• Risk-Reward Ratio: Minimum 1:2 for all entries
Position Sizing Guidelines:
• Conservative investors: 2-3% of portfolio
• Moderate risk takers: 4-5% of portfolio
• Aggressive traders: 6-8% of portfolio (not recommended to exceed this)
Sectoral and Fundamental Backdrop:
Company Overview:
• Ahluwalia Contracts has a market cap of ₹6,936 crore with promoter holding at 55.32%
• The company reported revenue of ₹4,099 crore and profit of ₹202 crore
• Recent quarterly results show revenue of ₹1,215.84 crore and net profit of ₹83.33 crore for Q4 FY25
Sector Outlook:
• The infrastructure boom is set to lead India to become the third-largest construction market by 2025
• Government has bolstered capital expenditure by 11.1% to $133 billion for fiscal year 2024-25, equivalent to 3.4% of GDP
• The India Infrastructure Sector Market is expected to reach USD 190.70 billion in 2025 and grow at a CAGR of 8% to reach USD 280.60 billion by 2030
Government Support:
• Budget 2025-26 allocates INR 11.21 lakh crore for the infrastructure sector
• The FY2025–26 Budget outlines major allocations with INR 2.9 trillion for the Ministry of Road Transport and Highways, and INR 2.6 trillion for the Ministry of Railways
Growth Drivers:
• The flourishing housing market, coupled with the government's sustained and massive infrastructure push, has driven construction market growth
• Government-led initiatives aimed at advancing infrastructure are driving the Indian construction market growth during the forecast period
• The India Construction Market is projected to register a CAGR of greater than 6% during the forecast period (2025-2030)
Investment Rationale:
Bullish Factors:
• Strong technical breakout on cards from a well-defined pattern
• Robust government spending on infrastructure development
• The company's established market position in the construction sector
• Healthy financial metrics with consistent profitability
Risk Factors:
• Contingent liabilities of ₹1,963 crore present a concern
• Dividend payout has been low at 1.42% of profits over the last 3 years
• General market volatility could impact sector performance
• Execution risks in large infrastructure projects
My Take:
The stock presents a compelling technical setup with strong fundamental support from the government's infrastructure push. The rising wedge breakout, combined with increased volume and supportive sector dynamics, makes it an attractive investment opportunity for medium to long-term investors. However, strict adherence to stop-loss levels and position sizing guidelines is essential for risk management.
Keep in the Watchlist.
NO RECO. For Buy/Sell.
📌Thank you for exploring my idea! I hope you found it valuable.
🙏FOLLOW for more
👍BOOST if you found it useful.
✍️COMMENT below with your views.
Meanwhile, check out my other stock ideas on the right side until this trade is activated. I would love your feedback.
Disclaimer: "I am not a SEBI REGISTERED RESEARCH ANALYST AND INVESTMENT ADVISER."
This analysis is intended solely for informational and educational purposes and should not be interpreted as financial advice. It is advisable to consult a qualified financial advisor or conduct thorough research before making investment decisions.
SENCO - POST 20% CORRECTION, PA MIGHT REVERSE FRM BOTTOM CHANNELHi All,
This idea is about Senco Gold Ltd
The stock has corrected over 20% in this month alone & now have reached the lower channel of rising wedge formation. Volumes have dried up indicating the supply may have exhausted & Price action might soon reverse from this point
Stock can be bought if it gives a closing above 980 for further targets of T1 1010, T2 1070, T3 1150.
If the stock shows further downside then the support levels are S1 916, S2 864
The correction is due to poor quaterly results owing to heat wave, elections, and fewer wedding days although the sales was up 9% YoY
Fundamentals
Market Cap
₹ 7,398 Cr.
Current Price
₹ 952
High / Low
₹ 1,177 / 365
Stock P/E
39.2
Book Value
₹ 177
Dividend Yield
0.11 %
ROCE
13.4 %
ROE
16.2 %
Face Value
₹ 10.0
Equity capital
₹ 77.7 Cr.
No. Eq. Shares
7.77
EPS
₹ 24.3
Promoter holding
68.4 %
Change in Prom Hold
-0.01 %
Chg in Prom Hold 3Yr
%
Pledged percentage
0.00 %
Market Cap to Sales
1.41
Sales growth
28.3 %
PEG Ratio
1.92
EVEBITDA
20.3
Quick ratio
0.40
Trade receivables
₹ 64.4 Cr.
Sales
₹ 5,230 Cr.
Debt to equity
1.28
Price to book value
5.37
Free Cash Flow
₹ -324 Cr.
CMP / FCF
-42.4
Happy Trading,
Thanks,
Stock-n-Shine

BATAINDIA Rising Wedge Pattern BreakdownIn today's session, BATAINDIA gives breakdown of Rising Wedge pattern at 1795 level. After this breakdown expected downside target 1775 to 1730+ level in next few trading session according to chart pattern. Can short BATAINDIA below 1795 with stop loss of 1820 for this target.

Rising wedge formation in NIFTYPHARMANIFTYPHARMA index is forming the rising wedge formation on the daily chart. Rising wedge is a reversal pattern and is usually followed by a bearish price movement in the short term. This, along with the fact that a lot of pharma stocks are exhibiting similar bullish reversal patterns is a warning sign for pharma bulls. Best to refrain from entering fresh long positions in pharma stocks for a while.

Rising Wedge Pattern in BANKNIFTY Since last few trading session banknifty trading in rising wedge pattern. If banknifty bounce back from 36050 level expected it will continue this zone till 36450+. In case upside breakout of this pattern expected 36950+ target in upcoming trading sessions. Downside possible 1000+ points possible if its trading below 35900-. All detailed levels and details mentioned in chart.
