Risk Management & Psychology in Trading and Investing1. Understanding Risk in Trading and Investing
Risk refers to the possibility of losing capital or not achieving expected returns. Every financial decision carries some degree of uncertainty. Understanding risk is the first step in managing it effectively.
Types of Risk
Market Risk – The risk of losses due to overall market movements. For example, a stock falling because the market index declines.
Liquidity Risk – Difficulty in buying or selling an asset without impacting its price significantly. Illiquid stocks or real estate investments often face this risk.
Credit Risk – The possibility that a borrower will default on obligations, relevant in bonds, loans, and derivatives.
Operational Risk – Losses due to system failures, human errors, or external events.
Psychological Risk – The emotional and behavioral aspect of trading that can lead to poor decisions, often underestimated.
A solid risk management framework considers all types of risk and prepares the investor or trader to withstand potential losses.
2. Principles of Risk Management
Risk management is a structured approach to protecting capital while seeking growth. Effective risk management is proactive, not reactive. Key principles include:
a. Capital Allocation
Rule of Thumb: Never risk more than 1–2% of total capital on a single trade. This prevents a single failure from wiping out a significant portion of the portfolio.
Diversification across sectors, assets, and instruments reduces exposure to any one source of risk.
b. Stop Loss and Take Profit
Stop-loss orders automatically sell a position when it reaches a predetermined loss level, limiting downside.
Take-profit levels ensure gains are locked in, preventing profits from turning into losses.
Both tools enforce discipline and prevent emotional decisions.
c. Position Sizing
The size of each trade should correspond to risk tolerance and market volatility. A larger position in a volatile asset increases risk, while smaller positions reduce it.
d. Hedging
Hedging involves taking positions in correlated or opposite assets to reduce risk. For instance, using options to protect a stock portfolio from downward moves.
e. Risk-Reward Ratio
Successful traders seek setups with higher potential reward than risk (e.g., 2:1 or 3:1). This ensures that even a lower win rate can be profitable over time.
f. Continuous Monitoring
Markets are dynamic. Regularly reviewing positions, exposures, and strategies ensures risk management adapts to changing conditions.
3. The Role of Psychology in Trading
Trading and investing are as much about managing emotions as managing money. Psychological factors heavily influence decision-making, often leading to avoidable mistakes.
Common Psychological Biases
Overconfidence – Believing too strongly in one’s abilities can lead to oversized positions and excessive risk-taking.
Loss Aversion – The tendency to fear losses more than valuing equivalent gains, causing hesitation or premature exit from profitable trades.
Herd Mentality – Following the crowd without independent analysis, often leading to buying high and selling low.
Anchoring – Fixating on initial information (like purchase price) instead of adapting to current market conditions.
Recency Bias – Giving too much weight to recent events or performance when making decisions.
Emotional Triggers
Fear and greed are the two most powerful emotions in trading.
Fear may prevent taking profitable trades or trigger panic selling.
Greed may encourage chasing returns and overleveraging.
Mindset for Success
Accept that losses are part of the game. Even top traders lose trades regularly; the key is ensuring losses are small and controlled.
Focus on process over outcomes. Consistently applying rules and strategies yields better long-term results than obsessing over individual trade profits.
Develop patience and discipline. Emotional control often differentiates successful traders from unsuccessful ones.
4. Integrating Risk Management and Psychology
Risk management and psychology are intertwined. Even the best strategies fail if emotions override rules. Successful integration involves:
a. Predefined Plans
Define entry, exit, and risk levels before trading.
A structured plan reduces impulsive decisions caused by fear or greed.
b. Journaling
Record every trade, decision, and emotional state.
Reviewing the journal helps identify psychological patterns that impact performance.
c. Routine and Discipline
Regular routines, including analysis, review, and strategy adjustments, reinforce disciplined behavior.
d. Stress Management
Practices like meditation, exercise, or hobbies can reduce stress-induced trading mistakes.
e. Scenario Analysis
Stress-test portfolios for extreme market movements. Psychological preparedness for worst-case scenarios reduces panic decisions.
5. Practical Tips for Traders and Investors
Set Realistic Goals – Avoid chasing unrealistic returns; focus on steady, achievable gains.
Use Technology Wisely – Trading platforms with alerts, risk calculators, and automated stop-loss tools enhance risk control.
Maintain a Healthy Perspective – Accept that markets are unpredictable and focus on probabilities, not certainties.
Continuous Learning – Psychological biases evolve; studying behavioral finance improves awareness and response.
Review and Adapt – Markets change, and so should your strategies. Regular review ensures risk and psychology are continuously aligned.
6. Case Study: Risk and Psychology in Action
Consider a trader using leverage to maximize profits. Without risk management, a single adverse market move can wipe out capital. Add psychological pressure—fear of loss and hope for a rebound—and the trader may hold a losing position too long, doubling the loss. Conversely, a disciplined trader with proper stop-loss, position sizing, and emotional control can limit losses, survive downturns, and capitalize on future opportunities. This illustrates the critical interaction between risk management and psychology.
Conclusion
Risk management and psychology are inseparable in trading and investing. One protects capital, the other protects decision-making. Ignoring either can lead to catastrophic losses, while mastering both enables consistent, long-term success.
Key Takeaways:
Always define risk before entering any trade.
Control position sizes, diversify, and use stop-losses.
Recognize and manage psychological biases like fear, greed, and overconfidence.
Focus on process, discipline, and continuous learning rather than short-term outcomes.
In essence, trading is not a test of intellect alone but of discipline, emotional control, and strategic risk management. By integrating both technical skills and psychological mastery, investors and traders can navigate markets with confidence and resilience.
Riskmangement

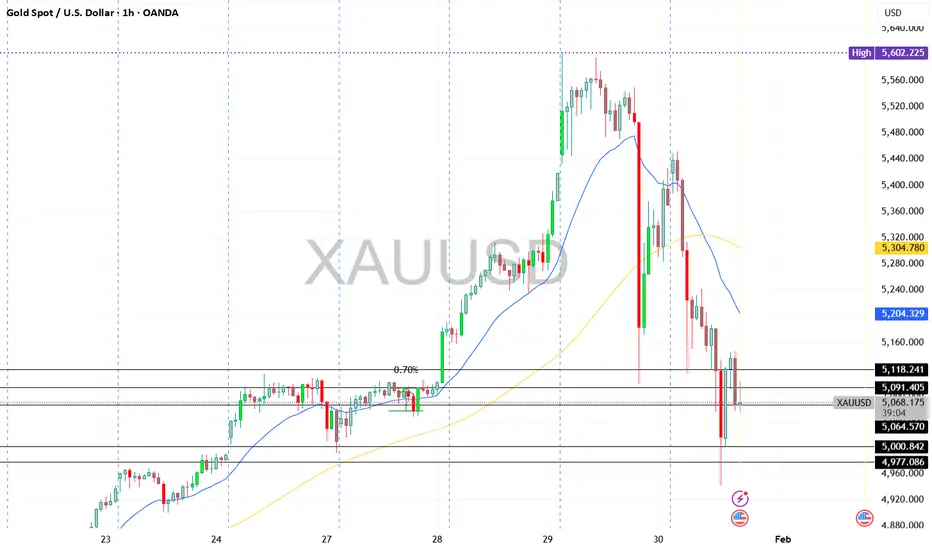
GOLD MARKET VOLATILITY - REALITY CHECK Noise is high around XAUUSD with headlines like “trillions wiped out” and “gold crashing”.
Let’s keep it factual.
Gold is volatile due to profit-booking after a historic rally, geo-political uncertainty, and US policy expectations.
This is correction + consolidation, not a confirmed crash.
💡 “Trillions wiped out” = notional intraday value swings, not permanent losses.
Key Levels to Watch (XAUUSD)
Resistance: 5250 – 5300
Support: 5080 – 5000 (major demand zone)
Below 5000: Only if volatility expands with strong volume
Key Takeaway for Traders 🎯
High volatility ≠ clear direction
Avoid revenge or blind trades
Let price settle → trade with risk control
🛑 Staying out is also a strategy
📊 Focus on Forex / Crypto / Indices if Gold is unstable
Risk management > FOMO
XAUUSD (Gold) | Technical Outlook | 12th Jan'2026XAUUSD (Gold Spot) | Technical Outlook | 12th Jan'2026
Gold is trading near 4,593, gaining +1.83% intraday and holding close to record highs around 4,601. The overall trend remains strongly bullish across all timeframes, with price well above all major moving averages. Momentum indicators continue to support the upside, while short-term indicators show overbought conditions, hinting at possible intraday pullbacks or consolidation before the next move higher.
Key Decision Zone: 4,570 – 4,585
Above 4,585, bulls stay in control with upside targets at 4,600–4,605, followed by 4,620 and 4,650. Below 4,570, short-term profit booking may extend toward 4,550, 4,520, and 4,500. Shorts should be treated as intraday only, as the higher-timeframe trend remains bullish.
Above 4,585 → Bullish 🐂
Below 4,570 → Short-term Bearish 🐻
⚠️ Disclaimer:
This analysis is for educational purposes only. Not a buy/sell recommendation. Trade with proper risk management.

Mastering Breakouts, Patterns, Fair Value Gaps and Risk RatiosLearn how to spot breakout patterns, leverage fair value gaps, and enter trades with smart risk management for consistent swing trading success
Charts used are older than 3 months

Risk-Free and Low-Risk Trading Strategies1. Understanding Risk in Trading
1.1 What is Trading Risk?
Trading risk refers to the potential for loss due to market fluctuations, liquidity issues, or unforeseen economic and geopolitical events. Different asset classes carry different levels of risk:
Equities: Subject to company performance, market sentiment, and macroeconomic factors.
Forex: Volatile due to leverage, geopolitical events, and central bank policies.
Derivatives: High-risk instruments due to leverage and expiration dates.
Commodities: Influenced by supply-demand imbalances, weather, and global events.
Understanding risk is crucial for creating strategies that aim to minimize exposure while ensuring growth.
1.2 Types of Risk
Traders encounter several forms of risk:
Market Risk: Fluctuations in asset prices due to macroeconomic or sector-specific factors.
Credit Risk: The possibility that a counterparty defaults on financial obligations.
Liquidity Risk: Difficulty in buying or selling an asset without affecting its price.
Operational Risk: Failures in internal systems, processes, or human error.
Systemic Risk: Large-scale financial events affecting entire markets.
Low-risk strategies are designed to reduce market and systemic risk while providing predictable returns.
2. Risk-Free vs. Low-Risk Trading
2.1 Risk-Free Trading
In reality, no investment is entirely risk-free, but some instruments are considered nearly risk-free:
Government Bonds: Especially from stable economies like U.S. Treasuries.
Bank Fixed Deposits: Insured and low volatility.
Cash Equivalents: Money market funds, Treasury bills, and other short-term instruments.
These instruments provide predictable returns with minimal exposure to market fluctuations.
2.2 Low-Risk Trading
Low-risk trading involves strategies designed to protect capital while generating small, steady profits. These strategies accept minor risks in exchange for higher liquidity, flexibility, and compounding benefits.
3. Key Principles of Low-Risk Trading
Capital Preservation: The main goal is to avoid large drawdowns.
Diversification: Spreading capital across assets reduces single-asset exposure.
Risk-Reward Management: Targeting small, consistent profits while keeping losses limited.
Position Sizing: Allocating only a small percentage of capital per trade.
Leverage Caution: Avoiding excessive leverage, which amplifies both gains and losses.
Stop-Loss Orders: Automatic exit points to prevent catastrophic losses.
Consistent Evaluation: Continuous review of performance and market conditions.
4. Popular Low-Risk Trading Strategies
4.1 Hedging Strategies
Hedging involves opening positions to offset potential losses in existing investments. Common methods include:
a) Options Hedging
Protective Put: Buying a put option on a stock you own to guard against downside.
Covered Call: Selling a call option while holding the underlying stock to earn premiums.
Example:
If you own 100 shares of a stock priced at $50 and buy a put with a $48 strike, you limit your loss to $2 per share if the stock falls.
b) Futures Hedging
Locking in prices of commodities or currencies through futures contracts.
Common among farmers, exporters, and importers to stabilize cash flows.
c) Currency Hedging
Used by traders exposed to foreign currencies.
Involves forward contracts or options to mitigate exchange rate risk.
Advantages: Reduces exposure to price fluctuations.
Disadvantages: Hedging costs (premiums) may reduce profits.
4.2 Arbitrage Strategies
Arbitrage exploits price discrepancies between markets to earn nearly risk-free profits. Types include:
a) Spatial Arbitrage
Buying an asset in one market at a lower price and selling it in another at a higher price.
Example: Gold priced differently on NY and London exchanges.
b) Triangular Forex Arbitrage
Exploiting discrepancies in currency pairs.
Example: USD/EUR, EUR/GBP, and GBP/USD cross-rates not aligned.
c) Statistical Arbitrage
Using algorithms to detect short-term mispricing in stocks or derivatives.
Relies on historical price correlations.
Advantages: Minimal market risk when executed quickly.
Disadvantages: Requires sophisticated tools, low margins, and high transaction costs.
4.3 Pair Trading
Pair trading involves going long on one asset and short on a correlated asset. The goal is to profit from relative price movements rather than absolute market direction.
Example:
Long Stock A and Short Stock B in the same industry.
If Stock A outperforms Stock B, the trade earns profit regardless of overall market movement.
Advantages: Market-neutral and reduces exposure to systematic risk.
Disadvantages: Correlation breakdowns can cause losses.
4.4 Dividend Capture Strategy
This strategy focuses on buying stocks just before the ex-dividend date and selling shortly after to collect dividends. Key points:
Works best with stable, high-dividend-paying stocks.
Requires attention to ex-dividend dates and tax implications.
Market volatility may reduce gains if stock prices drop significantly post-dividend.
Advantages: Steady income with low capital risk.
Disadvantages: Transaction costs and short-term price fluctuations can erode profits.
4.5 Low-Volatility Trading
Investing in low-volatility assets reduces exposure to sudden market swings. Techniques include:
Selecting stocks with low beta (less sensitive to market movements).
Using ETFs that track defensive sectors like utilities, healthcare, or consumer staples.
Focusing on short-term risk metrics, such as ATR (Average True Range) or standard deviation.
Advantages: Smooth returns, capital preservation.
Disadvantages: Lower upside potential compared to high-volatility trading.
4.6 Fixed-Income Laddering
Laddering involves buying bonds or deposits with staggered maturities to reduce interest rate risk. Example:
Invest $10,000 across 1-year, 2-year, and 3-year bonds.
As each bond matures, reinvest at current rates.
Advantages: Reduces interest rate risk, ensures liquidity.
Disadvantages: Returns are generally lower than equities or leveraged trades.
4.7 Trend-Following with Tight Risk Controls
Trend-following can be adapted for low-risk trading by using:
Small position sizes.
Trailing stop-loss orders to lock in profits.
Limiting trades to well-established trends in low-volatility markets.
Advantages: Potential for higher returns without excessive exposure.
Disadvantages: False breakouts can trigger small losses.
4.8 Market-Neutral Strategies
Market-neutral strategies aim for profits regardless of market direction:
Long/Short Equity: Simultaneously long undervalued stocks and short overvalued ones.
Delta-Neutral Options: Balancing options and underlying stock to eliminate directional risk.
Convertible Arbitrage: Buying convertible bonds and hedging with stock positions.
Advantages: Protects capital from systemic market movements.
Disadvantages: Complex, requires active monitoring.
5. Risk Management Tools
5.1 Stop-Loss and Take-Profit Orders
Automatic exit orders limit losses and secure profits. Types:
Fixed Stop-Loss: Predetermined price level.
Trailing Stop: Adjusts dynamically as the trade moves in favor.
5.2 Position Sizing and Capital Allocation
Risk per trade should be a small percentage of total capital (commonly 1–3%). This prevents single losses from wiping out the portfolio.
5.3 Portfolio Diversification
Spread investments across:
Asset classes: equities, bonds, commodities.
Sectors: healthcare, technology, finance.
Geographies: domestic and international markets.
5.4 Volatility-Based Risk Assessment
Use ATR, standard deviation, and beta to measure potential risk.
Adjust position sizes based on market volatility.
5.5 Hedging with Derivatives
Options and futures can protect the portfolio from adverse movements, creating synthetic risk-free exposures.
6. Implementing Low-Risk Trading in Practice
Define Your Risk Tolerance: Determine how much loss you can withstand per trade and per portfolio.
Select Suitable Assets: Focus on low-volatility, high-liquidity instruments.
Choose a Strategy: Hedging, pair trading, dividend capture, or fixed-income laddering.
Set Entry and Exit Rules: Use technical indicators or calendar events.
Monitor and Adjust: Review trades regularly and adjust stop-loss or hedge positions.
Use Technology: Automated platforms, robo-advisors, and algorithmic trading can improve execution speed and reduce human error.
Review Performance: Keep a trading journal for continuous improvement.
7. Advantages of Low-Risk Trading
Capital Preservation: Minimizes the probability of catastrophic losses.
Predictable Returns: Provides steady, compounding growth.
Lower Stress Levels: Less emotional volatility than high-risk trading.
Diversification Opportunities: Can coexist with high-risk trades for balanced portfolios.
Sustainable Strategies: Works well for long-term wealth accumulation.
8. Limitations and Considerations
Lower Returns: Conservatism comes at the cost of reduced upside potential.
Time-Consuming: Hedging and monitoring multiple positions require discipline.
Hidden Costs: Transaction fees, option premiums, and slippage can reduce profits.
Market Anomalies: Even low-risk strategies are not immune to systemic crises.
Skill Requirement: Some low-risk methods, like arbitrage, require technical expertise.
9. Case Studies
9.1 Covered Call Example
Stock XYZ trades at $100.
Sell a call option with $105 strike for $2 premium.
Stock rises to $106 → exercise the call; stock sold at $105 plus $2 premium → profit locked at $7.
Stock drops to $98 → $2 premium cushions the loss.
9.2 Pair Trading Example
Long Stock A at $50, short Stock B at $60.
After a month, Stock A rises to $55, Stock B rises to $61.
Relative gain: Stock A +$5, Stock B short -$1 → net profit $4 per share.
9.3 Bond Laddering Example
$10,000 split: $3,000 in 1-year, $3,500 in 2-year, $3,500 in 3-year bonds.
Staggered maturities reduce exposure to interest rate fluctuations and maintain liquidity.
10. Conclusion
Risk-free and low-risk trading strategies focus on capital preservation, predictable returns, and market risk mitigation. While no trading method is truly risk-free, strategies like hedging, arbitrage, pair trading, dividend capture, and fixed-income laddering significantly reduce exposure. The key lies in combining:
Disciplined risk management
Diversification across assets
Strategic use of derivatives and technical tools
By carefully implementing these methods, traders can achieve consistent returns, reduce stress, and build wealth sustainably over the long term. Low-risk trading is particularly suitable for conservative investors, retirees, and professionals seeking steady growth while protecting capital from unpredictable market events.
Cryptocurrency : The New Normal & The World of Leverage Trading.📌 Cryptocurrency: The New Normal & The World of Leverage Trading ⚔️ ( A Sweet Killer! )
🌍 Why Are Traders Shifting to Crypto? COINBASE:BTCUSD BITSTAMP:ETHUSD COINBASE:SOLUSD
✔️ Lower capital required compared to stocks
✔️ Fewer gaps (24/7 market = no overnight gap-up/down shockers)
✔️ High leverage opportunities (control bigger trades with smaller margin)
✔️ Global accessibility (Binance, Bybit, OKX, CoinDCX, Mudrex etc.)
📊 Types of Trading in Crypto
💠 **Spot Trading** → In India, 30% tax on capital gains ( check according to your country ).
💠 **Options & Futures** → Taxed as *Business Income* ( like F&O in stocks ). No flat 30% rule.
⚡ What is Leverage?
👉 Leverage means using *small capital* to control a *large trade size* , because the exchange lends you money.
Think of it like **margin trading** in stocks — but much more aggressive.
🔹 Example 1 : Normal Trade style ( No Leverage )
suppose you have 💰 Capital = ₹10,000
Bought BTC at Price = ₹10,000,000
* You can buy 0.001 BTC ( 10000 ➗ 10,000,000 ).
* If BTC rises 10% → Profit = ₹1,000 (+10%)
* If BTC falls 10% → Loss = ₹1,000 (-10%)
👉 Risk & reward move in proportion to your capital.
🔹 Example 2 : Leverage Trade style ( 10x Leverage )
suppose you have 💰 Capital = ₹10,000
opted Leverage = 10x
New Trade Size ( margin ) = ₹1,00,000 ( you can now utilize this margin amount for trading )
* You can buy 0.01 BTC ( 10000 ➗ 10,000,000 ).
* If BTC rises 10% → Profit = ₹10,000 (+100% return)
* If BTC falls 10% → Loss = FULL ₹10,000 ( Liquidation 🚨 )
👉 A 10% move = your account will be blown.
🔹 Example 3:
suppose you have 💰 Capital = ₹10,000
opted Leverage = 50x (Extreme ⚠️)
New Trade Size ( margin ) = ₹5,00,000 ( you can now utilize this margin amount for trading )
* You can buy 0.05 BTC ( 50000 ➗ 10,000,000 ).
* If BTC rises just 2% → Profit = ₹10,000 (+100% return)
* If BTC falls just 2% → FULL ₹10,000 loss ( Liquidation 🚨 )
* If BTC rises just 10% → Profit = ₹50,000 (+500% return)
* If BTC falls just 10% → FULL ₹10,000 loss ( Liquidation 🚨 )
👉 Tiny moves in high volatile asset class = jackpot or wipeout/blown.
⚔️ Key Takeaways :
1️⃣ Leverage multiplies profits 💸 but also multiplies losses too💀 ( a sweet killer! )
2️⃣ Crypto is *highly volatile* (10–20% daily moves are common) → High leverage is extremely risky, if not managed well.
3️⃣ Beginners should **never use more than 2x–3x leverage**
👉 In simple words: **Leverage is a double-edged sword ⚔️**
Used wisely → You’re a king 👑
Used recklessly → You’re broke 🥀
🚘 Liquidation Explained ( ex: Car Analogy )
Imagine you pay ₹10,000 to rent a car worth ₹1,00,000. (That’s 10x leverage).
* The car is in your hands, but ₹90,000 still belongs to the owner of car (exchange).
* If the damage goes beyond your ₹10,000 margin → the owner takes back the car immediately.
👉 That’s liquidation: when your loss = your margin.
🔹 Case 1: Normal Trade style ( No Leverage )
Margin = ₹10,000 → Buy BTC.
If BTC drops 10% → Loss = ₹1,000.
You still have ₹9,000 left.
✅ No liquidation. Just a normal loss.
🔹 Case 2: 10x Leverage Trade style
Margin = ₹10,000
New Trade Size ( margin ) = ₹1,00,000
* BTC rises 10% → Profit = ₹10,000 (+100%)
* BTC falls 10% → Margin wiped = Liquidation 🚨
🔹 Case 3: 20x Leverage Trade style
Margin = ₹10,000
New Trade Size = ₹2,00,000 ( margin )
* BTC rises 5% → Profit = ₹10,000 (+100% return)
* BTC falls 5% → Margin wiped = Liquidation 🚨
👉 Just 5% against you = Account gone.
🔹 Case 4: 50x Leverage Trade style (High-Risk Zone ⚠️)
Margin = ₹10,000
New Trade Size = ₹5,00,000 ( margin )
* BTC rises 2% → Profit = ₹10,000 (+100% return)
* BTC falls 2% → FULL ₹10,000 loss = Liquidation 🚨
👉 Just 2% against you = Blown account = Game over.
🎯 Final Word
Leverage = Power ⚡
But in crypto’s volatile world, it’s also a **trap for the impatient**.
* Smart traders use small leverage.
* Impulsive traders burn out with high leverage.
💬 Question for you: What’s the **highest leverage** you’ve ever used in a trade? Drop it below 👇 (Be honest—we’ve all been tempted!)
If this Idea gave you a value information then please, Boost it, share your thoughts in comments, and follow for more practical trading!
Happy Trading & Investing!
@TradeWithKeshhav and team
Psychology, Why 90% of Traders Fail (And How to Be the 10%)⚡ The ugly truth: Most traders don’t fail because of strategy. They fail because of *themselves* . It’s NOT bad strategies, it’s bad psychology.
📉 Here’s the real story 👇:
We know about stop-losses.
We know about risk-to-reward.
We know patience matters.
Imagine this: You’ve planned your trade. Price goes against you. Suddenly, your brain whispers:
👉 “Just hold a little longer.”
👉 “Double your position, you’ll recover.”
👉 “Skip the stop-loss this time, it’ll bounce back, praying it turns back.”
NASDAQ:GOOGL
Sound familiar?
That inner voice has blown more accounts than any chart pattern ever did.
🧠 “It’s not because their strategies don’t work—it’s because *they don’t work on themselves*.
✅ The 10% who wins don’t have superhuman IQs . They *train their minds* the way athletes train their bodies.
Here’s how you can upgrade yourself today :
1️⃣ **Detach From Money** → Don’t measure success by today’s P&L.
Measure it by *following your plan*. Consistency is the real wealth.
2️⃣ **Write Your Rulebook 📘** → Define your entries, exits, and risk rules. Print it. Stick it near your screen.
No match = no trade. (Yes, it’s boring. That’s why it works.)
3️⃣ **Journal Your Trades** → Every. Single. Trade. Wins and losses. How did you feel?
Why do you enter?
after doing this, you’ll start to * see your patterns * —and they’ll expose your weaknesses too..
🎯 Success in trading isn’t about predicting/beating the market. It’s about controlling *yourself*, beating your own impulses.
💬 Question for you: Which habit is killing your trades?
NASDAQ:MSFT
If you could fix just ONE habit right now:— what would it be?
Which one would change your results the most?
1️⃣ Overtrading 🔂
2️⃣ Revenge Trading ⚔
3️⃣ Ignoring Risk ⚠
4️⃣ chasing losses 🏃➡️
5️⃣ No 📘rulebook/📰Journal
💬 Comment below ⬇️
I'll post my new content accordingly.
Happy Trading and Investing!
Regards:
@TradeWithKeshhav
Things Traders Should Avoid1. Ignoring Risk Management
One of the biggest mistakes traders make is trading without a clear risk management plan. Risk management is the backbone of trading. Without it, even the best strategies will eventually fail.
Key Errors to Avoid:
Over-leveraging: Using high leverage magnifies both profits and losses. Many traders blow up accounts by taking oversized positions.
Not using stop-loss orders: Some traders believe they can manually exit trades at the right time. In reality, markets move too fast, and emotions cloud judgment.
Risking too much on one trade: A common guideline is not to risk more than 1–2% of trading capital per trade. Ignoring this rule can wipe out months of profits in a single mistake.
No position sizing strategy: Jumping into trades with random lot sizes leads to inconsistent results.
👉 Example: Imagine a trader with $10,000 capital risks $5,000 on one trade because they feel “confident.” If the trade goes wrong, half the account is gone. Recovering from such a loss requires a 100% gain, which is extremely difficult.
2. Overtrading
Overtrading happens when traders place too many trades, often driven by greed, boredom, or revenge trading.
Mistakes Within Overtrading:
Chasing the market: Entering trades without proper signals because of fear of missing out (FOMO).
Revenge trading: After a loss, trying to “get back” money quickly by doubling positions.
Trading without rest: Markets will always offer opportunities. Overexposure reduces focus and increases mistakes.
👉 Example: A trader loses $200 on a bad trade. Instead of stopping to analyze the mistake, they place another trade with double the position size, hoping to win back losses. Often, this leads to an even bigger loss.
3. Lack of Trading Plan
Trading without a structured plan is like sailing without a compass. A trading plan defines when to enter, when to exit, how much to risk, and which strategies to follow.
Common Errors:
Random decision-making: Buying or selling based on gut feeling.
No journal keeping: Traders who don’t document their trades cannot identify patterns in their mistakes.
Constantly changing strategies: Jumping from one method to another without giving it time to work.
👉 Example: A trader buys a stock because they “heard on TV it’s going up.” Without entry rules, stop-loss, or profit target, the trade is based purely on luck.
4. Letting Emotions Control Decisions
Trading psychology is often more important than technical skills. Emotional trading leads to poor decisions.
Emotional Traps:
Fear: Prevents traders from taking good trades or causes them to exit too early.
Greed: Leads to holding onto winning positions for too long until profits disappear.
FOMO: Entering trades late because others are profiting.
Ego & overconfidence: Refusing to admit mistakes, holding onto losing trades in the hope they recover.
👉 Example: A trader buys a stock at ₹500, it rises to ₹550, but instead of booking profit, greed makes them wait for ₹600. The stock falls back to ₹480, turning profit into loss.
5. Trading Without Education
Many beginners jump into trading with little knowledge, believing they can “figure it out as they go.” This often ends in losses.
What Traders Avoid Learning:
Market fundamentals: Basic concepts like how interest rates, inflation, or company earnings affect prices.
Technical analysis: Chart patterns, indicators, and price action signals.
Risk-reward ratio: Understanding whether a trade is worth the potential risk.
Brokerage & fees: Ignoring transaction costs that eat into profits.
👉 Example: A new trader hears about “options trading” and buys random call options without knowing how time decay works. Even though the stock moves slightly in their favor, the option premium decays, and they lose money.
6. Relying Too Much on Tips & News
Traders who depend solely on TV channels, social media influencers, or WhatsApp tips rarely succeed.
Mistakes:
Acting on rumors: Many news stories are exaggerated or already priced in.
Not verifying sources: Following random advice without checking fundamentals or technicals.
Late entry: By the time news is public, smart money has already acted.
👉 Example: A trader buys a stock after hearing “strong quarterly results” on TV. But by then, the stock is already up 10%. The trader enters late and suffers when the price corrects.
7. Ignoring Market Trends
Fighting the trend is one of the costliest mistakes. Many traders try to “pick tops and bottoms” instead of riding the trend.
Errors:
Catching falling knives: Buying a stock just because it “has fallen too much.”
Selling too early in a bull run: Going short against strong upward momentum.
Not respecting price action: Ignoring charts that clearly show the trend direction.
👉 Example: During a bull market, a trader repeatedly short-sells thinking “this rally can’t last.” Each time, they lose money as the market keeps moving higher.
8. Poor Time Management
Successful trading requires patience and timing. Rushing into trades or neglecting the right timeframes leads to losses.
Errors:
Day trading without time: Traders with full-time jobs trying to scalp during lunch breaks.
Ignoring timeframes: Using a 1-minute chart for long-term investments or a daily chart for intraday scalps.
Not waiting for setups: Jumping in before confirmation.
👉 Example: A trader sees a stock forming a breakout pattern but enters early. The stock pulls back before breaking out, hitting their stop-loss.
9. Overcomplicating Strategies
Many traders load their charts with 10+ indicators, hoping for a perfect signal. In reality, complexity leads to confusion.
Mistakes:
Indicator overload: RSI, MACD, Bollinger Bands, Stochastic, all at once.
No price action focus: Forgetting that price itself is the ultimate indicator.
Constant tweaking: Changing settings after every losing trade.
👉 Example: A trader waits for five indicators to align before trading. By the time the signals confirm, the price has already moved.
10. Lifestyle & Psychological Habits to Avoid
Trading is not just about charts and strategies—it’s also about mindset and lifestyle.
Mistakes:
Lack of sleep: Fatigue reduces focus and increases impulsive decisions.
Trading under stress: Personal problems or financial pressure cloud judgment.
Unrealistic expectations: Believing trading will double money every month.
Neglecting health: Sitting for hours without breaks affects mental sharpness.
👉 Example: A trader under debt pressure tries to make “quick money” by doubling account size. Stress pushes them into risky trades, worsening the situation.
11. Not Adapting to Market Conditions
Markets are dynamic. A strategy that works in a trending market may fail in a range-bound market.
Errors:
Rigid strategies: Refusing to adapt when volatility changes.
Ignoring global events: Economic data, elections, or geopolitical tensions affect all markets.
No backtesting: Not testing strategies across different conditions.
👉 Example: A trader uses breakout strategies during low volatility. Instead of clean moves, the market fakes out, hitting stop-loss repeatedly.
12. Treating Trading Like Gambling
Trading is about probabilities, not luck. When traders treat it like a casino, losses are inevitable.
Mistakes:
All-in bets: Putting entire capital on one trade.
No analysis: Buying or selling randomly.
Relying on luck: Believing one “big trade” will make them rich.
👉 Example: A trader bets entire account on a penny stock hoping it will double. Instead, the stock crashes, wiping them out.
Conclusion
Trading can be rewarding, but only for those who avoid the common traps. The key things traders should avoid include:
Ignoring risk management
Overtrading
Trading without a plan
Emotional decision-making
Relying on tips and news
Fighting the trend
Poor time management
Overcomplicating strategies
Unrealistic expectations
The markets will always be uncertain. A trader’s job is not to predict perfectly but to manage risk, follow discipline, and protect capital. By avoiding the mistakes outlined above, traders can significantly improve their chances of long-term success.
Hammer Candlestick Reversals - Bullish & Bearish Setups🔹 Intro / Overview
In this idea, we focus on the Hammer candlestick pattern — both Bullish and Bearish variations.
The Hammer is a powerful reversal signal formed with a small body, a long shadow, and defined highs/lows.
When combined with EMA High–Low Band Confirmation and swing structure, it creates rule-based trading opportunities with clear validation and devalidation rules.
---
📖 Bullish & Bearish Hammer Intro
🟢 Bullish Hammer → Appears after a downtrend / at swing low . Buyers step in strongly, rejecting lower prices.
- EMA Band should be above the candle.
- Candle High = Validation line.
- Candle Low = Devalidation line.
- Entry → Close above the High.
- Stop-Loss → Candle Low.
- Target → 1x risk, with remaining lots trailed (ATR, Fibonacci, Box Trailing).
🔴 Bearish Hammer → Appears after a uptrend / at swing high . Sellers take control after rejecting higher prices.
- EMA Band should be below the candle.
- Candle Low = Validation line.
- Candle High = Devalidation line.
- Entry → Close below the Low.
- Stop-Loss → Candle High.
- Target → 1x risk, with remaining lots trailed.
---
📌 How to Use
🟢 Bullish Hammer Spotted
- Validation → Close above the Hammer’s high.
- Devalidation → Close below the Hammer’s low. (before validation)
- SL → Hammer Low.
- Target → 1x risk, remaining lots trail with ATR/Fibonacci.
🔴 Bearish Hammer Spotted
- Validation → Close below the Hammer’s low.
- Devalidation → Close above the Hammer’s high. (before validation)
- SL → Hammer High.
- Target → 1x risk, remaining lots trail with ATR/Fibonacci.
---
🎯 Trading Plan
- Entry → On validation close (Bullish above High, Bearish below Low).
- Stop Loss → Defined by Hammer candle (Low for Bullish, High for Bearish).
- Target → First TP = 1R, Remaining lots trailed for extended moves.
---
📊 Chart Explanation
1️⃣ 🟢 Bullish Hammer Spotted
- Candle validated as price closed above the high.
- 🎯 Target 1 achieved, remaining lots managed with trailing methods. Trailing Exit could be at swing top with best trailing
2️⃣ 🛑 Bearish Hammer →
- Candle validated as price closed below the low.
- 🎯 Target 1 achieved, remaining lots managed with trailing methods. Trailing Exit could be at swing bottom with best trailing
3️⃣ 🛑 Bearish Hammer →
- ❌ Devalidated
- Candle devalidated as price closed above the high.
4️⃣ 🛑 Bearish Hammer →
-Candle validated as price closed below the low.
⛔ Stop-Loss hit
- stop loss ensures risk management and discipline in trading.
5️⃣ 🛑Bearish Hammer →
-Candle validated as price closed above the low.
- 🎯 Target 1 achieved, remaining lots managed with trailing methods. Trailing Exit could be at swing bottom with best trailing
---
👀 Observation
- Bullish Hammer → Works best after prolonged downtrend at support zones.
- Bearish Hammer → Stronger after extended uptrends or near resistance zones.
- EMA Band → Confirms market bias and filters false signals.
- Risk Management → Defined SL + structured TP protect capital and maximize reward.
---
❗ Why It Matters?
- Clear rules: Validation, Devalidation, Entry, SL, and TP.
- Combines price action (Hammer) with EMA Band confirmation.
- Ensures disciplined trading instead of emotional decisions.
- Allows both conservative and aggressive management via trailing.
---
🎯 Conclusion
The Bullish & Bearish Hammer patterns, when combined with EMA High–Low Band confirmation, provide a structured reversal trading strategy.
By following strict entry, SL, and TP rules, traders can filter false setups and capture strong reversals at swing highs and lows.
🔥 Patterns don’t predict. Rules protect. 🚀
---
⚠️ Disclaimer
For educational purposes only · Not SEBI registered · Not a buy/sell recommendation · Not financial advice — purely a learning resource.

Bearish Hammer with EMA High-Low Band - Rule Based Entry 🔹 Intro / Overview
The Bearish Hammer candlestick is a signal of potential downside reversal.
It forms when buyers push price higher, but sellers regain control and close the candle near its low.
When combined with EMA High–Low Band confirmation, it creates a disciplined setup to identify short trade opportunities with clear rules.
---
📖 How to Use
✅ Validation → A valid signal occurs when the close price is below the low of the Bearish Hammer.
❌ Invalidation → If the close price crosses above the high of the Bearish Hammer, the signal is invalid. (Before validation )
EMA Band Confirmation:
- The Bearish Hammer must be above the EMA High–Low Band.
- The EMA High-Low band should not touch the Bearish Hammer.
- This ensures the setup aligns with bearish conditions.
✅ Bearish Hammar High must be swing high
---
🎯 Trading Plan
Entry → Enter short when the close price is below the Hammer’s low (validation line).
Stop-Loss (SL) → The high of the Bearish Hammer candle(Swing High)
Target (TP):
- First Target → 1R (equal to the risk defined by Entry–SL distance).
- Remaining Lots → Trail using ATR, Fibonacci levels, Box Trailing, or structure-based stops.
---
📊 Chart Explanation
- The Bearish Hammer shows rejection of higher prices, with a small body near the low and a long upper shadow.
- The EMA High–Low Band sits below the candle, and the Hammer forms above the band (no touch), confirming the setup.
- Validation occurs when the next close is below the Hammer’s low.
- Invalidation occurs if price closes above the Hammer’s high(before Validation)
---
👀 Observation
Bearish Hammer Behavior → Most effective after an uptrend or at resistance zones.
EMA Role → Ensures trade alignment with broader market bias.
Risk Management → SL above Hammer high, TP at least 1:1, with trailing options for extended downside moves.
---
❗ Why It Matters?
- Shows buyers losing strength.
- Sellers step back in and dominate.
- EMA Band ensures cleaner filtering of weak signals.
- Provides a strict framework for entry, SL, and targets.
---
🎯 Conclusion
The Bearish Hammer, combined with EMA High–Low Band confirmation, creates a structured short setup.
Using strict validation, devalidation, and risk management, traders can filter false signals and ride potential bearish moves with confidence.
🔥 Patterns don’t predict. Rules protect.
---
⚠️ Disclaimer
For educational purposes only · Not SEBI registered · Not a buy/sell recommendation · Not financial advice — purely a learning resource.

Effective inefficiencyStop-Loss. This combination of words sounds like a magic spell for impatient investors. It's really challenging to watch your account get smaller and smaller. That's why people came up with this magic amulet. Go to the market, don't be afraid, just put it on. Let your profits run, but limit your losses - place a Stop-Loss order.
Its design is simple: when the paper loss reaches the amount agreed upon with you in advance, your position will be closed. The paper loss will become real. And here I have a question: “ Does this invention stop the loss? ” It seems that on the contrary - you take it with you. Then it is not a Stop-Loss, but a Take-Loss. This will be more honest, but let's continue with the classic name.
Another thing that always bothered me was that everyone has their own Stop-Loss. For example, if a company shows a loss, I can find out about it from the reports. Its meaning is the same for everyone and does not depend on those who look at it. With Stop-Loss, it's different. As many people as there are Stop-Losses. There is a lot of subjectivity in it.
For adherents of fundamental analysis, all this looks very strange. I cannot agree that I spent time researching a company, became convinced of the strength of its business, and then simply quoted a price at which I would lock in my loss. I don't think Benjamin Graham would approve either. He knew better than anyone that the market loved to show off its madness when it came to stock prices. So Stop-Loss is part of this madness?
Not quite so. There are many strategies that do not rely on fundamental analysis. They live by their own principles, where Stop-Loss plays a key role. Based on its size relative to the expected profit, these strategies can be divided into three types.
Stop-Loss is approximately equal to the expected profit size
This includes high-frequency strategies of traders who make numerous trades during the day. These can be manual or automated operations. Here we are talking about the advantages that a trader seeks to gain, thanks to modern technical means, complex calculations or simply intuition. In such strategies, it is critical to have favorable commission conditions so as not to give up all the profits to maintaining the infrastructure. The size of profit and loss per trade is approximately equal and insignificant in relation to the size of the account. The main expectation of a trader is to make more positive trades than negative ones.
Stop-Loss is several times less than the expected profit
The second type includes strategies based on technical analysis. The number of transactions here is significantly less than in the strategies of the first type. The idea is to open an interesting position that will show enough profit to cover several losses. This could be trading using chart patterns, wave analysis, candlestick analysis. You can also add buyers of classic options here.
Stop-Loss is an order of magnitude greater than the expected profit
The third type includes arbitrage strategies, selling volatility. The idea behind such strategies is to generate a constant, close to fixed, income due to statistically stable patterns or extreme price differences. But there is also a downside to the coin - a significant Stop-Loss size. If the system breaks down, the resulting loss can cover all the earned profit at once. It's like a deposit in a dodgy bank - the interest rate is great, but there's also a risk of bankruptcy.
Reflecting on these three groups, I formulated the following postulate: “ In an efficient market, the most efficient strategies will show a zero financial result with a pre-determined profit to loss ratio ”.
Let's take this postulate apart piece by piece. What does efficient market mean? It is a stock market where most participants instantly receive information about the assets in question and immediately decide to place, cancel or modify their order. In other words, in such a market, there is no lag between the appearance of information and the reaction to it. It should be said that thanks to the development of telecommunications and information technologies, modern stock markets have significantly improved their efficiency and continue to do so.
What is an effective strategy ? This is a strategy that does not bring losses.
Profit to loss ratio is the result of profitable trades divided by the result of losing trades in the chosen strategy, considering commissions.
So, according to the postulate, one can know in advance what this ratio will be for the most effective strategy in an effective market. In this case, the financial result for any such strategy will be zero.
The formula for calculating the profit to loss ratio according to the postulate:
Profit : Loss ratio = %L / (100% - %L)
Where %L is the percentage of losing trades in the strategy.
Below is a graph of the different ratios of the most efficient strategy in an efficient market.
For example, if your strategy has 60% losing trades, then with a profit to loss ratio of 1.5:1, your financial result will be zero. In this example, to start making money, you need to either reduce the percentage of losing trades (<60%) with a ratio of 1.5:1, or increase the ratio (>1.5), while maintaining the percentage of losing trades (60%). With such improvements, your point will be below the orange line - this is the inefficient market space. In this zone, it is not about your strategy becoming more efficient, you have simply found inefficiencies in the market itself.
Any point above the efficient market line is an inefficient strategy . It is the opposite of an effective strategy, meaning it results in an overall loss. Moreover, an inefficient strategy in an efficient market makes the market itself inefficient , which creates profitable opportunities for efficient strategies in an inefficient market. It sounds complicated, but these words contain an important meaning - if someone loses, then someone will definitely find.
Thus, there is an efficient market line, a zone of efficient strategies in an inefficient market, and a zone of inefficient strategies. In reality, if we mark a point on this chart at a certain time interval, we will get rather a cloud of points, which can be located anywhere and, for example, cross the efficient market line and both zones at the same time. This is due to the constant changes that occur in the market. It is an entity that evolves together with all participants. What was effective suddenly becomes ineffective and vice versa.
For this reason, I formulated another postulate: “ Any market participant strives for the effectiveness of his strategy, and the market strives for its own effectiveness, and when this is achieved, the financial result of the strategy will become zero ”.
In other words, the efficient market line has a strong gravity that, like a magnet, attracts everything that is above and below it. However, I doubt that absolute efficiency will be achieved in the near future. This requires that all market participants have equally fast access to information and respond to it effectively. Moreover, many traders and investors, including myself, have a strong interest in the market being inefficient. Just like we want gravity to be strong enough that we don't fly off into space from our couches, but gentle enough that we can visit the refrigerator. This limits or delays the transfer of information to each other.
Returning to the topic of Stop-Loss, one should pay attention to another pattern that follows from the postulates of market efficiency. Below, on the graph (red line), you can see how much the loss to profit ratio changes depending on the percentage of losing trades in the strategy.
For me, the values located on the red line are the mathematical expectation associated with the size of the loss in an effective strategy in an effective market. In other words, those who have a small percentage of losing trades in their strategy should be on guard. The potential loss in such strategies can be several times higher than the accumulated profit. In the case of strategies with a high percentage of losing trades, most of the risk has already been realized, so the potential loss relative to the profit is small.
As for my attitude towards Stop-Loss, I do not use it in my stock market investing strategy. That is, I don’t know in advance at what price I will close the position. This is because I treat buying shares as participating in a business. I cannot accept that when crazy Mr. Market knocks on my door and offers a strange price, I will immediately sell him my shares. Rather, I would ask myself, “ How efficient is the market right now and should I buy more shares at this price? ” My decision to sell should be motivated not only by the price but also by the fundamental reasons for the decline.
For me, the main criterion for closing a position is the company's profitability - a metric that is the same for everyone who looks at it. If a business stops being profitable, that's a red flag. In this case, the time the company has been in a loss-making state and the size of the losses are considered. Even a great company can have a bad quarter for one reason or another.
In my opinion, the main work with risks should take place before the company gets into the portfolio, and not after the position is opened. Often it doesn't even involve fundamental business analysis. Here are four things I'm talking about:
- Diversification. Distribution of investments among many companies.
- Gradually gaining position. Buying stocks within a range of prices, rather than at one desired price.
- Prioritization of sectors. For me, sectors of stable consumer demand always have a higher priority than others.
- No leverage.
I propose to examine the last point separately. The thing is that the broker who lends you money is absolutely right to be afraid that you won’t pay it back. For this reason, each time he calculates how much his loan is secured by your money and the current value of the shares (that is, the value that is currently on the market). Once this collateral is not enough, you will receive a so-called margin call . This is a requirement to fund an account to secure a loan. If you fail to do this, part of your position will be forcibly closed. Unfortunately, no one will listen to the excuse that this company is making a profit and the market is insane. The broker will simply give you a Stop-Loss. Therefore, leverage, by its definition, cannot be used in my investment strategy.
In conclusion of this article, I would like to say that the market, as a social phenomenon, contains a great paradox. On the one hand, we have a natural desire for it to be ineffective, on the other hand, we are all working on its effectiveness. It turns out that the income we take from the market is payment for this work. At the same time, our loss can be represented as the salary that we personally pay to other market participants for their efficiency. I don't know about you, but this understanding seems beautiful to me.

Time-Tested Tips for Better Risk Management in Trading
📝 Develop a Trading Plan
• Start with a Plan: Avoid jumping into trades without preparation. A solid trading plan is
your blueprint for success.
• Key Components: Define your entry points, stop-loss levels (to limit losses), and target
profit levels in advance.
• Why It Matters: A structured plan provides clarity during stressful trading situations and
ensures consistency with your risk tolerance.
________________________________________
🧘♂️ Understand Your Risk Tolerance
• Self-Reflection: Assess your emotional and psychological response to risk.
Know your comfort level with losses, market fluctuations, and stress.
• Financial Awareness: Factor in your income, savings, debts, and expenses to
gauge how much risk you can afford.
• Personalization is Key: There’s no one-size-fits-all strategy.
Tailor your risk management approach to your account size, goals,
and unique circumstances.
________________________________________
📚 Follow Your Trading System
• Have a Clear System: Establish rules for entering and exiting trades to maintain discipline
and avoid impulsive decisions.
• Backtest and Research: Test your system against historical data and simulate performance
in different market conditions.
• Stick to It: If your system has a proven edge, trust it. Jumping between strategies after
losses often leads to bigger losses.
________________________________________
🚨 Use a Stop-Loss
• What is a Stop-Loss? A predefined price level where you exit a trade to
limit potential losses.
• Why It’s Important: Prevents emotional decision-making and ensures you
quantify your risk before entering a trade.
________________________________________
✂️ Manage Your Position Size
• Avoid Overexposure: Adjust your position size to manage risk effectively and
avoid putting too much capital into one trade.
• Diversify: Don’t put all your eggs in one basket unless you fully understand and
accept the risks.
Risk-Reward Ratios: Quick Reference
1:2 Risk-Reward
• Risking $1 to make $2
• Win 33% of the time to break even.
• Common for day and swing traders aiming for moderate profits.
• Example: Stop-loss at 10 pips, target profit at 20 pips.
________________________________________
1:3 Risk-Reward
• Risking $1 to make $3
• Win 25% of the time to break even.
• Ideal for trades with a high-probability setup and larger moves.
• Example: Stop-loss at $50, target profit at $150.
________________________________________
1:5 Risk-Reward
• Risking $1 to make $5
• Win 17% of the time to break even.
• Suitable for trend-following strategies or breakout trades with significant momentum.
• Example: Stop-loss at 5% of capital, target profit at 25%.
________________________________________
❌ Don’t Overtrade or Revenge Trade
• Control Impulses: Avoid the urge to overtrade or recover losses through high-risk trades.
• Stay Rational: Emotional trading can lead to poor decisions and bigger losses.
Trade with a clear head and logic.
________________________________________
📔 Maintain a Trading Journal
• Track Your Trades: Document your trades to identify patterns, mistakes, and
areas for improvement.
• Enhance Strategies: Regular reviews help refine your approach,
improve risk management, and evolve as a trader.
• Accountability: A journal instils discipline and serves as a learning tool for future trades.
________________________________________
✅ Final Reminders
• Trade with discipline, not emotions.
• Always align your strategies with your risk tolerance and financial situation.
• Remember, trading is a marathon, not a sprint—stay consistent and patient.
________________________________________
Note- The Magic Formula for Lot Size Calculation (1% Risk)
Formula = 1% of Capital/Stop Loss in Pips/10
Example Scenarios:
Capital = $5,000 | Stop Loss = 30 pips: in XAUUSD
1% of capital = 50$
Lot size = 1% of Capital/Stop Loss in Pips/10 = 50/30/10 = 0.16
🚀 Thanks for reading!
Drop your thoughts or additional tips in the comments below. Let’s grow and trade smarter together! Cheers! 🌟

3 Potential swing trading ideas for 9 jan I make educational content videos for swing / positional trading

Adapting to SEBI's New Rules: Contd.In our previous article, we examined the recent SEBI circular and its ramifications for retail traders and investors. Now, let's dive into the upcoming changes in contract sizes and how they will reshape margin requirements for various trading strategies
Currently, the contract size for index F&O contracts sits between ₹5 lakhs and ₹10 lakhs. Starting November 20, 2024, this will escalate to between ₹15 lakhs and ₹20 lakhs. This substantial increase will inevitably raise margin requirements, compelling traders to reassess their strategies.
Currently, the contract size for index F&O contracts sits between ₹5 lakhs and ₹10 lakhs. Starting November 20, 2024, this will escalate to between ₹15 lakhs and ₹20 lakhs. This substantial increase will inevitably raise margin requirements, compelling traders to reassess their strategies.
This change will increase the index F&O lot sizes and in turn will also the margin requirements.
The current table is a reference taken from an article published by Zerodha. They have mentioned the approximate lot size increase for the various indices traded on NSE and BSE respectively. Please keep in mind that these lot sizes are not final and are assumptions as both the exchanges are about to finalize on this.
1drv.ms
Let us see how this will impact some of the options trading strategies that some or majority of the options traders deploy in their portfolio.
1drv.ms
As one can observe from the above table that naked options and strategies will attract the maximum capital going forward with this impact. Since the margin requirement has increased nearly 2.5x it is advisable for the new entrants into the market to focus more on risk defined strategies such as Bull Call, Bear Put, Bull Put and Bear Call Spread. These strategies have the lowest margins as per the table. However, those with a capital of greater than Rs 2 lakhs can opt to trade non-directional strategies such as Iron Condors and Iron Fly that are also risk defined. For large capital retail traders and investors, it may be advisable to reduce the overall position size to 1/3rd and not overexpose oneself to a larger risk.
While SEBI has yet to reveal any changes regarding stock options, it's wise to stay vigilant and prepared for upcoming adjustments.
By understanding and adapting to these new regulations, retail traders can navigate the evolving landscape with greater confidence and strategic foresight. Embrace these changes as an opportunity to refine your trading approach and enhance your resilience in the market.
Conclusion
In summary, the forthcoming changes in SEBI's regulations herald a significant shift in the landscape for retail options traders. With increased contract sizes and margin requirements, it’s imperative for traders to adopt more strategic approaches and focus on risk-defined strategies. By being proactive and adaptable, you can better position yourself for success in this evolving market environment. Embrace these changes as a chance to refine your trading techniques and enhance your overall investment strategy.
Disclaimer
Investments in the financial markets are subject to market risks. Past performance is not indicative of future results. It is crucial to consult your financial advisor before making any investment decisions to ensure that your strategy aligns with your individual risk tolerance and financial goals.

Angel One Ltd - Breaking Barriers, Eyeing the Next MoveWe’ve got a breakout on our hands with Angel One Ltd! The yellow line in the chart is a counter-trendline that’s been rejecting price action multiple times. But now, we’re seeing some serious strength as the stock has blasted through it with authority. This signals a potential shift in momentum.
Supporting this move is the green trendline, showing that the stock is not just breaking out—it’s bouncing off a solid foundation of support. The market clearly respects this level, adding confidence to the bullish outlook.
But here’s where it gets interesting—I've added two white dotted lines, my "hidden hurdles." These are potential areas of resistance that might slow the stock down for a bit. Don't be surprised if we see some consolidation around this zone.
Now, check out the red box, which hints at a possible short-term pullback or sideways movement—just a breather before the next leg up! After this, I'm eyeing a strong bullish candle (marked by the green box) to close above resistance, setting the stage for an exciting trade opportunity.
The final piece of the puzzle? I’ll be planning my risk-reward strategy only after that confirmation candle is locked in. For now, I’m keeping this one on my radar—this stock could be setting up for something big!

Understanding Risk-ManagementThe stock is trading at lower prices if you see last month's movements. In the last few days, it formed a double bottom
and again came down to lower levels. If reverses from these levels, a bull run may come.
The risk-reward ratio is good at this point.
1. If we enter at 940 while considering the stop-loss at 860 - the loss will be 60 points.
2. If prices go in our desired direction, the final target comes at 1500 - the profit will be 560 points.
So we have to keep our position size in a way that if we have to exit at a loss, that should be manageable for us.
This means we should be ready for that loss. Else while going in profits, we may exit at the first target of 1140.
Let's calculate the quantity of 25.
If we have to exit at a stop-loss of 860 - the loss will be 2000.
If the price reaches the first target of 1140 - the profit will be 5000
if the price reaches the final target of 1500 - the profit will be 14000
We should always keep our position size in accordance with our risk capacity.
Risk management is a general concept in every aspect of our life and normally we follow this other than the stock market.
Only for learning and sharing purposes, not a bit of trading advice in any form. Please do your own analysis before taking any trade or consult your financial advisor.
All the best.

🚀 Swing Trading Idea: Buy Position in GalaxySurf 🚀Analysis: GalaxySurf shows strong uptrend potential with solid fundamentals and technical indicators.
Entry: Consider current price
Disclaimer: For informational purposes only. Do your research or consult a financial advisor.

Getting Started with Technical AnalysisInvesting in the stock market can be both exciting and overwhelming. There are so many stocks and strategies are there that make it hard to decide where to invest. That’s where technical analysis comes in. It’s the study of market data to find patterns, trends, and potential opportunities.
To get started with technical analysis, you need to first understand what exactly technical analysis is.
Technical Analysis:
Technical analysis may sound complex, but it’s actually quite easy. In simple terms, it’s a method of assessing stock or any tradeable asset by studying statistics based on market activity, like past prices and volume.
Technical analysts believe that by analysing charts and other indicators, they can identify and predict market trends for any security. Essentially, they study a stock’s trading history to measure its potential for future price changes.
Let’s understand this with an example:
Let’s make a comparison to weather forecasting.
Can we predict the weather for the future? Yes.
Is the weather forecast always 100% accurate? No.
Weather forecasts are applicable over a period of time rather than being precise second by second.
Similarly, just like meteorologists use past weather data and atmospheric patterns to forecast future weather conditions, technical analysts utilize past price and volume data to predict future stock prices.
How You Can Start Technical Analysis of Stocks?
To begin with technical analysis, the first step is selecting a security for analysis. This can include stocks, commodities, currency pairs, or any other tradable financial instrument available on an exchange. Once you have decided on the security, the next step involves studying its price and volume data.
A widely used tool in technical analysis is the price chart. It provides a visual display of a security’s price changes over time. Price charts come in various types, with the candlestick chart being the most popular and commonly used option.
Candlestick charts offer wide information in a single platform. Each candlestick represents a specific time period, like a day or an hour. The body of the candlestick indicates the security’s opening and closing prices within that timeframe, while the wicks or shadows represent the highest and lowest prices recorded during that period.
By studying these candlesticks, traders can identify patterns and trends in the price movements of the stock.
Along with price charts, traders use various technical indicators to analyse securities. These indicators are mathematical calculations derived from the price and volume data of a security. They give signals that confirm trends, identify potential buy or sell signals , and provide additional information to traders.
Some popular and commonly used technical indicators are moving averages , relative strength index (RSI) , and Bollinger Bands , among others. These indicators help traders to judge market conditions, identify potential price reversals or trends, and help to take trading decisions.
Dos and Don’ts to follow when starting Technical Analysis:
Do’s:
A Volume is an important tool for technical analysis. High trading volume suggests a strong trend, while low volume can indicate a lack of buyers and sellers in security.
Traders mostly confirm trends and signals by using multiple indicators. With one or more than one indicators, a trader can become more confident in a potential trade. This approach allows for a thorough analysis of different aspects of the market, increasing the chances of making informed trading decisions.
One of the most important tips to remember is that while technical analysis can assist in identifying potential trades, practising effective risk management is essential.
Risk Management involves implementing stop-loss orders and ensuring that you don’t risk more than a certain percentage of your portfolio on any single trade. With the help of these risk management techniques, you can protect your investments and maintain a disciplined approach to trading.
As the price of stocks is changing every time, you need to stay updated with news and investments that can impact your investment.
Don’ts:
While technical analysis can look complex, it’s important to avoid difficult things. Stick to the fundamental principles and strategies, and you should be on the right track. Sometimes, simplicity is the key to effective analysis and decision-making in the stock market.
While technical analysis is important, it shouldn’t be the only way to evaluate securities. It’s also important to consider fundamental analysis , which involves looking at a company’s financial statements and economic factors. By using both technical and fundamental analysis, investors can get a better overall understanding of the securities they are analysing.
Trading can involve emotional decisions, but it’s important to let no emotions cloud your judgment. Stick to your trading strategy and avoid making impulsive trades driven by fear or greed. By maintaining discipline and adhering to your predetermined plan, you can make more rational and informed trading decisions.
When you’re taking potential trades, it’s important to think about the risk-reward ratio . This means comparing the potential profit with the potential loss.
With a good risk-to-reward ratio, you can make smarter decisions and aim for a good balance between R:R in your trading strategy.
Conclusion:
Technical analysis is a great tool for traders and aspiring investors in the Indian stock market. It helps identify potential opportunities by analysing price and volume data, allowing traders to recognize patterns and trends. However, it’s important to follow certain guidelines when using this approach. With the help of candlestick patterns , indicators, risk management tools, and fundamental analysis traders can achieve their financial goals.

Mastering Risk-to-Reward Ratio: A Crucial Element in TradingTrading in financial markets involves risks, and managing them effectively is essential for success. One crucial aspect of trading is mastering the risk-to-reward ratio. By understanding this concept, traders can enhance their profitability, minimize losses, and achieve consistency in their trading results. In this article, we will explore the significance of the risk-to-reward ratio, strategies to achieve it, factors to consider, case studies, common mistakes to avoid, and tips for developing a risk management plan.
📊 Understanding Risk-to-Reward Ratio 📊
Definition and Calculation:
The risk-to-reward ratio is the ratio of the potential loss to the potential profit in a trade. It is calculated by dividing the distance between the entry price and stop-loss level by the distance between the entry price and take-profit level. For example, a risk-to-reward ratio of 1:3 means risking $100 to potentially make $300.
📊 Importance of Risk Management 📊
Risk management is crucial in trading, and the risk-to-reward ratio is a vital component of a trader's risk management strategy. By defining this ratio before entering a trade, traders can evaluate the viability of the trade and align it with their overall trading strategy.
📊 Benefits of Mastering Risk-to-Reward Ratio 📊
1. Maximizing Profit Potential
By selecting trades with higher potential rewards relative to the risk taken, traders can maximize their profit potential. This approach allows for consistent profitability even if some trades result in losses.
2. Minimizing Losses
A favourable risk-to-reward ratio helps traders limit potential losses by setting appropriate stop-loss levels and adhering to them. This disciplined approach protects trading capital and enables traders to withstand market volatility.
3. Enhancing Consistency
Mastering the risk-to-reward ratio plays a vital role in achieving consistent trading results. By sticking to trades with a favourable ratio, traders can reduce the impact of emotional decision-making and foster consistency.
📊 Strategies for Achieving a Favourable Risk-to-Reward Ratio 📊
1. Setting Realistic Targets
Identify potential price levels where the risk-to-reward ratio is favourable and focus on trades with higher probability of success. Ensure that the potential reward justifies the risk taken.
2. Proper Position Sizing
Determine the appropriate position size based on risk tolerance and the risk-to-reward ratio of the trade. Allocating a reasonable portion of trading capital to each trade helps manage risk exposure.
3. Implementing Stop-Loss Orders
Place stop-loss orders at predetermined levels to limit potential losses if the trade moves against expectations. Adhering to the predetermined stop-loss level minimizes emotional decision-making.
4. Utilizing Trailing Stops
Trailing stops allow traders to protect profits while still allowing for potential upside. Adjust the stop-loss level as the trade moves in your favour to capture larger gains while protecting against reversals.
📊 Factors to Consider in Risk-to-Reward Ratio 📊
1. Market Volatility
Consider current market volatility levels and adjust risk-to-reward expectations accordingly. Higher volatility may require wider profit targets and adjusted stop-loss levels.
2. Timeframes and Trading Styles
Different timeframes and trading styles impact the risk-to-reward ratio. Day traders may target smaller profit targets relative to their stop-loss levels, while swing traders may have larger profit targets and wider stop-loss levels.
📊 Case Studies on Risk-to-Reward Ratio 📊
Example 1: Swing Trading
Consider a swing trading example where a trader identifies a stock with a risk-to-reward ratio of 1:3. The trade has a stop-loss level set at 5% below the entry price and a profit target set at 15% above the entry price.
Example 2: Day Trading
In day trading, where trades are held for a short duration, a trader may aim for a risk-to-reward ratio of 1:1 or higher. By targeting favourable ratios, day traders can achieve profitability even if a significant number of trades result in losses.
📊 Common Mistakes to Avoid 📊
1. Ignoring Risk Management
Proper risk management is crucial for long-term success. Always consider the risk-to-reward ratio before entering a trade and prioritize risk management techniques.
2. Chasing High Rewards
Avoid chasing trades with unrealistic risk-to-reward ratios. Focus on identifying trades with a balanced risk-to-reward profile rather than solely pursuing high rewards.
3. Failing to Adapt
Adapt risk parameters based on changing market conditions. Regularly evaluate the risk-to-reward ratio and make necessary adjustments to align with the prevailing market environment.
📊 Developing a Risk Management Plan 📊
1. Assessing Risk Tolerance
Understand personal risk tolerance and align it with the risk-to-reward ratio of potential trades. Avoid taking excessive risks that make you uncomfortable and may lead to emotional decision-making.
2. Setting Risk Limits
Establish predefined limits for the maximum amount you are willing to risk per trade or per day. Setting risk limits protects your capital and maintains control over your trading activities.
📈 Conclusion 📈
Mastering the risk-to-reward ratio is crucial for successful trading. By understanding the concept, implementing effective risk management strategies, and consistently evaluating trades based on their risk-to-reward profiles, traders can improve their profitability and achieve consistent trading results. Remember to prioritize risk management, set realistic targets, and adapt to changing market conditions.
Your love and support keep me motivated to write consistently. Please like this Article if you find it helpful and leave your comments with any observations. Thank you for your support, likes, follows, and comments – they keep me motivated to write consistently.
Follow me on TradingView for more articles and trade setups: in.tradingview.com

The Importance of Risk Management in TradingTrading in financial markets can be a lucrative venture, but it also carries a significant amount of risk. The markets are inherently volatile, and unexpected events can have a significant impact on your investment portfolio. That's why risk management is a crucial aspect of successful trading. In this article, we'll discuss the importance of risk management in trading and how it can help you achieve your financial goals.
What is Risk Management?
Risk management is the process of identifying, assessing, and controlling risks that could negatively impact your investments. It involves taking steps to reduce the potential loss of capital while maximizing potential profits. Risk management is a fundamental part of any trading strategy, and it is essential to understand how to manage risk effectively to achieve success in trading.
The Importance of Risk Management in Trading
1. Protecting Capital:
The primary goal of risk management in trading is to protect your capital. By implementing risk management strategies, you can reduce the potential loss of capital in the event of unexpected market movements. This can help you avoid devastating losses that could wipe out your investment portfolio and negatively impact your financial well-being.
2. Minimizing Emotional Decisions:
Trading can be an emotional experience, and emotions can cloud your judgment, leading to irrational decisions. By implementing risk management strategies, you can minimize the impact of emotions on your trading decisions. You'll have a clear plan for managing risk, which can help you make informed decisions based on logic and reason rather than emotions.
3. Maximizing Profits:
Risk management isn't just about minimizing losses; it's also about maximizing profits. By taking calculated risks and implementing effective risk management strategies, you can increase your potential profits. With a solid risk management plan in place, you'll have the confidence to make trades that have the potential to generate substantial profits.
4. Ensuring Long-Term Success:
Successful trading isn't just about making money in the short term; it's also about ensuring long-term success. By implementing effective risk management strategies, you can protect your capital and make informed trading decisions that will help you achieve your financial goals in the long run.
5. Improve Trading Discipline
Risk management is also essential for improving your trading discipline. By setting clear risk management rules and sticking to them, you can avoid impulsive trades and stick to your trading plan. This helps to build discipline and consistency in your trading, which are essential for long-term success.
5. Reduce Stress:
Finally, effective risk management can reduce stress and anxiety associated with trading. By knowing that you have a plan in place to manage potential risks, you can trade with confidence and peace of mind. This helps to reduce stress and improve your overall well-being.
Effective Risk Management Strategies
Now that we've discussed the importance of risk management in trading let's take a look at some effective risk management strategies.
1. Diversification
Diversification is a fundamental risk management strategy. By spreading your investments across multiple asset classes and markets, you can reduce your exposure to any single market or asset class. This can help protect your portfolio from the impact of unexpected market movements.
2. Stop Loss Orders
Stop-loss orders are another effective risk management strategy. These orders automatically sell a security if it reaches a specific price level. This can help you limit your potential losses in the event of unexpected market movements.
3. Position Sizing
Position sizing is a strategy that involves allocating a specific percentage of your portfolio to each trade. This can help you limit your exposure to any single trade, reducing the potential impact of unexpected market movements.
4. Stick to Your Trading Plan
A trading plan is a set of rules that a trader follows when making trading decisions. It includes entry and exit points, risk management strategies, and a set of rules for managing emotions. By sticking to your trading plan, you can avoid impulsive trades and make objective decisions based on analysis.
Conclusion
Risk management is an essential aspect of successful trading. By implementing effective risk management strategies, you can protect your capital, minimize emotional decisions, maximize profits, and ensure long-term success. Diversification, stop-loss orders, and position sizing are just a few of the many risk management strategies you can use to achieve your trading goals. Remember, successful trading is about managing risk effectively, so make sure to prioritize risk management in your trading strategy.
If you find my article helpful, I'd appreciate it if you could like it and follow me on TradingView for more analysis and article like this.


#NIFTY 1DTechnical Analysis of #NIFTY based on harmonic xabcd pattern & on support and resistance . 18925 is the very strong resistance & all time high for #NIFTY on daily time frame we should buy above 18925 and previous level candle closing for the target of 19500 and for 20000. #NIFTY 1st support 18400 & 2nd support 18150,we should sell below when 18400 level break's for the target of 18150 & for 18000.
All the information shared in this chart is provided for strictly educational purposes only. This chart is sharing information are based on the theory of technical analysis . This is not an offer to buy or sell stocks, futures , options, commodity, forex, interests or any other trading security. Back test yourself before jump into live market consult your financial adviser and use proper risk management.

ZEEL in triangle consolidationNSE:ZEEL is forming continuous HL (Higher lows) for 50 trading sessions, and in a triangle consolidation with 3 hits on the resistance line.
Entry : On strong breakout from the triangle
Exit : If breakout is invalidated
Target : Exit at 15%, follow strict SL due to below Cons mentioned
Pros : Low Dept to assets ratio, revenue marginally above expectations continuously, consistent dividend yield
Cons : Income below expectations continuously, very low below its all time high for more than 4 years, PE above SUNTV scrip
Note : FIIs lowering their stake, and DIIs increasing their stake, continuously
Since the fundamentals & financials are not strong, not preferred for long term positions. Just analyzing for breakout gains.
Key note : Always follow proper risk management to avoid losing capital from false breakouts as this is common.
Caution : This is a knowledge sharing analysis, not a call.
