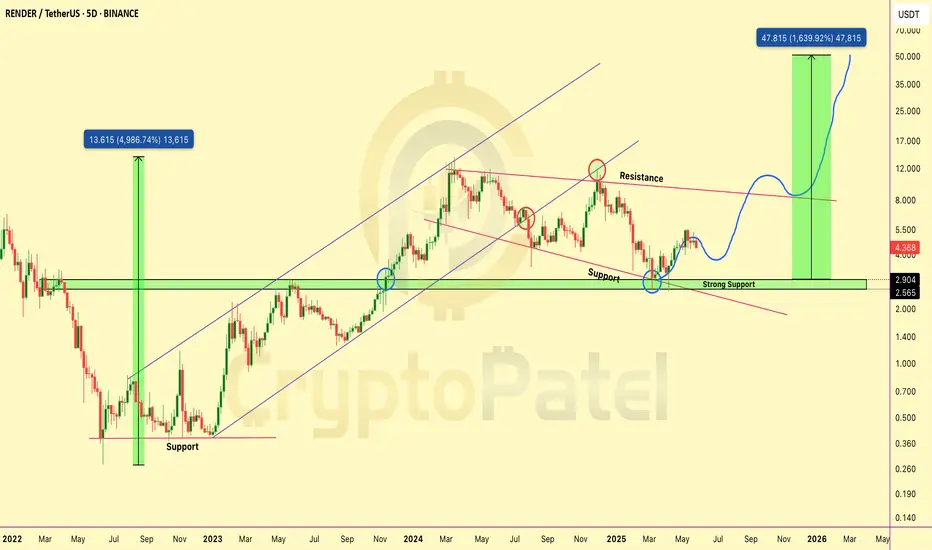
$RENDER Could Be the Next Nvidia of CryptoCRYPTOCAP:RENDER Could Be the Next Nvidia of Crypto
CRYPTOCAP:RENDER is one of the strongest AI projects in crypto right now — and it’s only getting started. The dip you see now?
That’s an accumulation opportunity for long-term believers!
▶️ Best Buy Zone: $4 – $3.40
▶️ Targets: $8.6 / $15 / $25 / $40 / $50
▶️ Strong Support: $2.90 – $2.50
As long as we’re above that — we’re super bullish! ✅
Why CRYPTOCAP:RENDER Can Hit $30–$50 This Cycle:
✅ Solves real problems – powers AI, 3D, VFX, ga
Rndr
RENDER/USDT Bullish Chart Analysis#RENDER/USDT Chart Analysis
CRYPTOCAP:RENDER looks promising, with the next uptrend depending on the $4 support level. If $4 holds, we could see a target of $20!
However, if $4 breaks, expect a potential drop toward $1 support.
Key Levels:
Strong Supports: $4 / $1.50
Resistance: $6.50
RNDR/USDT Bullish Analysis Toward $50RNDR/USDT Bullish Analysis Toward $50
CRYPTOCAP_OLD:RNDR has taken a hit, dropping 75% from its recent peak, but it's now trading around $4.58 and has made a strong recovery from the $3 support level.
Key Buying Zones:
Entry 1: $4 - $3.5
Entry 2: $2 - $1.7
Target: $50
If RNDR can hold above $3, we might see a big move toward $50. But if it dips below, the next best buying spot could be around $2.
Let’s keep an eye on it and stay ready!
RLong
Can $RNDR Hit $50? #RNDRUSDT Analysis:RNDR/USDT Chart Analysis
Bullish Outlook:
CRYPTOCAP:RNDR has shown impressive returns: 34x in a year and 10x in the last 7 months. However, given its impressive gains, current investment in RNDR/USDT carries high risk.
Technical Analysis:
The current weekly candle indicates a strong bounce back from support, signaling that RNDR remains bullish as long as it holds the $7 support level.
If RNDR maintains this support, it could reach new all-time highs (ATH) and potentially rise towards the $5
RLong
$RNDR : Best AI tokenThe recent breakout indicates a strong continuation of this uptrend, potentially setting the stage for the token to hit a new all-time high. LFG!
#RenderNetwork #AI BINANCE:RNDRUSDT
RLong
Catch the Wave: RNDR/USDT Analysis & Potential $50 TargetCatch the Wave: RNDR/USDT Analysis & Potential $50 Target
Elliott Wave Count Insight
CRYPTOCAP:RNDR is currently showing signs of forming an Elliott Wave pattern, suggesting a potential correction in the near future. Our analysis indicates that there might be further correction ahead.
Previous Analysis Recap
In our last analysis when #RNDR was around $10, we accurately predicted a 4th wave correction, which has since been fulfilled.
Current Scenario and Entry Opportunities
There's a strong
RLong
RNDR - Moving on Elliot Wave Pattern#RNDR 1-Day Chart Analysis
RNDR perfectly Moved as per Elliot Wave Theory and now its Correction wave starts, while first cycle of Correction wave is finished yet and movement start towards second upward direction wave and soon up to July in bearish zone time period, its again reach last lowest mark of 1.25 dollar approx.
Invest wisely and #DYOR always.
RLong
RNDR/USDT goes bearish after trendline break..?!!👀💎"Heads up, Paradisers! RNDR/USDT (Render Token) has taken a bearish detour in its price trajectory following a significant trendline break. This disruption in the trendline suggests a shift in market dynamics and a potential alteration in the prevailing bullish sentiment.
💎The breach of a trendline is often perceived as a pivotal technical signal indicating a shift in the equilibrium between buyers and sellers. In the case of RNDR/USDT, the bearish price action post the trendline break signifi
RShort