Precision Wire: Rounding bottom with momentum and volumeNSE:PRECWIRE has the follow features:
A clear rounding bottom consolidation
Then a breakout with a green hollow candle.
Volume is higher than average (vwma)
RSI is entering into 70 (OB) zone.
BUT See the price made a higher high compared to 10th Nov candle, but RSI is low compared to 10th Nov. So, a weaker negative divergence may be forming.
Trade : Buy above 116, SL: 107, T: 121/126
Sell below 107, SL: 110, T: 100/96
Roundingbottom

#Bsoft : Rounding Bottom BreakoutBirla soft : Rounding Bottom Breakout
>> If gap up wait for retracement and try to pick up nr safe entry levels
>> Good strength in stock
>> Good Volume participation
Happy Trading !!!

Adroit Infotech LimitedADROITINFO:- 4 year breakout soon. Buying volume was good keep an eye on it if breakout is found good stock for short term
Hello traders,
As always, simple and neat charts so everyone can understand and not make it too complicated.
rest details mentioned in the chart.
will be posting more such ideas like this. Until that, like share and follow :)
check my other ideas to get to know about all the successful trades based on price action.
Thanks,
Ajay.
keep learning and keep earning.

APOLLO TYRE_Rounding Bottom?APOLLO TYRES Seems like a Rounding Bottom not yet activated. If price sustain above the engagement line 294. It will move higher. refer the target.

#nal trade idea kindly see the levels marked on the chart and see the logic behind the trade
this is only for educational purpose

ATGLATGL:- formed rounding bottom pattern and also breakout the resistance level. consolidate buy on current level. but strict Stop Loss. Go for short term target......!!!!!!!!!
Hello traders,
As always, simple and neat charts so everyone can understand and not make it too complicated.
rest details mentioned in the chart.
will be posting more such ideas like this. Until that, like share and follow :)
check my other ideas to get to know about all the successful trades based on price action.
Thanks,
Ajay.
keep learning and keep earning.

KIRLOSENGKIRLOSENG:- formed rounding bottom. weekly breakout and consolidate. keep on radar. good stock keep accumulate.
Hello traders,
As always, simple and neat charts so everyone can understand and not make it too complicated.
rest details mentioned in the chart.
will be posting more such ideas like this. Until that, like share and follow :)
check my other ideas to get to know about all the successful trades based on price action.
Thanks,
Ajay.
keep learning and keep earning.

Kotak BankKotak bank has been under-performing the bank nifty index a lot. Bnf is giving more than 23% returns from June 2022 lows whereas kotak is still giving only 16% or so returns as of today from the same June 2022 lows. Thus it is lagging in its relative strength and might be a good opportunity if script closes above 1950 with huge volumes then it can certainly tough ATH again.
Happy Trading :)
Disc: Chart posted only for learning purpose.

TITANTITAN:- Formed rounding bottom pattern in weekly chart.
If this resistance break. go for long
keep on radar.
Hello traders,
As always, simple and neat charts so everyone can understand and not make it too complicated.
rest details mentioned in the chart.
will be posting more such ideas like this. Until that, like share and follow :)
check my other ideas to get to know about all the successful trades based on price action.
Thanks,
Ajay.
keep learning and keep earning.

KPITTECH_Rounding Bottom?KPITTECH Seems like a Rounding Bottom not yet activated. If price sustain above the 750. It will move higher. refer the target.

CIPLA_RoundingBottomCIPLA Ltd. Rounding Bottom activated & also price in all-time high. Bullish sentiment, Keep concentrates for long term.

Hi Tech Pipes LtdHigh Tech Pipes Ltd has some of the following features:
A rounding bottom formation and breakout
A rectangular consolidation over time and price is staying above it
Trade: Positional Buy at CMP with a SL of 625, Target: 685. (CMP: 657)

Bullish saucer pattern breakout in Arvind FashionHere's another chart I am sharing for educational purpose where I see a bullish breakout and a potential 30-40% gain.
Entry - CMP : 370
Target - 490
Duration - 3 months to 1 year
Stop Loss - Weekly closing below 330.
Kindly note that this is not a recommendation and only for educational purpose. Invest only after your due diligence.

Jindal Photo: Rounding Bottom BreakoutNSE:JINDALPHOT has a nice, copy-book rounding bottom formation.
It has the following properties in the chart:
A perfect Rounding Bottom formation.
A perfect ascending triangle formation.
Buy above 420 with a SL to the neckline of the rounding bottom (i.e. 400). Below that the SL can be revised to 394.

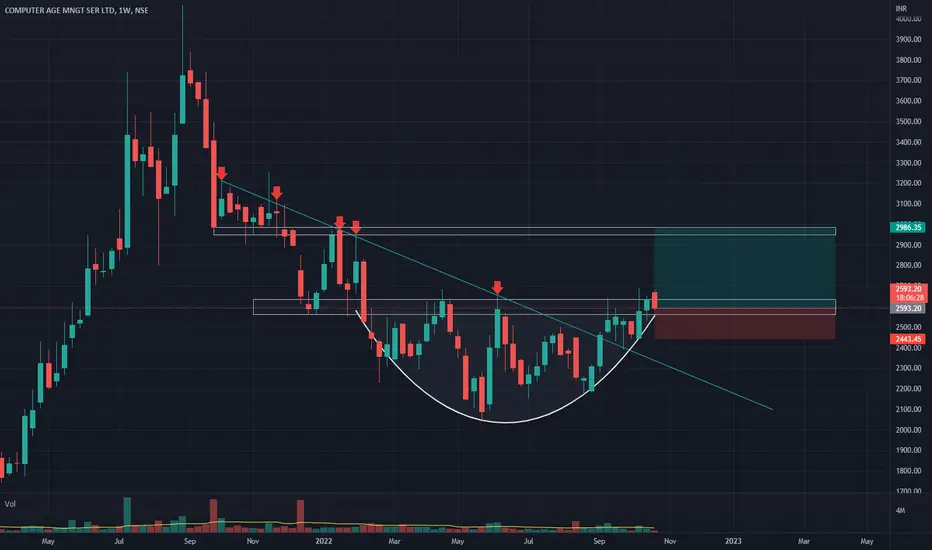
CAMS - Catch it youngStock is in a real nice corrective move from very highs of around 4100. Now after several weeks of consolidation in the form of rounding bottom pattern it is at the verge of breakout the neckline area of 2550-2630. So 'Catch it young before the breakout'.
Happy Trading :)
Disc: Chart posted only for learning purpose.
ICICI Bank| Rounding & Triple Bottom | Life High |27% UpsideNSE:ICICIBANK
CMP 925 is at Lifetime High
Rounding Bottom, Triple Bottom Breakout.
Price Bouncing above Short Term EMAs which are acting as support in the uptrend
RSI in Bullish Zone in all time frames
Targets : 1020 - 1137 - 1209
Upside : 27%
SL : 810
Time Frame : 3 - 6 Months

Ready for Next move
Good Day ,
Hello Traders,
Deepak Nitrate is giving a trendline on a Daily basis. Strength is coming from the bottom.
Good candidate for the Portfolio, near term targets are 2377 / 2679
Chart Self explanatory.
Time Frame : Daily.
Disclaimer : I am not SEBI registered analyst, this is for educational purposes.
Please trade as per your risk and do consult with your financial advisor before taking any
trading decisions..
If you really like the analysis , please do comments, LIKE and Follow me.

Rounding Bottom patternHey everyone! 👋
Today we are going to share a quick write-up about the “Rounding bottom” formation, along with a few examples that may help you solidify your understanding of this chart pattern.
Please remember this is an educational post to help all of our members better understand concepts used in trading or investing. This in no way promotes a particular style of trading!
The post will shed some light on the following topics:
➡ Basics and identification of the pattern
➡ Components
➡ Important aspects
What is a Rounding bottom pattern?
• A rounding bottom is a bullish reversal pattern that resembles the shape of the "U".
• Rounding bottom pattern occur at the end of long downtrends and indicate a potential reversal.
• The pattern is also referred to as a saucer bottom due to its resemblance to a saucer.
• Although, the volume and price move in sync but in practice, this can vary widely.
• When the price moves above the neckline, it indicates strength and suggests that the stock may begin a new uptrend.
Components of a Cup and Handle pattern:
A rounding bottom pattern can be divided into three main parts.
• Decline
• Formation of the base
• Advance
Important aspects:
1. Prior Trend: Since it is a bullish reversal pattern, the prior trend must be a downtrend. The low of a rounding bottom should ideally mark a new low or reaction low. The stock may trade sideways or flat for a long duration before the formation of the pattern.
2. Decline: The sell-off or decline that leads to the formation of the low, can take a variety of forms. Sometimes, the down move has many whipsaws while other times, the stock may just trade flat.
3. Low: In general, the pattern resembles a "U" shaped bottom. However, it can also resemble a "V" or a "W," but the low should not be too sharp. In addition to this, there is always a possibility of a new low due to a selling climax.
4. Advance: In general, the formation of the right half of the pattern should take about the same amount of time as the left half. This means that the up move off the lows should take about the same time as the down move. Moreover, the advance shouldn't be too sharp, or else there is a possibility of breakout failure.
5. Breakout: The pattern is confirmed once the price breaks and sustains above the neckline. The price may return to the neckline to test for the demand before continuing upwards.
6. Volume: In general, the volume levels should be
➡ High during the down move
➡ Low during the formation of the base
➡ Rising during the up move
However, these are only guidelines and should not necessarily be taken at face value.
7. Target: Using the measurement objective, the target comes out to be equal to the depth of the base. It can be measured by calculating the distance between the bottom of the base and the neckline.
8. Stop-loss: Ideally, the stop loss is placed at the lowest point of the base. But if the price oscillated up and down a number of times near the neckline, the stop-loss can also be placed below the most recent swing low.
Exhibit: Rounding bottom pattern with a failed breakout
Thanks for reading! As we mentioned before, this isn't trading advice, but rather information about a tool that many traders use. Hope this was helpful!
See you all next week. 🙂
– Team TradingView
Feel free to check us out on Instagram and YouTube for more awesome content! 💘

COFORGE Rounding bottom, @ Resistance !!NSE:COFORGE
#NSE:COFORGE formed beautiful rounding bottom and trading @ key resistance zone, BO sustainability may show good momentum.
Levels marked on chart.

spotting resistance level on a reversal trendstock has formed a rounding bottom and is likely to form a cup and handle pattern after hitting resistance.

#2 Diwali 2021 pickDiwali 2021- Investment Pick IBREALEST
]Forming rounding bottom on bigger TF
Good valuations at CMP
Best play for the upcoming Real Estate boom!
Good levels to enter around 160-180 zone
Entry - 160-180
Targets- 266 | 342 | 420
~Ashray_G
ILong

CAMS - Rounding bottom + Accumulation done - Swing/InvestmentThe analysis is done on daily TF hence price may take few days to few weeks in order to reach the targets.
Trade setup is explained in image itself.
The above analysis is purely for educational purpose. Traders must do their own study & follow risk management before entering into any trade
Checkout my other ideas to understand how one can earn from stock markets with simple trade setups. Feel Free to comment below this or connect with me for any query or suggestion regarding this stock or Price Action Analysis.

Rounding bottom (Cup & Handle) formation breakout?? #US10YCharts show breakout of rounding bottom formation on Weekly/Monthly charts of US 10year yields. Already got monthly closing above the breakout line.
If sustains above the breakout line minimum target for 10y yield will be around 5.5/6.5 pc. If so, there will bloodbath across all asset classes. Only below 3.4/3.3 negates the idea.
Brace! Brace! Brace! If true, difficult times ahead.
Hope I'm wrong.
Happy trading
