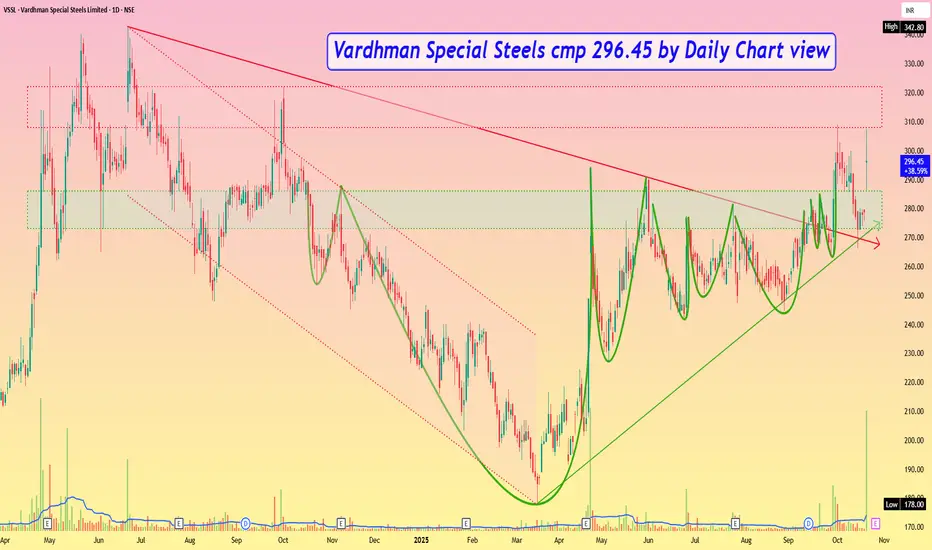
Vardhman Special Steels cmp 296.45 by Daily Chart viewVardhman Special Steels cmp 296.45 by Daily Chart view
- Support Zone 273 to 286 Price Band
- Resistance Zone 308 to 322 Price Band
- Falling Resistance Trendline Breakout well sustained
- Rising Support Trendline well respected by continued uptrend
- Support Zone tested, broken, retested by fresh breakout probability
- Volume surging intermittently over past few days, in close sync with avg traded quantity
- Considerate Head & Shoulders with multiple Rounding Bottoms formed around Support Zone neckline
Roundingbottombreakout
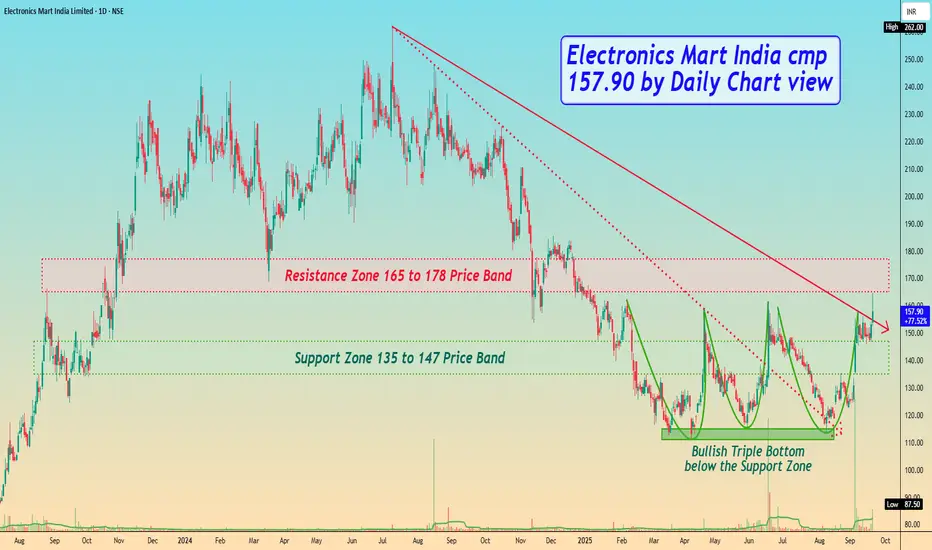
Electronics Mart India cmp 157.90 by Daily Chart viewElectronics Mart India cmp 157.90 by Daily Chart view
- Support Zone 135 to 147 Price Band
- Resistance Zone 165 to 178 Price Band
- Falling Resistance Trendlines Breakout seem sustained
- Volumes surging heavily above avg traded qty over past few days
- Bullish Triple Bottom with considerate Cup & Handle around Support Zone
- Support Zone price band is under testing retesting phase over the past 2 weeks
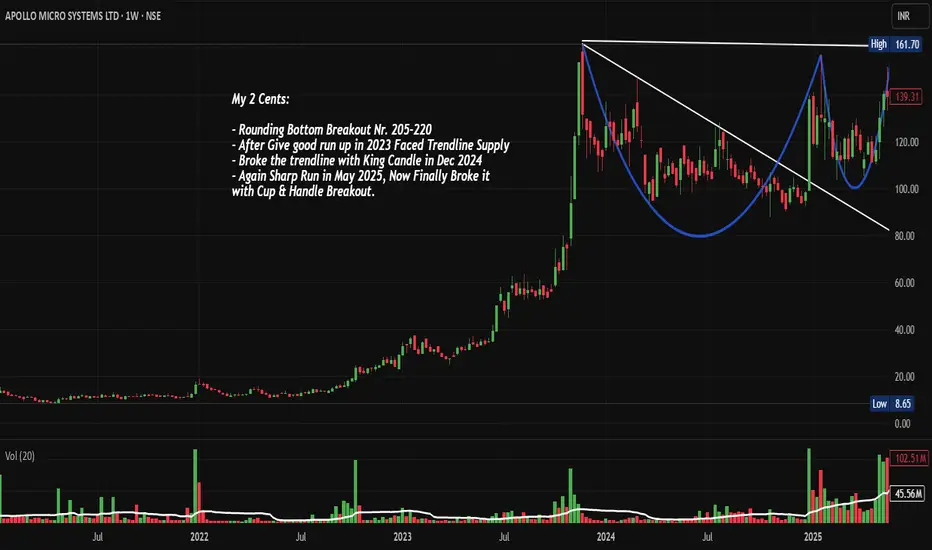
APOLLO: C&H and Rounding Bottom BO: Chart of the Week NSE:APOLLO : The Cup and Handle Breakout That Finally Delivered After Multiple False Starts with Rounding Bottom Breakout on Daily TF Let's Analyze it in the Chart of the Week.
As per the Latest SEBI Mandate, this isn't a Trading/Investment RECOMMENDATION nor for Educational Purposes; it is just for Informational purposes only. The chart data used is 3 Months old, as Showing Live Chart Data is not allowed according to the New SEBI Mandate.
Disclaimer: "I am not a SEBI REGISTERED RESEARCH ANALYST AND INVESTMENT ADVISER."
This analysis is intended solely for informational purposes and should not be interpreted as financial advice. It is advisable to consult a qualified financial advisor or conduct thorough research before making investment decisions.
Price Action:
• The chart reveals a sophisticated Cup and Handle pattern formation spanning from Late-2023 to August 2025, with the "cup" forming between 205-160 levels and the "handle" consolidating around the 180-200 zone
• Multiple breakout attempts were witnessed - first in December 2024 with a King Candle formation, followed by another sharp rally in May 2025, both failing to sustain above the descending trendline
• The current August 2025 breakout represents the third and most convincing attempt, breaking through both the descending resistance trendline and the horizontal resistance at 205-220 levels
• Volume surge during the current breakout (119.95M vs average 54.33M) confirms institutional participation and validates the breakout authenticity
• The curved line clearly marks the rounding bottom formation, indicating a gradual shift from bearish to bullish sentiment
Volume Spread Analysis:
Volume Pattern Insights:
• Exceptional volume breakout with nearly 2.2x average daily volume during the recent surge
• Volume accumulation visible during the cup formation, indicating smart money participation
• Low volume during handle formation, suggesting healthy consolidation
• Volume expansion coinciding with price breakout confirms institutional buying
Key Support and Resistance:
• Immediate Support Zones:
- Primary: 220-225 (previous resistance turned support)
- Secondary: 200-205 (handle formation base)
- Major: 180-185 (cup formation low)
• Critical Resistance Levels:
- Near-term: 250-260 (measured move target from cup depth)
- Intermediate: 280-290 (Fibonacci extension 1.618 level)
- Long-term: 320-340 (cup and handle pattern target)
• Base Formation: Strong accumulation base established between 160-220 over 18+ months
Multi-Pattern Technical Setup:
• Cup and Handle Pattern: Classic bullish continuation pattern with 18-month formation period
• Descending Triangle Breakout: Successfully breached the falling trendline resistance
• Rounding Bottom: Long-term reversal pattern indicating strong institutional accumulation
• Volume Breakout Pattern: Exceptional volume expansion confirming price breakout validity
Fundamental and Sectoral Backdrop:
Latest Financial Performance:
• Net profit surged 126% to Rs 19 crore in Q1 FY2026 compared to Rs 8 crore in Q1 FY2025
• Revenue growth of 46.5% to Rs 134 crore versus Rs 91 crore in the previous year, same quarter
• Quarterly growth basis shows a 32.21% jump in net profits since last quarter
• Market capitalization stands at approximately Rs 7,854 crores, reflecting strong market confidence
Strategic Business Positioning:
• Company is involved in more than 150 indigenous defence programs and 60 DcPP (Defence Capital Procurement Policy) programs as a sub-system partner
• Specializes in ruggedized electronic hardware and software solutions for critical sectors
• Strong focus on import substitution and Atmanirbhar Bharat initiatives
• Diversified client base including DRDO, HAL, BEL, and other major defence contractors
Sector Momentum Analysis:
• Apollo Micro Systems gained 14.6% on August 22, 2025, demonstrating resilience amid market fluctuations
• Stock has significantly outperformed the broader market year-to-date, reflecting strong performance in the Aerospace & Defence sector
• Defence budget allocation increases continue to provide sectoral tailwinds
• Growing focus on indigenous defence manufacturing creates long-term opportunities
Market Participation Analysis:
• High institutional interest is evident from volume patterns
• Retail participation is likely to increase given the breakout visibility
• Options activity expected to increase as the stock approaches higher price levels
• Potential inclusion in small-cap/midcap indices could trigger passive fund buying
Risk Assessment and Scenario Analysis:
Technical Risk Factors:
• Failed breakout history (December 2024 and May 2025) suggests caution is required
• High beta nature means increased volatility during market corrections
• Potential for profit booking at psychologically important 250 levels
• Need for sustained volume to validate the breakout authenticity
Fundamental Risk Considerations:
• Defence sector dependency on government policy changes and budget allocations
• Long procurement cycles are typical in defence contracts, affecting quarterly results
• Competition from established defence majors and emerging players
• Currency fluctuation impact on imported components and raw materials
Full Coverage on my Newsletter this Week
Keep in the Watchlist and DOYR.
NO RECO. For Buy/Sell.
📌Thank you for exploring my idea! I hope you found it valuable.
🙏FOLLOW for more
👍BOOST if you found it useful.
✍️COMMENT below with your views.
Meanwhile, check out my other stock ideas on the right side until this trade is activated. I would love your feedback.
As per the Latest SEBI Mandate, this isn't a Trading/Investment RECOMMENDATION nor for Educational Purposes, it is just for Informational purposes only. The chart data used is 3 Months old, as Showing Live Chart Data is not allowed according to the New SEBI Mandate.
Disclaimer: "I am not a SEBI REGISTERED RESEARCH ANALYST AND INVESTMENT ADVISER."
This analysis is intended solely for informational purposes and should not be interpreted as financial advice. It is advisable to consult a qualified financial advisor or conduct thorough research before making investment decisions.
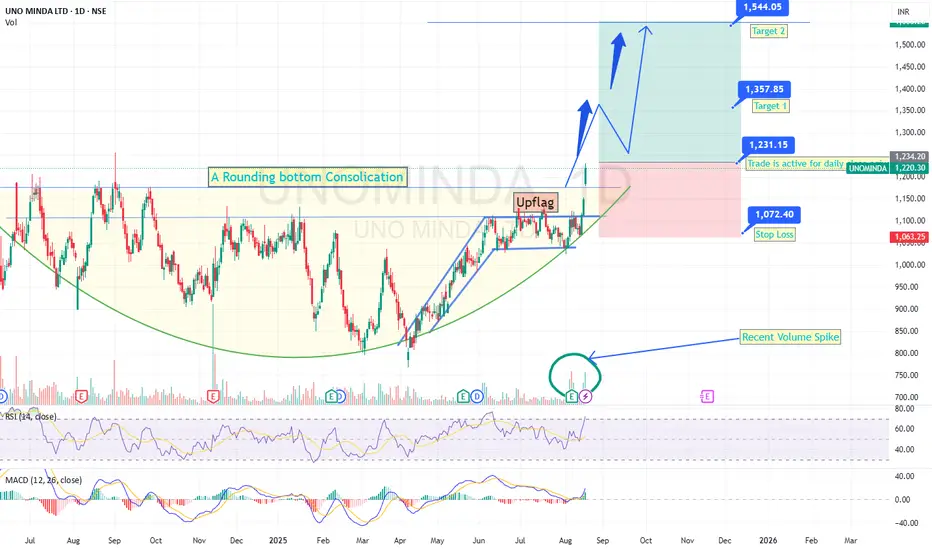
An Upflag Inside an Round bottom consolidation with Gap up B/OUno Minda was consolidating between the 1180-800 price range for past 1.2 years,under a daily time frame.
This is a very good price consolidation with respect to time.
With the recent expectation that the Goverment might slash the GST rate slabs for Automobile Industry, this auto parts maker stock has given a breakout of the rounding bottom consolidation, with an inside upflag break out confirmation too.
Though the breakout has happened with gap up, it is a better candidate for going long, considering the recent surge in volumes with RSI and MACD providing double confirmation.
3 Criteria to consider:
1. Rounding bottrom Breakout
2. Inside upflag breakout
3. News that GST rate migh be slashed for auto industry.
Hence it is better to consider under below levels:
1. Jump in - Daily close >1260
2. Stop Loss - Daily close <1060
3. Target 1 - 1357-1360 range
4. Target 2 - 1548-1550 range.(Takes time, with retest to rounding base and pull back).
The ideas shared here are purely for educational purpose only.
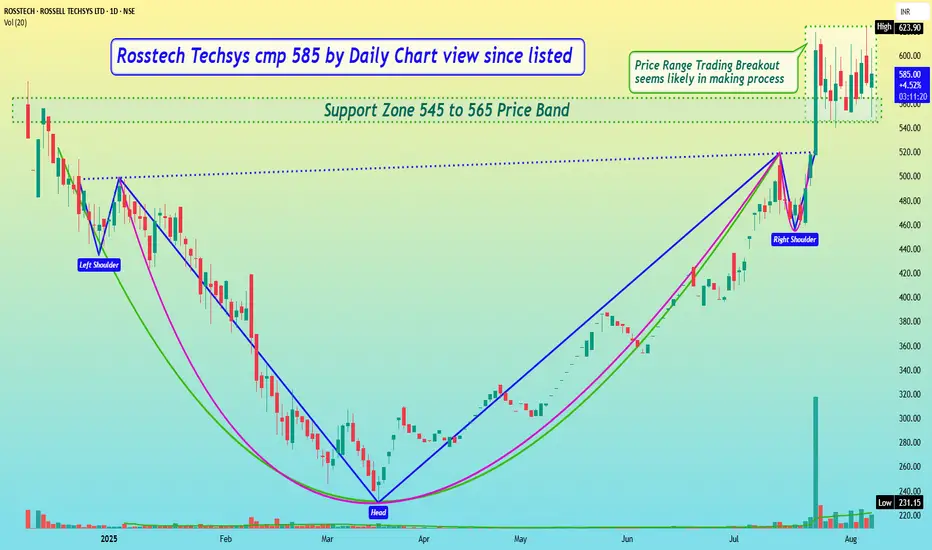
Rosstech Techsys cmp 585 by Daily Chart view since listedRosstech Techsys cmp 585 by Daily Chart view since listed
- Support Zone 545 to 565 Price Band
- Resistance Zone 600 to ATH 613.90 Price Band
- Price Range Trading Breakout seems likely in making process
- Multiple Technical patterns formed Rounding Bottom, Cup & Handle, Head & Shoulders
- Volumes are seen trending well above the average traded quantity over the past few days
ABCapital’s Daily Retest: Bullish Bounce IncomingOn the Daily timeframe, price is revisiting the ₹244–₹248 zone, which had capped rallies three times before the breakout on 17 June 2025. After carving out a classic rounding bottom, ABCapital surged—now it’s offering a second chance to enter:
- Zone to Watch: ₹244–₹248 (prior resistance → new support)
- Timeframe: Daily
- Trend: Strongly bullish in both short and long term
- Upcoming Catalyst: Q2FY26 earnings on 4 August 2025
- Entry Strategy:
1. Look for bullish price action (pin‑bar, bullish engulfing, etc.) on daily candles
2. Verify with a volume pickup on the bounce before initiating a long 👍
Why It Works
- Daily retests of former resistance zones often lead to reliable bounces
- Rounding bottom reflects deep accumulation by smart money
- Daily trend remains intact until broken with conviction
Risk Management
• Stop‑loss just below ₹242
• Trail stops higher as price confirms strength
Targets
- Short‑term: ₹260
- Long‑term: ₹280+ and keep trailing.
🚀 A textbook daily‑timeframe retest in a powerful uptrend—perfect for fresh entries or scaling in.
Disclaimer: This is not financial advice. Conduct your own due diligence and manage risk prudently.
If this resonates, 👍 Boost, 💬 Comment, and 📝 Share your take!
❓ Got another stock in mind? Feel free to ask me which ticker you’d like analyzed next!
Ask ChatGPT

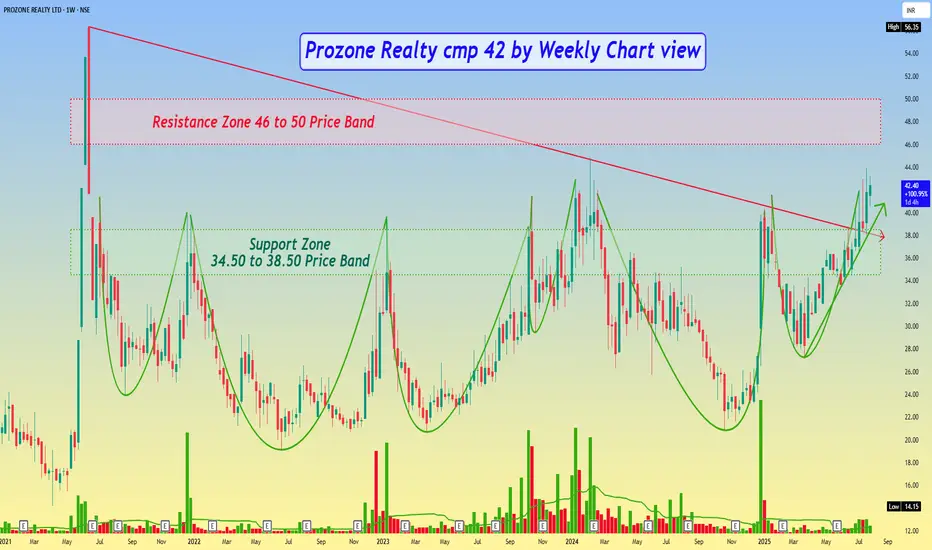
Prozone Realty cmp 42 by Weekly Chart viewProzone Realty cmp 42 by Weekly Chart view
- Support Zone 34.50 to 38.50 Price Band
- Resistance Zone seen at 46 to 50 Price Band
- Falling Resistance Trendline Breakout has well sustained
- Support Zone got tested retested over the past few weeks
- Multiple Bullish Rounding Bottoms made around Support Zone
- Volumes are well above average traded quantity over past few weeks
Gabriel - Rounding Bottom patternA Rounding Bottom (also called a Saucer Bottom) is a bullish reversal pattern, typically indicating that the price is moving from a downtrend to an uptrend.
Rounding Bottom Formation: This pattern often forms over a long period and suggests that after a sustained decline, the asset is gradually transitioning into an uptrend. The price action forms a smooth, rounded curve, rather than a sharp, angular reversal.
Neckline Breakout: The "neckline" is the resistance level that is typically drawn at the top of the rounding formation, where the price has repeatedly failed to move higher. A breakout above this level is a key signal that the trend may be shifting from bearish to bullish.
Price Target: We are expecting that if the neckline is broken, the price could cross 500 level (a psychological round number), which suggests you’re anticipating a significant upside move once the breakout is confirmed. This is consistent with the typical behavior of a rounding bottom pattern, where the potential price target is often calculated by measuring the distance from the bottom of the pattern to the neckline and then projecting that distance upwards from the breakout point.
Trade Details: I am waiting for confirmation of the breakout before providing more details about the trade, including entry points, stop-loss levels, and exit strategy.

Retesting Major Levels UTI AMCNSE:UTIAMC after giving a rounding bottom breakout on weekly charts is now retesting breakout levels. Keep in Radar.
Check out my other stock ideas below until this trade gets activated, I would love your feedback.
Disclaimer: This analysis is intended solely for informational and educational purposes and should not be interpreted as financial advice. It is advisable to consult a qualified financial advisor or conduct thorough research before making investment decisions.

Rounding Bottom Breakout Possible with Heavy Vol.NSE:HDFCLIFE Making a Good Rounding Bottom, Breakout Possible on Hourly Time Frame Keep a Check.

Multiyear Rounding Bottom Breakout RetestingNSE:LUPIN is currently retesting Multiyear breakout, it can also form a cup and handle pattern if it comes down near accumulation and then breakouts on the upperside. 2140 Will Key level on the Upside to break, and 1720 - 1900 will be a good accumulation zone. Keep on Watch.
Disclaimer: This analysis is intended solely for informational and educational purposes and should not be interpreted as financial advice. It is advisable to consult a qualified financial advisor or conduct thorough research before making investment decisions.

A year-long rounding bottom pattern on M_MFINThe key for traders is to watch for a confirmed breakout of the rounding bottom, ideally with high volume. If no immediate breakout happens and a pullback occurs, traders should stay alert for the formation of a cup and handle, which could signal an even stronger continuation of the bullish trend.
Both outcomes—whether a breakout or the formation of a cup and handle—are bullish signals, but understanding the pattern fully can help traders position themselves more effectively.

VAISHALI - Rounding Bottom Breakout on Daily ChartVaishali Pharma gave good rounding bottom pattern breakout on daily chart. This stock is from pharma sector and the pharma sector is currently in good momentum. It has potential to give 20% to 30% return in 4 to 5 weeks. So keep watch on this stock. The target level provided are based on Fibonacci retracement levels which is ₹223 ( 1.33 retracement level) as 1st target, ₹245 ( 1.66 retracement level) as 2nd target and ₹272 ( 2 retracement level) as 3rd target

DIVISLAB - Rounding Bottom BreakoutDIVISLAB has given a good breakout of rounding bottom pattern on weekly chart. The breakout candle on daily chart looks very bullish as it is supported by massive one day trading volume.
We can expect 30 to 50% return in 4 to 6 months.
In this case the target will be depth of rounding bottom pattern which means we can expect ₹8000 levels in few months.
🔊 DIVISLAB - Rounding Bottom Breakout
⌛Duration - Short Term (4 month to 6 month)
📊📈 Trade Logic - Rounding Bottom Breakout
CMP - ₹5426
Time Frame - Weekly
🎯Target 1 : ₹6300
🎯Target 2 : ₹7100
🎯Target 3 : ₹8025
🛑 Stop : ₹4375
🏆 Risk/Reward Ratio (1: 2.4)
Disclaimer: The stock information shared above is not a recommendation to buy, sell, or hold. It reflects my own analysis and is intended solely for educational purposes. Any actions you take based on this information are your responsibility, and the admin of this channel is not liable for any financial gains or losses. Please consult a financial advisor before making any investment decisions. I am not a SEBI-registered advisor.

UTIAMC - Rounding Bottom BreakoutUTIAMC has given a long term breakout of 3 years long rounding bottom pattern. Breakout volume is also significant. If it sustain above breakout level, then we can see a good momentum in short term and can expect below level in coming months.
🔊 UTIAMC - UTI ASSET MNGMT CO LTD
⌛Duration - Short Term (6 month to 8 month)
📊📈 Trade Logic - Rounding Bottom Breakout
CMP - ₹1263.70
Time Frame - Weekly
🎯Target 1 : ₹1425
🎯Target 2 : ₹1600
🎯Target 3 : ₹1850
🛑 Stop : ₹1000
🏆 Risk/Reward Ratio (1: 2.5)
Disclaimer: The stock information shared above is not a recommendation to buy, sell, or hold. It reflects my own analysis and is intended solely for educational purposes. Any actions you take based on this information are your responsibility, and the admin of this channel is not liable for any financial gains or losses. Please consult a financial advisor before making any investment decisions. I am not a SEBI-registered advisor.

LXCHEM - Rounding Bottom Formation🔊 LXCHEM - Rounding Bottom Formation
LXCHEM - Laxmi Organic Industries Ltd
⌛Duration - Short Term (4 month to 8 month)
📊📈 Trade Logic - Rounding Bottom Formation
CMP - ₹297.80
Time Frame - Weekly
🎯Target 1 : ₹380
🎯Target 2 : ₹425
🎯Target 3 : ₹470
🎯Target 4 : ₹540
🛑 Stop : ₹245
🏆 Risk/Reward Ratio (1: 4.5)
Disclaimer: The stock information shared above is not a recommendation to buy, sell, or hold. It reflects my own analysis and is intended solely for educational purposes. Any actions you take based on this information are your responsibility, and the admin of this channel is not liable for any financial gains or losses. Please consult a financial advisor before making any investment decisions. I am not a SEBI-registered advisor.

GANDHAR - Rounding Bottom FormationGANDHAR - GANDHAR OIL REFINE IND LTD
Trade Type - Short Term (2 month to 4 month)
Trade Logic - Rounding Bottom Formation
CMP - 219.36
Time Frame - Daily
Target 1 : 235
Target 2 : 260
Target 3 : 280
Stop : 200
Risk/Reward Ratio (1: 3)
Disclaimer: The stock information shared above is not a recommendation to buy, sell, or hold. It reflects my own analysis and is intended solely for educational purposes. Any actions you take based on this information are your responsibility, and the admin of this channel is not liable for any financial gains or losses. Please consult a financial advisor before making any investment decisions. I am not a SEBI-registered advisor.

KRSNAA - Rounding Bottom BreakoutKRSNAA - KRSNAA DIAGNOSTICS LTD
Trade Type - Long Term (1 year to 1.5 year)
Trade Logic - Rounding Bottom Breakout
CMP - 726.90
Time Frame - Weekly
Target 1 : 815
Target 2 : 940
Target 3 : 1100
Target 4 : 1300
Stop : 630
Risk/Reward Ratio (1: 3.8)
Disclaimer: The stock information shared above is not a recommendation to buy, sell, or hold. It reflects my own analysis and is intended solely for educational purposes. Any actions you take based on this information are your responsibility, and the admin of this channel is not liable for any financial gains or losses. Please consult a financial advisor before making any investment decisions. I am not a SEBI-registered advisor.

KSCL - 3 Years Consolidation / 9 Years Downtrend BreakoutKaveri Seed Company Ltd
1) Time Frame - Weekly.
2) The Stock has been in a Consolidation since (May, 2021) & in a downtrend since (April, 2015). Now It has given a Consolidation and Downtrend breakout & Closed above it's (May, 2021) High with good bullish momentum candle & with huge volume in weekly Time Frame.
3) The next resistance would be it's Life Time High (1075.50) .
5) Recommendation - Strong Buy

Suzlon : Breakout Candidate#Suzlon #VCP #Breakout #trendingstock
Suzlon :
>> Rounding Bottom Breakout + Retest Done
>> Small VCP Visible (Retest zone)
>> Trending Stock
>> Good Strength & Volumes
>> Low Risk High Reward Trade
Swing Traders can lock 10% profit & keep trailing
Please give a Boost or comment if u r Liking the analysis & Learning from it. Keep showing ur Love by following
Disclaimer : This is not a Trade Recommendations & Charts/ stocks Mentioned are for Learning/Educational Purpose. Do your Own Analysis before Taking positions.

Bajaj Consumer - Rounding PatternThe "Rounding Bottom" or "Saucer Bottom" chart pattern is a technical analysis indicator that can signal a potential bullish reversal in the price of a stock. When observed in Bajaj Consumer's stock chart, this pattern suggests that the stock may have reached its lowest point and is poised for an upward trend.
Key points to note that when bullish curve started, started with Morning star then bullish piercing and finally bullish engulfing. Lows of the bullish candle indicate that the market has bottomed out.
Key Characteristics:
Shape: The pattern resembles a "U" shape, indicating a gradual shift from a downtrend to an uptrend.
Duration: It typically forms over a longer period, often several weeks to months, reflecting a slow shift in market sentiment. Here it takes more a year
Volume: Volume tends to decrease at the bottom of the pattern and increases as the price begins to rise, confirming the potential reversal.
Implications for Bajaj Consumer:
Market Sentiment: The pattern reflects a shift from bearish to bullish sentiment among traders and investors.
Entry Point: Investors might consider entering a long position as the stock breaks out from the rounding bottom pattern, signaling the start of a potential uptrend.
Target Price: The expected target price after the breakout can often be estimated by measuring the depth of the rounding bottom and projecting it upward from the breakout point.
How to Trade:
If Bajaj Consumer's stock shows a rounding bottom with the lowest point at ₹200 and the breakout occurs at ₹260, the depth is ₹60. Hence, the target price could be around ₹320 (₹260 + ₹60).
Regards
Arvind Yadav, Cfa
Arvind Share Academy

SAIL - Rounding Bottom PatternNSE:SAIL This Look like Good Rounding bottom pattern Add To Your Watchlist Set Your SL Small

INDNIPPON - #RoundingBottom NSE:INDNIPPON This Break the 6 - Years Resistance and ( RoundingBottom Pattern )
wait For Strong Closing add to Your Watchlist
