Multiple time frame RSI bearish diversion Tata steelMultiple time frame RSI bearish diversion Tata steel. This content is for educational and informational purposes only and does not constitute financial, investment, or trading advice. Trading financial markets involves significant risk of loss, and past performance does not guarantee future results. Users are responsible for their own investment decisions and should consult a certified financial advisor.
Rsi_divergence

AEROFLEX | RSI positive divergence + Reversal signalsAEROFLEX | RSI positive divergence + Reversal signals
CMP : 193

Long Jsw HoldingsTechnical Overview – JSW Holdings Ltd (Weekly Chart)
The weekly chart of JSW Holdings Ltd indicates that the price is currently stabilizing around the 50-week EMA, suggesting the formation of a potential accumulation base. A classic bullish RSI divergence is observed, signalling weakening downside momentum and the possibility of a medium-term trend reversal.
A confirmation trigger is identified at a weekly close above 18,876, which would indicate renewed buying strength and validate a breakout from the consolidation range. The risk–reward structure is clearly defined, with an estimated downside risk of approximately 18% and an upside potential of about 37% from the trigger level. Momentum indicators, including multiple RSI readings, are turning upward from lower zones, reinforcing the improving sentiment.
Overall, the chart setup reflects an early-stage recovery structure, with a breakout above the defined trigger level required to activate a long trade bias.

KOTAKBANK -Long - 2 Hour chartKotak Bank Analysis (2H Chart)
Trend: Price is still in an overall uptrend and has taken support exactly on the rising trendline. The recent fall looks like a normal pullback inside a falling wedge.
Volumes: Volumes were low during the fall, which shows sellers were weak. The latest green candle has slightly higher volume, showing buyers are coming back.
Divergence: RSI has formed a bullish divergence. Price made lower lows but RSI made higher lows. This signals a possible trend reversal on the upside.
RSI: RSI is near 58, which is a healthy zone. Momentum is improving and there is room for the price to move higher.
ADX: ADX is around 38, which means the stock is still in a trending phase. If the price breaks out from the wedge, the trend may continue.
Overall View: The chart is showing early signs of a bullish move from trendline support with divergence and improving momentum.

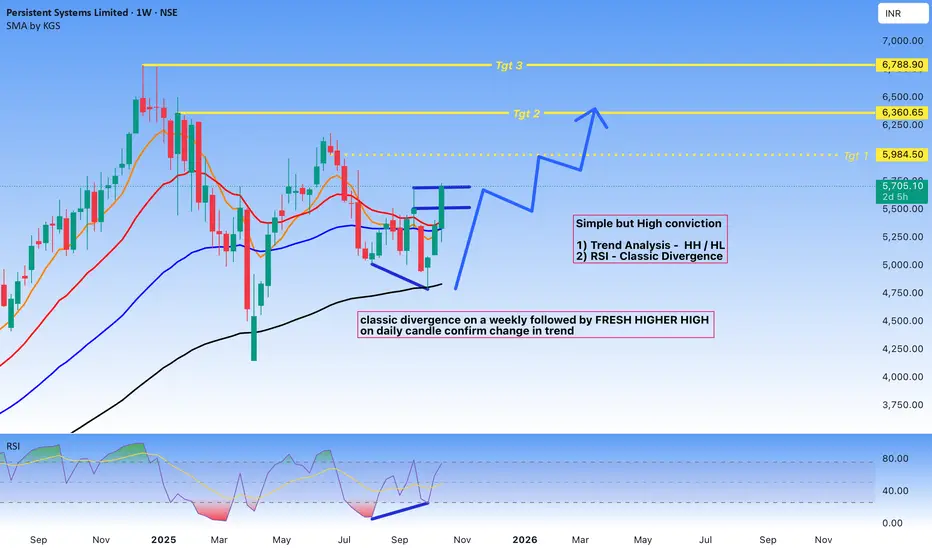
Persistent Technical Analysis#Persistent Systems Limited - Technical Analysis
Chart Overview
**Timeframe:** Weekly (1W)
**Current Price:** 5,708.20
Technical Setup
Trend Analysis
The chart displays a compelling technical setup based on higher highs and higher lows pattern analysis. After a significant correction from previous highs, the stock has formed a strong base and is showing signs of trend reversal.
Key Observations
RSI Classic Divergence
The Relative Strength Index is displaying a classic bullish divergence pattern. While price action formed lower lows during the correction phase, the RSI formed higher lows, indicating weakening bearish momentum and potential trend reversal. This divergence has been confirmed on the weekly timeframe, adding significant weight to the bullish case.
Fresh Higher High Confirmation:
Following the divergence, price action has broken above the previous swing high on the daily candle, confirming a potential change in trend structure. This break represents a shift from the previous pattern of lower highs and suggests renewed bullish momentum.
Price Targets
The analysis identifies three potential target zones:
- **Target 1:** 5,984.50 (Immediate resistance)
- **Target 2:** 6,360.65 (Medium-term target)
- **Target 3:** 6,788.90 (Extended target)
These targets are derived from previous resistance levels and Fibonacci extension analysis.
Moving Averages:
The chart shows multiple moving averages (likely 50 SMA and 200 SMA based on the red and orange lines). Price is currently attempting to reclaim these key moving averages, which would further validate the bullish thesis.
Risk Considerations
While the technical setup appears favorable, traders should consider:
- Confirmation on higher timeframes for reduced false signal risk
- Volume analysis to validate the breakout
- Proper risk management with stop-loss placement below recent swing lows
## Disclaimer
This is a technical analysis for educational purposes only and should not be considered as financial advice. Always conduct your own research and consult with a qualified financial advisor before making investment decisions. Past performance does not guarantee future results.
Multi‑Timeframe RSI Divergence Strategy with CandlesticksA confluence-based setup combining higher timeframe levels, RSI divergence, and candle signals for high‑probability swing entries . Sharing how to Create and backtest strategies on Trading view platform .
Charts used are 3 months or older .

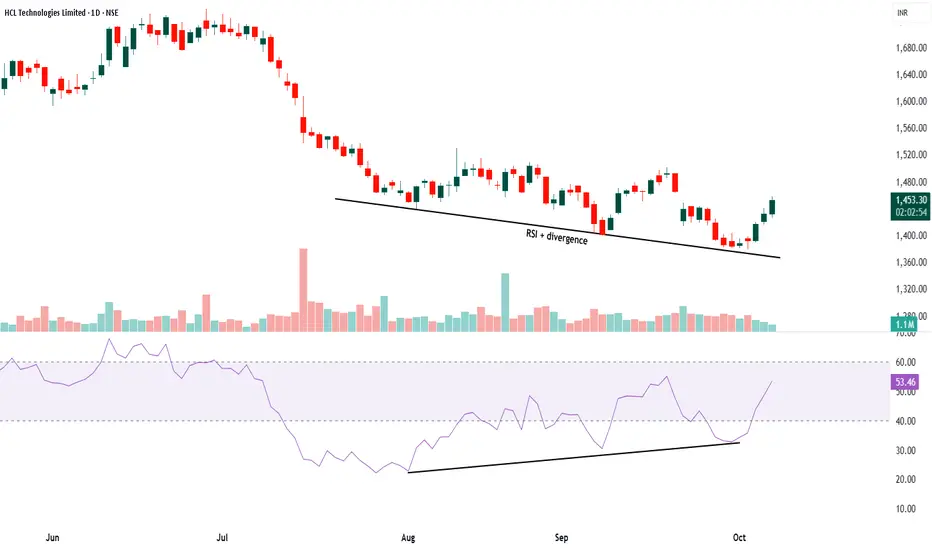
HCL TECH - RSI positive divergenceRSI positive divergence is a powerful technical analysis signal that indicates a potential trend reversal from bearish to bullish. Here's a simple step-by-step explanation for your community members:
Understand RSI: The Relative Strength Index (RSI) measures the speed and change of price movements on a scale of 0 to 100. Values below 40 typically indicate an oversold market, while values above 60 suggest an overbought market.
Spot the price trend: Look at the stock price chart. If the price is making lower lows (falling prices) over time, it indicates a downtrend.
Observe the RSI behavior: While the price is making lower lows, check the RSI indicator below the price chart. In RSI positive divergence, the RSI makes higher lows.
What is RSI positive divergence? It's when the price hits new lows, but RSI doesn't follow and instead forms higher lows. This shows weakening selling pressure and suggests buyers may soon take control.
Interpretation: RSI positive divergence signals the existing downtrend may be losing momentum, making it likely for the price to reverse upwards.
Confirmation: Traders often wait for additional bullish signals or a price breakout to confirm the reversal before entering long positions.
Fibonacci Tool: Why It’s NOT a Trading StrategyMost traders wrongly treat Fibonacci as a standalone strategy—it’s just a support tool, not a secret pattern for auto profits. Discover how real pros use it for bias, not blind buys, and avoid the retail trap

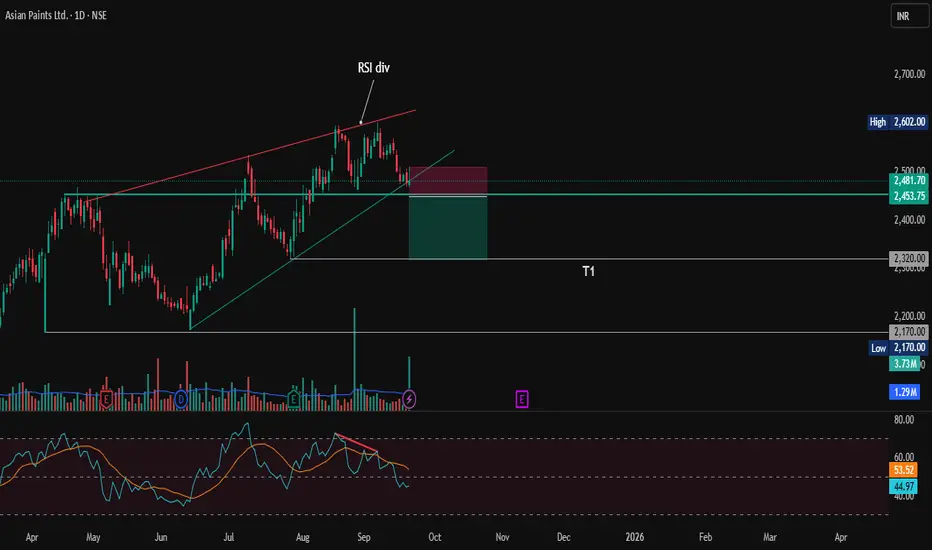
Asian Paints: Short Setup — Bearish Reversal SignalAsian Paints shows signs of a potential short opportunity after forming a bearish reversal pattern (Rising wedge) on the daily chart. The stock failed to sustain above the resistance near 2600, Formed a Double top pattern. The RSI is showing bearish divergence, signaling weakening momentum. hinting at a possible downtrend initiation.
Key Levels to Watch:
Immediate support at 2450 (swing low)
Further downside target around 2320 if support breaks decisively
Trade Plan:
Enter short below 2450 on confirmation of bearish candle close.
Stop loss above 2500 to limit risk from false breakdown.
Target 2320 for conservative exit or trail stop as price moves lower.
Disclaimer: Risk management is crucial in this volatile market, so keep position sizing appropriate. This analysis is intended for educational purposes and not financial advice.
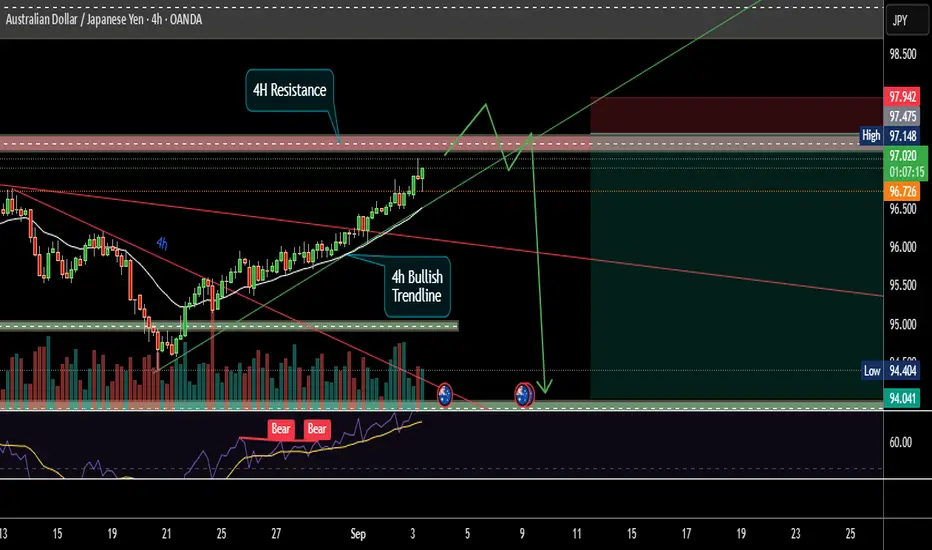
A beautiful AUDCHF high RnR scenarioAUDCHF is approaching 4H resistance zone which has already show rejection previously. There is also a steep bullish trend line creating a confluence. RSI has already shown Bearish Divergence. All these signaling a coming very good sell side opportunity. Below are points detailing the same.
1. Price is approaching 4H resistance zone. Which may act as a strong supply zone.
2. Very steep Bullish Trend line developing a confluence at resistance. Steep trend line are always prone for breakout/breakdown.
3. Most probably price will take liquidity of resistance zone and break trend line.
4. After breaking trend line it should pullback till resistance/trend line or any newly created OB/FVG.
5. RSI also already shown Bearish Divergence and running in oversold zone.
All these combinations are signaling a high probability and high Risk and Reward (1:8) trade scenario.
Note – if you liked this analysis, please boost the idea so that other can also get benefit of it. Also follow me for notification for incoming ideas.
Also Feel free to comment if you have any input to share.
Disclaimer – This analysis is just for education purpose not any trading suggestion. Please take the trade at your own risk and with the discussion with your financial advisor.
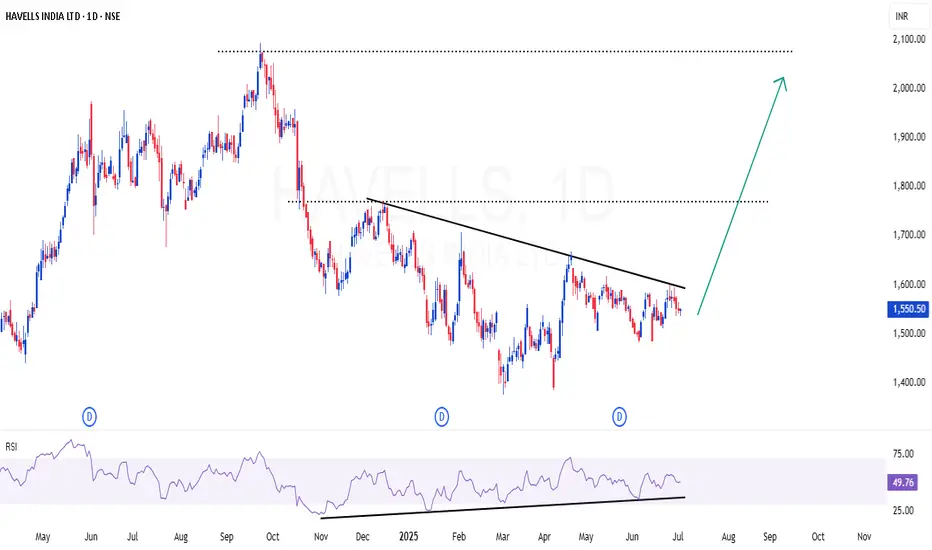
HAVELLS | Pleasant set up - INHS & RSI divergenceHAVELLS | Pleasant set up - INHS & RSI divergence
Strong RSI divergence in daily time frame
Inverted Head & Shoulder setup also in visual
A small dip may be possible for 8-10% in this stock , as market (NIFTY) is over heated. But we can consider that as opportunity to scale up the position
CMP : 1550 (Dip : 1480)
3rd july 2025 Nifty 50 trade plan levels
🔴 Upper Resistance Zones
25,830 – Above 10m Closing: Shot cover level
🔺 Strong resistance zone; if broken, short-sellers may start covering.
25,770 – Below 10m hold PE by Safe Zone
🔻 Safe zone for PE holders if price remains below this level.
🟠 Mid Resistance Zones
25,670 – Above 10m hold CE by entry level
🟢 If price sustains above this level, CE buying (bullish view) is favored.
25,600 – Below 10m hold PE by Risky Zone
⚠️ Below this, PE holders are at risk.
🟣 Key Intraday Sentiment Zone
25,520 – Above 10m hold positive trade view
📈 Market sentiment positive above this level.
25,500 – Below 10m hold negative trade view
📉 Market sentiment turns negative below this level.
⚫ Opening Support/Resistance
25,328 – Above Opening S1: 10m Hold CE by level
🟢 Support zone for CE holders.
25,300 – Below Opening R1: 10m Hold PE by level
🔻 Resistance zone for PE holders.
🟠 Lower Risk Zone
25,228 – Above 10m hold CE by Buy level
🟢 Strong buy level for CE if held.
25,200 – Below 10m hold PE by level
🔻 Risky level to hold PE below.
🟢 S upport/Unwinding Zone
25,092 – Above 10m hold CE by Safe Zone level
🛡️ Safe zone for bullish positions.
25,050 – Below 10m hold UNWINDING level
📉 If price drops below, expect unwinding pressure.

ENVIRO INFRA ENGINEERS (NSE: ENVIRO)View: Strongly Bullish.
Bias: Trend reversal confirmed.
Strategy:
BUY: Initiate around ₹240-₹245 or on retest of ₹230-₹235.
Targets (T):
T1: ₹262
T2: ₹287
T3: ₹312
Stop-Loss (SL): ₹220 (on daily closing basis).
Reasoning:
Decisive breakout from a significant long-term descending trendline.
Strong volume confirming the breakout.
RSI indicating robust bullish momentum.
Potential for significant upside as stock recovers from prior fall.
Note: This is an educational analysis and not financial advice. Do your own due diligence before investing.

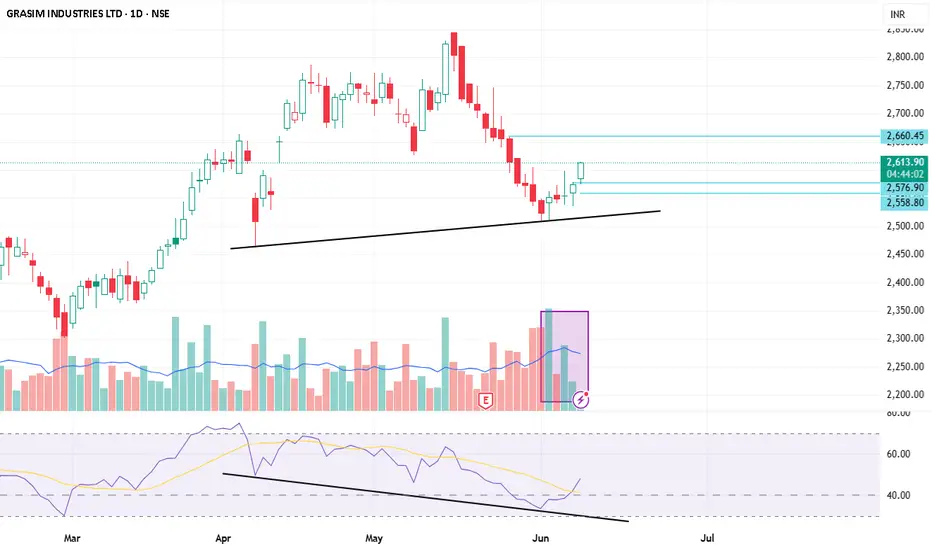
Grasim RSI Divergence observedRSI divergence observed on Grasim Stock with good volume. Add to watchlist and observe for the net movements.
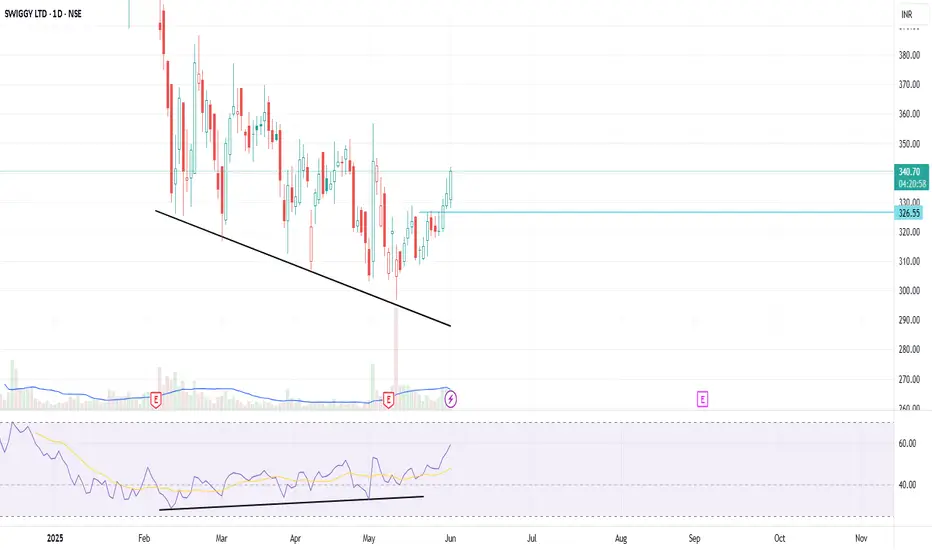
RSI Divergence on Swiggy Daily Time frameRSI divergence marked on above chart in daily time frame.
Entry price: 326
Currently price is on 340 , which is 4% above the entry level.
TG : 10 %
Bearish divergence in SOLARINDSBearish divergence in SOLARIND is supported by falling RSI and higher prices.
The projected targets are key pivots, i.e.,12898, 12641, 12124, and 11411 as T1, T2, T3, and T4, respectively.
Stop will be above 13675.
A safer entry is suggested on break and retest of 13483.50

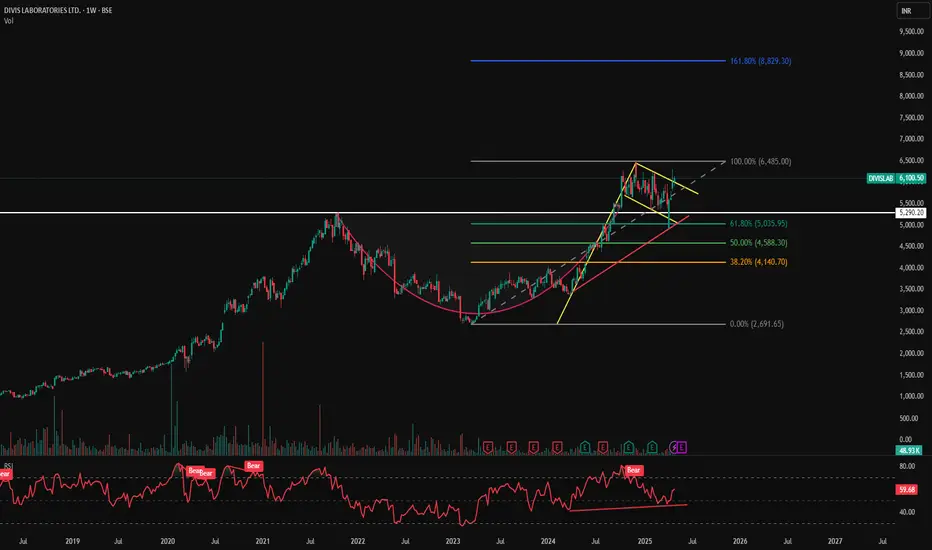
DIVISLAB - Cup Pattern Breakout with Bullish Flag Consolidation📊 DIVISLAB – Cup Pattern Breakout with Bullish Flag Consolidation
🕰️ Timeframe: 1W | 🔍 Pattern: Cup Formation + Bullish Flag | 🚀 Long-Term Breakout Potential
📈 Technical Breakdown:
DIVISLAB has formed a massive Cup pattern on the weekly timeframe and is currently consolidating inside a Bullish Flag after hitting the neckline breakout. This is a classic continuation setup following a long accumulation.
Post breakout, the price tested the upper region and is now preparing for a potential next leg toward Fibonacci extension levels.
🔑 Key Support & Resistance Levels:
🔵 Resistance / Upside Targets:
₹6,485.00 (Cup breakout top)
₹8,829.30 (Fib extension 161.8%) 🟦
🔴 Support Zones:
₹5,290.20 – Local horizontal support
₹5,035.95 – Fib 61.8% retracement (strong support)
₹4,588.30 – Fib 50%
₹4,140.70 – Fib 38.2%
₹2,691.65 – Long-term base (0% Fib)
🧭 Strategic View:
🟢 Bias: Bullish
🔁 Retest Zone: ₹5,290–₹5,035 can be re-entry zones
🎯 Target Zones: ₹6,485 followed by ₹8,829 for positional long
🛑 Invalidation: Below ₹5,000 zone
⚠️ Disclaimer: This is an educational chart setup and not trading advice. Please conduct your own research and risk management.
📣 Follow @PriceAction_Pulse for more such clean breakouts and chart pattern analysis!
🔁 Drop a comment if DIVISLAB is on your radar for the next breakout rally 📈
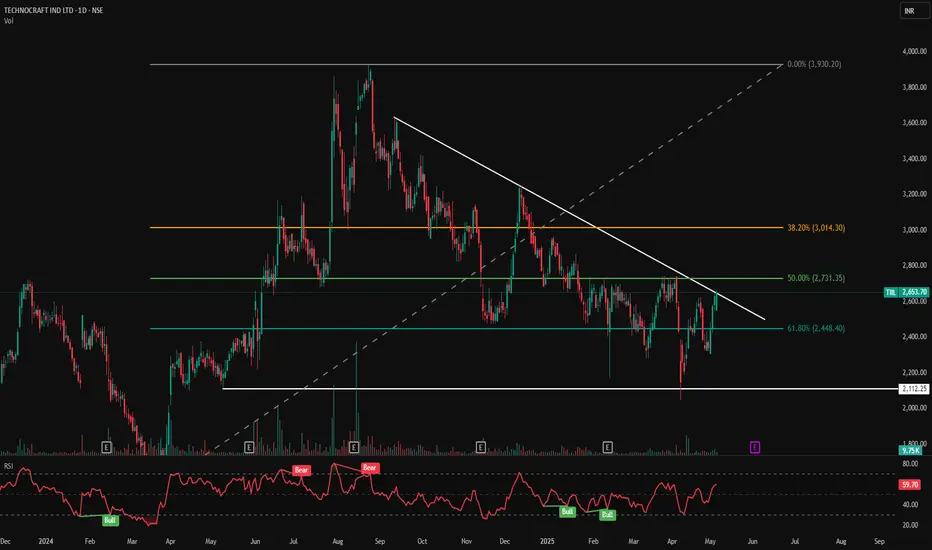
TILL - Descending Trendline Breakout Watch📊 TIIL – Descending Trendline Breakout Watch | Key Fib Retest in Play
🕰️ Timeframe: 1D | 🧭 Pattern: Descending Triangle | 🎯 Fibonacci Reversal Setup
📈 Technical Analysis Summary:
TIIL is currently approaching a major trendline resistance, drawn from its all-time high. After a long downtrend, the stock is now testing the 50% Fibonacci retracement level at ₹2,731.35 with rising momentum.
The price is hovering near a breakout zone and consolidating just below resistance, hinting at potential bullish continuation. A successful breakout can open gates to much higher levels, especially toward the 38.2% Fib zone and beyond.
🔍 Chart Highlights:
⚪ Descending Trendline: Key multi-month resistance line
🟢 Current Price Action: Holding above 61.8% Fib (₹2,448.40) and pushing toward 50% zone (₹2,731.35)
🔵 Base Support: ₹2,112.25 (previous structure low)
📈 Volume: Gradual build-up near resistance zone
🔴 RSI (14): Currently at 59.70 – neutral-to-bullish, showing higher lows
📍 Bullish RSI Icons: Highlighted near recent bottoms, indicating accumulation zones
📌 Support & Resistance Levels:
Type Level (₹)
🔼 Resistance 1 2,731.35 (Fib 50%)
🔼 Resistance 2 3,014.30 (Fib 38.2%)
🔻 Support 1 2,448.40 (Fib 61.8%)
🔻 Support 2 2,112.25 (Major horizontal support)
🧭 Trading Setup Overview:
✅ Bias: Bullish if price breaks and closes above trendline and ₹2,731
💡 Entry Watch: Break and hold above ₹2,731.35 with volume
🛑 Invalidation: Close below ₹2,448.40 (61.8% Fib)
🎯 Upside Targets: ₹3,014 → ₹3,500+ (based on structure)
💬 Conclusion:
TIIL is at a critical juncture with a high-probability trendline breakout setup in play. The Fibonacci confluence, improving RSI, and rising volume indicate a bullish bias. Watch for a strong breakout candle above ₹2,731 for potential positional opportunities.
⚠️ Disclaimer: This chart is shared for educational purposes. Kindly consult your financial advisor before making any trading decisions.
🔔 Follow @PriceAction_Pulse for more high-probability swing setups and technical chart breakdowns!
📌 Save & share if TIIL is on your breakout watchlist!
PREMEXPLN - Cup & Handle Breakout | Volume Surge📊 PREMEXPLN – Cup & Handle Breakout | Volume Surge + Key Fibonacci Confluence!
🕰️ Timeframe: 1D | 📐 Pattern: Cup & Handle | 📊 Momentum: Bullish
📈 Technical Chart Overview:
Premier Explosives has executed a clean breakout above a long-term descending trendline and a cup & handle base with a massive spike in volume, hinting at a powerful trend reversal.
Price surged nearly +19% intraday, confirming strength near the 61.8% Fibonacci retracement from the previous swing high at ₹910.30 to the swing low at ₹253.40.
🔍 Chart Highlights:
☕ Cup & Handle Pattern: Formed over several months, signaling accumulation and breakout
📐 Descending Trendline: Broken with strength and volume confirmation
📊 Volume Spike: Volume highest since April 2024 – strong buyer interest
🟢 Breakout Zone: ₹472.65–₹480.00 (key previous resistance)
🔴 RSI (14): At 67.72 – approaching overbought zone, suggesting strong momentum
🧱 Support & Resistance Levels:
Level Type Price (₹)
🔼 Resistance 1 504.10 (Fib 61.8%)
🔼 Resistance 2 581.10 (Fib 50%)
🔼 Resistance 3 659.90 (Fib 38.2%)
🔻 Support 1 440.00 (Breakout Retest Zone)
🔻 Support 2 308.75 (Horizontal demand zone)
🔻 Support 3 253.40 (100% Fib low)
🔧 Indicators Used:
Fibonacci Retracement – Plotted from ₹910.30 to ₹253.40
RSI (14) – Showing bullish divergence and breaking out of consolidation
Volume Bars – Confirming breakout with institutional strength
Bull/Bear Icons – Track momentum shifts visually over RSI
🧭 Trade Outlook:
✅ Bias: Bullish
🛒 Entry Zone: Retest near ₹472.65–₹480 (ideal pullback entry)
🎯 Targets: ₹504 → ₹581 → ₹660+
❌ Invalidation: Close below ₹440 with volume
💬 Summary:
PREMEXPLN looks strong on the daily chart after breaking a classic cup & handle pattern with volume confirmation. The breakout aligns perfectly with Fibonacci retracement zones, suggesting room for continued upside. Monitor for a potential retest entry.
⚠️ Disclaimer: This is a technical analysis chart for educational purposes only. Do your own research and consult a financial advisor before trading.
🔔 Follow @PriceAction_Pulse for more breakout charts, swing trades & price action insights!
💾 Save and share if PREMEXPLN is on your watchlist this week.

Gic Housing Fin co., Looking good ; min 65 % Roi ; swingAdd this to watchlist and wait for entry.👁️🗨️
For short term investment ;
Leave a " Like If you agree ".👍
.
Wait for small retracement & daily candle to close above - "185".
Trade carefully untill ENTRY level.
.
Entry: 185 / 175
target:201-226-262-300-321
sl:167
major stoploss/ support: 160
.
.
Enter only if market Sustains above
"Yellow box" mentioned.
.
.
Don't make complicated trade set-up.📈📉
Keep it " simple, focus on consistency "💹
Refer our old ideas for accuracy rate🧑💻
Follow for daily updates👍
.
Refer old posted idea attached below.

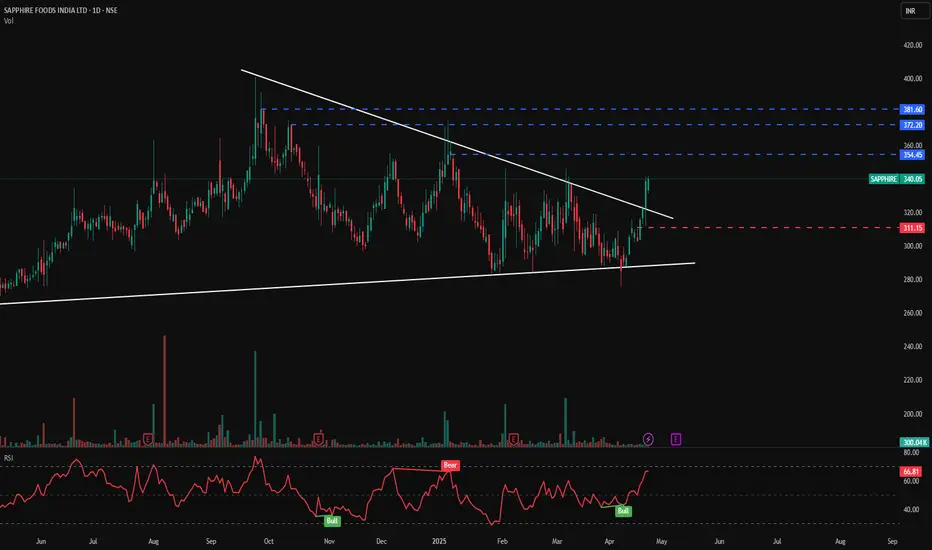
SAPPHIRE FOODS - Bullish Breakout From Falling Wedge📊 SAPPHIRE FOODS – Bullish Breakout from Falling Wedge
🕰️ Timeframe: 1D | 📉 Pattern: Falling Wedge Breakout
🔍 Technical Breakdown:
SAPPHIRE has broken out of a well-defined falling wedge pattern — a bullish reversal signal — backed by a sharp move on increased volume.
This wedge has been forming since early February, and the recent breakout above the upper trendline suggests renewed momentum and buying interest.
🔑 Key Technical Levels:
🔵 Resistance Zones (Upside Targets):
₹354.45
₹372.20
₹381.60
🔴 Support Zone:
₹311.15 (previous resistance turned support post-breakout)
⚪ Wedge Support Line: Well-held and now acting as a base for this breakout rally
📊 Volume & Indicator Insights:
🔺 Breakout is supported by a volume surge (300K), indicating institutional or smart money participation.
🔄 RSI at 66.81, nearing overbought territory but still in healthy uptrend range — confirming strength.
📉 RSI signals:
Bullish crossover (around ₹300) confirmed breakout
Prior “Bear” signal in Feb has now reversed to “Bull” (label shown)
🧠 Bias: Strongly Bullish
📍 Retest of ₹311–₹320 zone could offer re-entry opportunity with favorable risk-reward.
⚠️ Disclaimer: This chart is for educational purposes only. Please conduct your own due diligence or consult a professional before investing.
📈 Follow for more breakout pattern setups | PriceAction_Pulse
💬 Share your views on this wedge breakout in the comments!
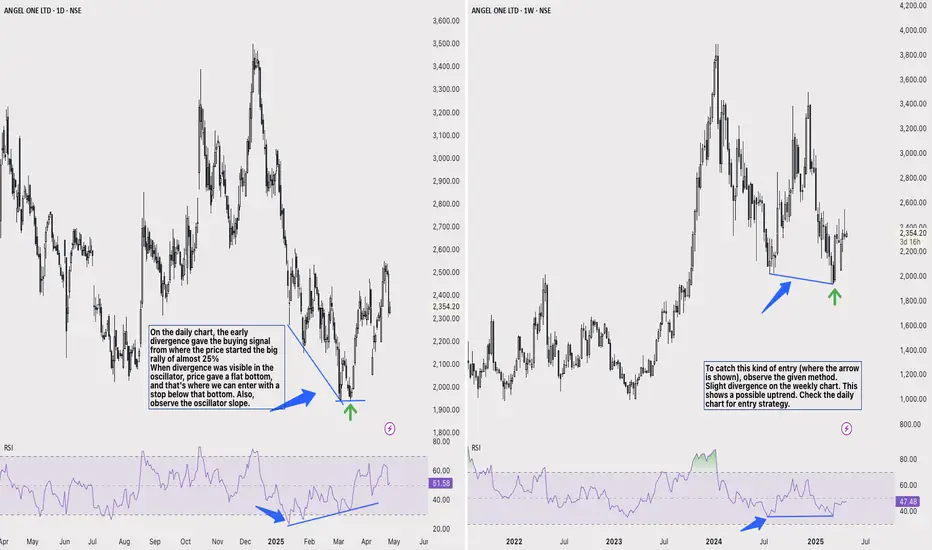
Analysis to catch a divergence rallyObserve the given method to catch this kind of entry (where the arrow is shown).
Slight divergence on the weekly chart. This shows a possible uptrend. Check the daily chart for entry strategy.
On the daily chart, the early divergence gave the buying signal from where the price started the big rally of almost 25%
When divergence was visible in the oscillator, price gave a flat bottom, and that's where we can enter with a stop below that bottom. Also, observe the oscillator slope,it is making higher high and price making lower low and before the rally it gave flat price action.
GOLD - RSI bearish divergence📈 Price Action:
Price made higher highs (seen around $3,246).
📉 RSI (Relative Strength Index):
RSI made lower highs at the same time.
This indicates bearish divergence, a classic sign of potential trend reversal or weakening bullish momentum.
📊 Bearish Divergence Strategy
🔁 Timeframe: 1H (based on chart)
🛑 Strategy Type: Short (Sell) Trade
📌 Trade Setup
📍 Entry Point:
Enter short when price shows confirmation of rejection from resistance (e.g., bearish candle near $3,246).
Ideal entry: around $3,225–$3,230, after divergence confirms and breakdown starts.
🛡️ Stop Loss (SL):
Just above the recent high: $3,250
🎯 Target(s):
Target 1: $3,180 (first support level)
Target 2: $3,150 (major support zone)
Use trailing SL if the move is strong.
🔄 Optional Confirmation:
Use volume (declining volume on higher highs confirms weakness)
Break below recent support candles or trendline for added confidence.
