Accumulate "Wock Pharma"As we can see that prices were in corrective mode since long time and it has been rising since couple of weeks. On weekly charts prices has tested the lower band of triangle and started recovering from bottom. Rsi Divergence also suggest that there is strength in Market and looks good on bottom of the chart. I do expect that if someone want to accumulate they can use 530 as their Stop loss while they can wait till higher band of the chart.
Rsi_divergence

1100 very good multipule supportfollowing two technical indicators:
BOLL band might show a Outside Inside pattern
RSI Positive divergence NSE:ASIANPAINT

UPL At Make or Break at TrendlineUPL is at Trendline Support Expecting Bounce from here towards 766
Stop Can be Maintained Below Days Low

LIC HOUSING - Bullish RSI Divergence at Support ZoneIt has been observed that the price action trending in a down rally but now indicating a reversal due to Bullish RSI divergence, where RSI forming higher high and price action forming lower lows. Now, it shall further move up to the bigger downward trendline at around 640 levels.
T1- 610
T2-630
SL-572

NIFTY (W) Nifty has been galloping at a fast pace over the past few days . The steady support offered by the lower channle of the Pitchfork does augur well for the broader idex as a whole. However we note that the rise has now tread into 1.618 of the recent pullback and hence some profit booking may emerge. The best approach hence would be to book some profits if the Nifty does not hold the first 30 minute range for the day. WHile the prices are heading higher the momentum is heading lower thus cautioning us for the trends ahead. An interesting time in Nifty is unfolding in November.

Reliance next 3/4 days crucialNext 3/4 days are crucial for Reliance to decide on next level whether it will come down or move above current trend line.
Currently RSI is t 70 which had resistance in past, hence if it sustains above 900 script will continue its form.
However if RSI resisted then stock will come back to 825/830 level before retrying.
Any thoughts people?

Infratel - Bullish DivergenceRSI Divergence obvious. Stock has hit rock bottom. 2 Pinbar candles have formed which indicates a trend reversal.
Possible targets - 385

Bounce from the Support zoneREPCOHOME stock price action bounced from the strong support zone 735 ready for the target of 900+ stop loss below 710. viewers can find +ve RSI divergence.

HINDZINC positive RSI divergenceHINDZINC price action shows positive RSI divergence one can buy at the support 239/243 for the target 260/285 stop loss below 230.

Will it bounce back ??? { Bullish Signals }BHEL is currently at 136 levels in downtrend...
Trend reversals signals :
Postitive RSI Divergance, Bullish Hammer and Bullish Engulfing Candlestick Pattern indicates that strong uptrend trend will start..
Targets are 140/147/155/168+
SL : 130
Risk Reward is favourable..
Note: Do your own study before making any positions...


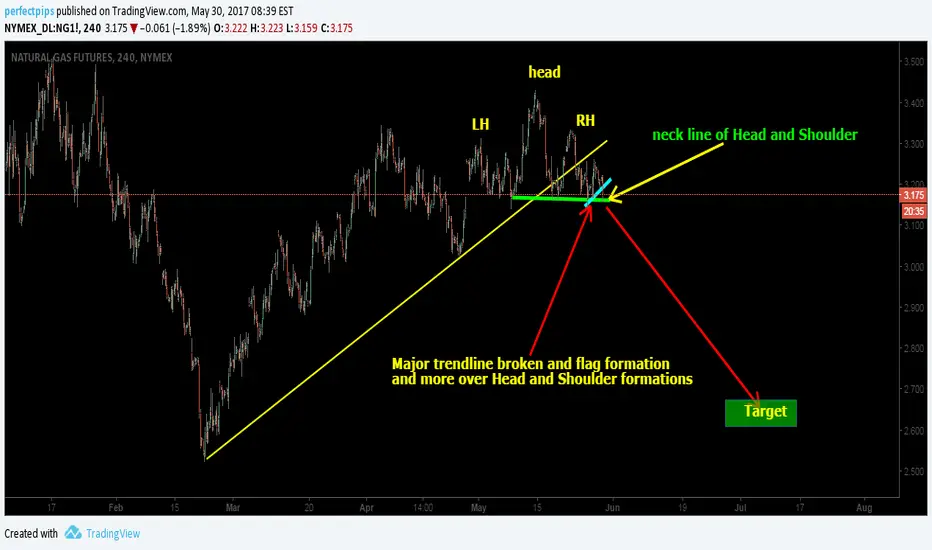
NGAS ON SHORT-Nice place to enter short on ngas after neck line of HS broken
-more over major trendline is broken and flag formations also going on
dont miss this trade
-Trade with care and safe
CRUDE OIL ON SHORTHi guys dont miss this trade we can expecting fall upto $42 and than $38
-Trade with care and safe

Double Top with RSI Divergence RSI Divergence in double top area is showing the potential weakness. The pseudo upthrust bar yesterday with big volume is another confirmation for the potential short today with Stop Loss just the high of the previous day bar.

Time to go long??well with lower lows on RSI dabur can be bought with a stoploss of 269 CB.
Though I am long in June Futures @ 276 (I know bought it a bit too early) but if tomorrow we get a positive closing Dabur can be bought. Since 15th May there has been an Addition of over 5% in futures everyday except for today it was only 2%.
So I think yea small risk big rewards 280-285.

FTSE : How to trade with RSI Indicator ( Educational)I explained how to trade high probability trades with using RSI Oscillator in Trending market. RSI Oscillator is fast moving indicator, Observe RSI Divergence failed to change the direction but still you get the pull back, Notice before price fall RSI hitting bottom that is key indication Price is trying to make higher high. Trend is strong on Upside those divergence are profit booking zones.
Feel free to ask your doubts.

Short Kotakbank small risk TradeThe stock is showing continuous divergence and looks ready to retrace from current level. One can short the stock with small Stop Loss and keep the initial target double the risk involved.

Bollinger Band Reversal Short TradeThe price movement are being captured beautifully by Bollinger Band and one can observe that whenever it has traded out of the band, it has given a nice opportunity to trade the reversal. We can apply the same method and short the stock by providing appropriate stop loss and look for the target of middle/lower band.

buy alert nifty buy above 9223 sl 9200 target 9250,9275
We are not Registered with SEBI, Under RA Regulations. All Calls/Views posted here are for an Educational Purpose Only. Do your Own Analysis

UpSwing to kick-off in Tata-ElxsiBSE:TATAELXSI
Recommendation--> Buy: 1490 - Sell: 1535, 1560, 1600 - StopLoss: 1470
RSI is near 50 which will cross the 60,70 and 80 levels in 3,7 and 10 trading days
Trading sideways in the range of 4.25% (1411 - 1470 - 1530) for 3 months.
On Balance Volume constantly increasing which means accumulation is happening before next breakout.
Currently at the price levels of 'GoldenCross' which was formed on Jan 27, 2017 (2 months back)
Boolinger Bands squeezing with a very high possibility of a breakout above upper band.
.

Short TV18BRDCST Wolfe Wave !The stock has formed a nicely Wolfe wave at the Junction which seems to work as resistance. My experience with this patter is that it works better if it breaks the boundaries come back but we can still take the chance here by providing small stop loss of high of recent swing. Mostly it offers good risk to reward trade. Good Luck!

Nifty - Will buy-on-dips strategy work this time?Will buy-on-dips strategy work this time?
This is the best setups for bulls - buying on dips and a jhat-pat trade. The resistance turns support at 8,970 (pink line) will be crucial for bears to break. The recent rally in the range of 9,000-9,200 seems to be disheartened for bulls. The rangebound session with index being firm above 9K express positive yearly settlement for traders. The move from 1st week of April will be the trend decider.
RSI has broken previous two swing lows while the negative crossover on Stochastic hints the failure of buy-on-dips strategy this time. But the confirmation will only be below the pink line. The move above the fresh highs will negate the setup.

GRASIM SHORT Engulfing & Divergence !Today's big Black candle which engulfed the last 2 candles and closed at lowest level is showing the forthcoming weakness. It is also showing bearish divergence in the overbought Zone. One can short the stock at the level where Stop Loss of 1102 on closing basis is affordable to them.
