Bitcoin Short-forming bear divergencesBitcoin is making bear divergences in uptrend in 15m time frame.Price is making a clear divergence of upcoming bear move as shown in the RSI .If the trendline breaks out,a short intraday trade can be initiated on 15m.Keep an eye.
Rsi_divergence

IEX longIEX showing a long reversal trend.
We gonna go up now
Breakout of RSI and rising volumes is an indicator of the up trend. SL as per appetite 139.2

COFORGE looks in correctionAs seen in above chart NSE:COFORGE Looks in Bearish movement if continued the same move then in Wave5 can go till 2931 fibo ratio 0.5 and next till 0.618. & If it breaks the above invalid level (4036). then it can go up till 4632 in ABC Correction wave.

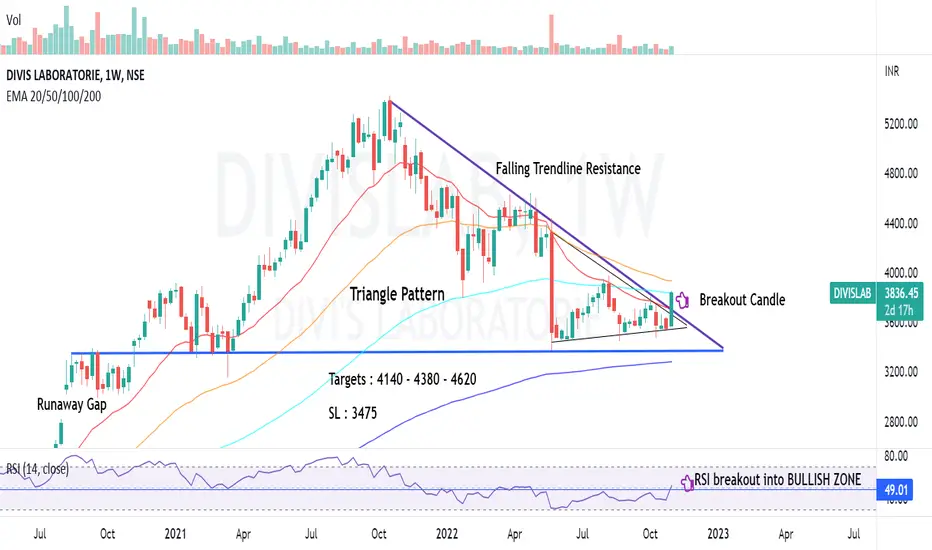
DIVIS LAB | Triangle Pattern BO with Vol | 20%NSE:DIVISLAB
Breakout with volume from Triangle Pattern
Targets : 4140 - 4380 - 4620
Upside : 20%
SL : 3475
Time Frame : 3-6 Months
RSI Back in Bullish Zone
CMP above 20 & 200 Week EMA
RSI Divergance at Sona BLWRSI divergence is spotted at this stock, at daily timeframe.
the stock is making a flat base near 460 level.
but the RSI value is continuously rising. which indicates positive divergence.
a Long trade can be initiated at 460 level,
for First target of 495
and second target of 510
Risk to reward ratio would be 1:2+
SL is a must, at 445 level.

Wipro Investment Idea Wipro Fromed bullish RSI divergence on the weekly Chart. also, It reversed from the 61.8 % retracement level of the Fibonacci retracement of a previous bullish trend.
one can go long on Wipro with the stop-loss of levels marked with an arrow because it acts as a pivot point in the near term.
it might Give a good move when RSI Crosses the 50 level on the weekly chart.
thank you !!

TVS Motor - Bullish Flag FormationBullish flag chart pattern is forming in TVS Motor, Waiting for upside breakout.
RSI above 50 indicate the momentum and strength are positive
20 EMA is acted as support, today
All moving averages are rising upside, showing that the trend is up.

VOLTAS LTD Seems good for a Bounce. Target seems to be 934 and SL - 850. Risk Reward Ratio stands to be at 1:3
Chart & Analysis
ADARSH DEY

BTC to the moon! RSI breakout on daily tf. ALso a Golden crossover awaiting for BTCUSDT
Marking the levels on the chart for the swing.

Gland Long ( 14 Oct)Gland Long ( 14 Oct)
RSI-49
RSI Divergence
Buy at CMP- 2175
SL- 2070
Target- 2345, 2490
Join us, Learn more, Earn more
Disclaimer- We are not SEBI registered advisor.
Charts and views are only for educational purpose.

NYKAA at All time lowAt all time low with divergence in RSI, even bonus announcement could not turn around the sentiments
none of the patterns activate before 1540 high is taken out !!
Buyers should consult their advisor before taking any action !!

Gold Long ( 12 Oct)Gold Long ( 12 Oct)
RSI-45
Buy above- 50880
SL- 50715
Target- 51060, 51180
Join us, Learn more, Earn more
Disclaimer- We are not SEBI registered advisor.
Charts and views are only for educational purpose.

NIFTY RSI analysisNifty showed positive divergence during price fall since last friday. RSI showing continuous increase in strength while price is continuously falling down. swing high of range selected for analysis is 17176.. which is achieved today.

RSI Divergence: Apollo TyresIn NSE:APOLLOTYRE the stock was making Higher highs whereas RSI was making lower highs creating the divergence. The stock yesterday closed below the trendline and so did the Rsi. The target for the same will be the immediate support that is also the channel line of the stock.
* It is my analysis and not a buy or sell recommendation.

BULLISH on INDIAMARTNSE:INDIAMART
The price has given a breakout from the channel pattern. The breakout is with good volume. The MACD is bullish and RSI is above 50 showing good momentum. The MACD and RSI also showing the divergence from he prices which implies that this correction is over and bottom has been made. The view is for 6 to 9 months. SL levels is around 4165.60 and the Target levels is around 5981.50
The price is still below 200 dma and can face resistance there so it is recommended to buy in a staggered way, some on the breakout and rest when price crosses the 200 dma.
Disclaimer : This is my own view and analysis. This is for educational purposes. This is not a recommendation, call or a tip.

going long seeing neckline breakout in the script
going long ....keeping stop and target as per risk appetite
enter at current level
option trade - 7700 or 7800 can be taken @ cmp
lets c how it performes
formations - double top breakout
rsi divergence
cup and handle neckline breakout
disclaimer - for study purpose only

Long BOMRSI breakout done. Golden crossover soon
Also volumes are rising.
Levels are marked.
SL 19.40
Target 20.50, 21.50 ++

LONG EMAMIWinter is around the corner.
Also,
Golden crossover gonna happen soon
Rsi Breakout also happening.
Volumes rising.
SL 478
Target: 546, 583, 620 ++

Zydus LifeSciences revesal - hammer and RSI Bullish DIvergenceZydus Livesciences
Time Frame: Weekly
Name of Pattern: Hammer
View: Potential reversal
What is a Hammer Candlestick?
The hammer candlestick is found at the bottom of a downtrend and signals a potential (bullish) reversal in the market.The most common hammer candle is the bullish hammer which has a small candle body and an extended lower wick – showing rejection of lower prices.
The pattern indicates that the price dropped to new lows, but subsequent buying pressure forced the price to close higher, hinting at a potential reversal. The extended lower wick is indicative of the rejection of lower prices.
Current Market Price (20 May 2022) = 356.85
Name of Pattern: Hammer Breakout (344.60)
Technical analysis:
1. In weekly Time Frame at the bottom Hammer breakout confirmed at 344.60 in Weekly timeframe.
2. Trendline Brakout due aroun 360 -362
3. Stock is in range of 330-375 from last 12 weeks indicates accumulation between this levels.
4. RSI indicator: RSI BULLISH DIVERGENCE. This indicates potential reversal is due in zyduslifesciences at 362-362.
Possible entry : > = 360 -362
Stop loss : 346
Note : Same reentry in case of retracement.
Swing and long term Targets: 375-440-499-540 - 600 - 664 - 700

RSI Convergence in cosmo firstCOSMO FIRST is at support @Daily TF.
and from the chart it is clear that RSI is making higher lows.
Moreover 100 EMA @Weekly TF (@821) is just below current market price.
Red flag (Risks) - The only red flag to consider before building any long position is that all 20, 50 moving averages are below 200 Day EMA.
Conclusion :- It can provide a good swing opportunity in upcoming days, but as it is an early entry SL is a must @830 .

lti back in uptrendstock corrected almost 50% from its 52 week high
and we can see double top formation and price corrected
and now double bottom is formed
and cup is made of double bottom with falling wedge as handle
now we can consider it to be in the buyzone and we also see rsi positive divergence + price closing above 75 ema
so multiple signals prove that we have a strong up trend

tech mahindra back at where it started we can see double bottom , rsi positive divergence and now the price is above 75 ema so it is in buying zone and price already corrected from 52 week highs can accumlate for good risk reward ratio

LONG TinplateAll indicators given a positive!
RSI breakout done. WAiting for rise of volume.
Overall trend is bearish but this will hit target 1 atleast.
Levels are marked.
