Linear Regression with RSI: A New approach to Trend AnalysisHello Friends,
Welcome to RK_Chaarts,
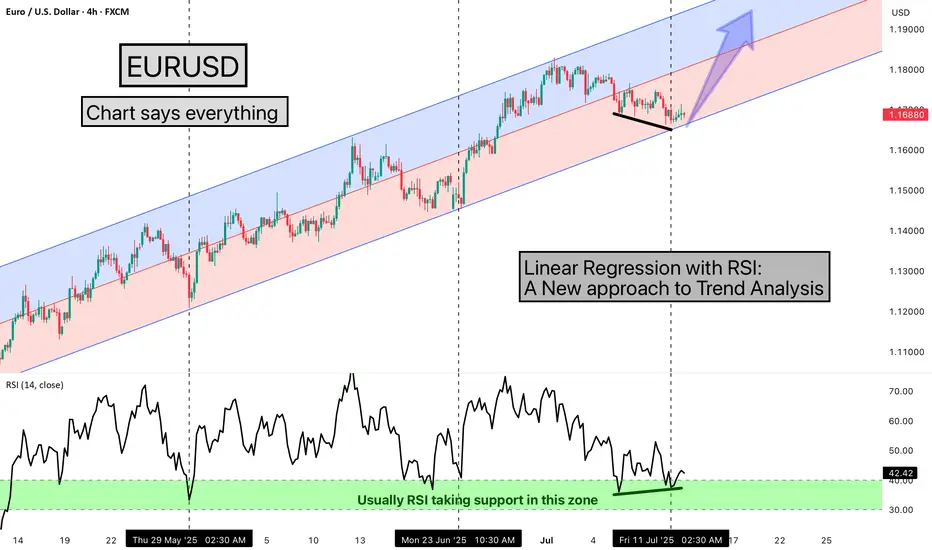
Today we are going to learn one Method of analysing the chart, here we are using EURUSD chart, and the method we're using is very simple & interesting, We are using the Linear Regression Trend Channel & Relative Strength Index (RSI), What happens in this method, is that we identify a particular zone where the price is making a one-sided move, like if the price is trending upwards, making higher highs and higher lows. We then apply a regression channel to it, and within that channel, we set internal deviation for the upper and lower sides, like 2 or 2.5 or 3 etc., whatever setting it takes.
In this chart, we can clearly see that the 2.5 setting is forming a complete channel, which we've applied for the last two months, from 12th May 2025, when the uptrend started. We've used the 4-hour time frame chart and the RSI. Every time the price hits the bottom of the channel, we can see that the RSI also enters the same zone, between 30-40, and from there, it bounces back.
Currently, the price has again hit the bottom of the regression channel, and the RSI has also gone below 40, between 30-40. And the good thing is that we're seeing a positive divergence in the RSI. So, there's a high possibility that the price might bounce back from here.
It's worth watching what happens next in the market. Nothing is guaranteed here; everything is a game of probabilities. This is one method that we often use, and its results have given us a very good experience. So, let's see what happens next in this chart. This observation is also a good learning experience, which we often encounter, 7-8 times out of 10, in favor of the market, but sometimes it doesn't work, maybe 2-3 times, when the trend changes. So, let's see what happens next.
This post is shared purely for educational purpose & it’s Not a trading advice.
I am not Sebi registered analyst.
My studies are for educational purpose only.
Please Consult your financial advisor before trading or investing.
I am not responsible for any kinds of your profits and your losses.
Most investors treat trading as a hobby because they have a full-time job doing something else.
However, If you treat trading like a business, it will pay you like a business.
If you treat like a hobby, hobbies don't pay, they cost you...!
Hope this post is helpful to community
Thanks
RK💕
Disclaimer and Risk Warning.
The analysis and discussion provided on in.tradingview.com is intended for educational purposes only and should not be relied upon for trading decisions. RK_Chaarts is not an investment adviser and the information provided here should not be taken as professional investment advice. Before buying or selling any investments, securities, or precious metals, it is recommended that you conduct your own due diligence. RK_Chaarts does not share in your profits and will not take responsibility for any losses you may incur. So Please Consult your financial advisor before trading or investing.
Rsidivergence
MACD + RSI Divergence Combo – The Deadly Entry Trick!Hello Traders!
In today’s educational post, we’ll break down one of the most powerful technical setups used by pro traders – the MACD + RSI Divergence Combo . When used together, these indicators don’t just show momentum — they reveal high-probability reversal zones. This setup can help you time perfect entries and avoid false breakouts or breakdowns.
Why Combine MACD and RSI Divergence?
MACD Divergence shows when the price is moving in one direction, but momentum is fading — a clear warning of potential reversal.
RSI Divergence helps confirm overbought/oversold conditions and adds strength to the reversal signal.
Combining Both gives double confirmation, increasing accuracy of entries with minimal lag.
How to Trade This Combo Setup
Step 1: Identify Divergence on MACD
Look for a higher high in price but a lower high on MACD (bearish divergence) or lower low in price with higher low on MACD (bullish divergence).
Step 2: Confirm with RSI Divergence
Now check if RSI also shows a similar divergence pattern. If yes — the setup is strong.
Step 3: Enter with Candle Confirmation
Wait for a strong reversal candle (like engulfing, hammer, or shooting star) before entering the trade.
Step 4: Place Stop-Loss
Place SL below recent swing low (for long) or above swing high (for short).
Step 5: Ride the Move with Trailing Stop
Use support/resistance or moving averages to trail your stop-loss and let profits run.
Rahul’s Tip
One divergence = a warning. Two divergences = a sniper entry!
This combo setup reduces noise and gives you clarity — especially during range-bound markets or weak trends.
Conclusion
The MACD + RSI Divergence Strategy is a reliable tool for spotting trend exhaustion and entering before the crowd. Combine this with proper candle confirmation and risk management, and you’ll have a deadly weapon in your trading toolkit!
Have you tried using this combo before? Drop your experience in the comments and let’s learn together!
If you found this post valuable, don't forget to LIKE and FOLLOW!
I regularly share real-world trading setups, actionable strategies, and learning-focused content — all from real trading experience, not theory. Stay connected if you're serious about growing as a trader!

BankNifty: RSI Divergence Impact on TrendsEarlier BankNifty experienced a trend shift, we can see it with respect to RSI divergence, pausing the downward movement and initiating an upward trend.
Caution advised now, as RSI indicates a possible sideways or downtrend until stabilization. Refer to the chart for details.

What Is the RSI Indicator & RSI DivergenceRSI - Relative Strength Index Indicator:
The Relative Strength Index (RSI) is a momentum indicator used in technical analysis that measures the magnitude of recent price changes to evaluate overbought or oversold conditions in the price of a stock or other asset. The RSI is displayed as an oscillator (a line graph that moves between two extremes) and can have a reading from 0 to 100. It is important to note that the RSI does not indicate whether a stock is a buy or a sell; rather, it provides insight into the current trend of the stock.
The RSI is a versatile indicator that can be used by traders of all levels and can be adapted for any style of trading. For example, a trader may use the RSI to identify support or resistance levels, or to spot divergences that can be used to predict future price movements. The RSI can also be used to locate potential trading opportunities by looking for overbought or oversold conditions. Furthermore, the RSI can be used in combination with other indicators, such as moving averages, to gain a better understanding of the market’s overall trend.
Formula of RSI:
The RSI is calculated using a formula that compares the magnitude of recent gains against recent losses over a specified period. The formula for the RSI is:
RSI = 100 - (100 / (1 + (Average of Upward Price Movements / Average of Downward Price Movements)))
What is periods in RSI:
Periods in RSI (Relative Strength Index) are the number of time periods used to calculate the RSI. The most commonly used period for RSI is 14, but other periods such as 7, 9, and 25 are also used. This number represents the number of time periods that are used to calculate the RSI, so a period of 14 would mean the RSI is being calculated using the last 14 time periods.
RSI divergence:
RSI divergences are a type of technical analysis used to identify potential trend reversals in the markets. They are based on the Relative Strength Index (RSI) and are used to spot potential trend reversals before they occur.
A divergence occurs when the price of an asset makes a higher high, but the RSI makes a lower high. This suggests that the current rally is losing momentum and may reverse course. Similarly, a lower low in the price and a higher low in the RSI may signal an impending rally.
Divergences are best used in conjunction with other technical indicators and analysis to confirm price action. It is also important to keep in mind that divergences do not always lead to reversals and may simply signal a period of consolidation before the price continues its current trend.
Divergence Cheat Sheet / Types of Divergence:

Divergence Cheat Sheet / Types of DivergenceWhat is divergence?
Divergence is a method used in technical analysis when the direction of a technical indicator, usually some form of oscillator ‘diverges’ from the overall price trend. In other words, the indicator starts moving in the opposite direction to the price and the trading oscillator signals a possible trend reversal.
Once divergence appears, there is a higher chance of a reversal, especially if divergence appears on a higher time frame.
Oscillator indicator for divergence patterns is Weis Wave Volume, macd, the RSI, CCI, or stochastic OBV.
Types of divergences
There are 4 types of divergence, which are broadly classified into two categories:
1) Regular or Classic Divergence
2) Hidden Divergence
With each of these two categories, you have a bullish or a bearish divergence. Therefore, the four types of divergences are summarized as:
1) Regular Bullish Divergence
2) Regular Bearish Divergence
3) Hidden Bullish Divergence
4) Hidden Bearish Divergence
Divergence patterns indicate that a reversal is coming soon and becoming more likely but this is not an instant change. The more divergence there is visible, the more likely a reversal does become. Here are some guidelines:
The entry can not be taken on the basis of divergence indicator alone.
It’s best if a trader mixes the divergence indicator pattern with their strategy.
Use Higher time Frames.

Spotting A Crash With RSI and MACD in five stepsFollowing are common things one can spot on weekly chart which happen before fall/crash of 2008 and 2020, similar thing can be found in other indices and on all time frames in chart
1. Price will continue to make higher high RSI or MACD indicators will show trend exhaustion with lower high not breaking previous high
2. Series of Negative divergence is seen on chart, look for 3 or more (RSI is leading indicator will produce more divergences compared to MACD)
3. Look for Head and Shoulders or Rising wedge or double top pattern on chart at top of trend
4. Finally Divergence line is broken out upside signaling final move started, that's exit signal 1.
5. Rsi will break line again downside and MACD crosses below signal line, that's exit signal 2.
DISCLAIMER:There is no guarantee of profits nor exceptions from losses.
Technical analysis provided on the chart is solely the personal views of my research.
You are advised to rely on your own judgments while taking any investing/Trading decisions.
Past performance is not an indicator of future returns. Investment/trading is subject to market risks.
Seek help of your financial advisors before investing/trading.
Not recommended to take FnO positions based on this analysis

RSI DIvergence for Bull/Bear TrapToday on Nifty, It was a bear trap after consolidation, Generally, we wait for a strong 15-minute candle when breakout/ breakdown happens. Today after the breakdown Nifty again started an upward journey, Most people thought it's going for Retracement Maybe. It spent some time on the breakdown Point.
At this time if we see RSI, It was showing strength and was indicating that Nifty will go up and it was Fake Breakdown. In the past 3rd Candle RSI was at 33 and then at the same price level it was at 38, It was a clear signal that It's Bear Trap.
RSI divergence help to pick easy trade.
NOTE: Just compare past some candles for RSI divergence, Do not go with a long trade setup. Its most useful in intraday trade

TITANIt has made a Bearish Harmonic Bat in daily time frame. It could retrace till 1200/1175/1100 provided it does not start sustaining above 1270 once again.
Harmonic Patterns are derived from Fibonacci Ratios when each angle of retracement aligns to confirm a reversal probability of 38-50-62 % of the existing trend.


RBL Bank trading near its Lifetime low - FPI Buy Position
Positive Points:
==============
- Stock is trading near its lifetime low.
- Also, RSI positive divergence can be seen on the weekly chart.
- A bulk deal done by FPI(erstwhile FII) for 256.48 rs.
Negative Points:
=============
- India is struggling with TRUST factor with some banks like PMC, YesBank etc. Keeping in mind, banks like RBL Bank, may be affected badly.

CAUTION || CORRECTION IN BATA MAY BE DUE!!!We are seeing a divergence on the RSI and a negative weekly close when the market made a high could indicate starting of long unwinding. Hence it would be wise to be with the market, book the profits and wait for a dip to re enter.

CONCEPT IN PLAY || GLENMARKAn excellent concept of divergence was shown in the charts of GLENMARK Pharma when a revisit of September 2018 heights happened in the first week of January 2019 but then it happened with a decrease in the momentum in the move and hence it was imminent on the RSI.
A double top and a divergent RSI were perfect indicators to show that the move in GLENMARK would halt temporarily. Has been agood short since then. Might be able to give a couple of percent more.
