Eris Lifesciences Ltd: Symmetrical Triangle FormationEris Lifesciences Ltd . is currently exhibiting a Symmetrical Triangle Pattern on its daily chart. This pattern is characterized by converging trendlines formed by lower highs and higher lows, indicating a period of consolidation. While symmetrical triangles often serve as continuation patterns, they can also signal potential reversals, depending on the breakout direction.
The pattern's apex is approaching, suggesting that a breakout—either upward or downward—is imminent. It's crucial to monitor the breakout closely, as the direction will determine the subsequent trading strategy.
📉 RSI Analysis: Indicating Sideways Momentum
The RSI for Eris Lifesciences is currently below 50, indicating a neutral to bearish momentum. This suggests that the stock is in a sideways trend, with neither bulls nor bears gaining a clear advantage. Such conditions are typical during consolidation phases, reinforcing the current symmetrical triangle pattern.
🕯️ Candlestick Insight: Doji Formation
Recently, multiple doji candlestick with long legs has formed, signaling indecision in the market. A Doji occurs when the opening and closing prices are nearly identical, reflecting a balance between buying and selling pressures. The long wicks indicate that both bulls and bears attempted to take control but failed, leaving the market in a state of equilibrium.
This formation suggests that significant market participants are awaiting a catalyst to drive the next move, making it a critical point to observe for potential breakout confirmation.
🧠 Strategic Outlook: Awaiting Breakout Confirmation
Given the current technical indicators—a symmetrical triangle pattern, neutral RSI, and a doji candlestick—it's prudent to adopt a wait-and-see approach. The next significant move will depend on the breakout direction from the triangle:
Bullish Scenario: A breakout above the upper trendline, accompanied by increased volume and a rising RSI, would suggest a continuation of the uptrend. Bearish Scenario: Conversely, a breakdown below the lower trendline, with declining volume and a falling RSI, would indicate a potential reversal to the downside.
In both scenarios, it's essential to wait for confirmation through volume and momentum indicators before entering a position.
📌 Conclusion
Eris Lifesciences Ltd. is at a pivotal juncture. The formation of a symmetrical triangle, coupled with a neutral RSI and a doji candlestick, points to a period of consolidation. Traders should remain vigilant for a breakout in either direction, using volume and momentum indicators to confirm the move before making trading decisions.
As always, it's advisable to conduct thorough research and consider consulting with a financial advisor before making any investment decisions.
Rsistrategy

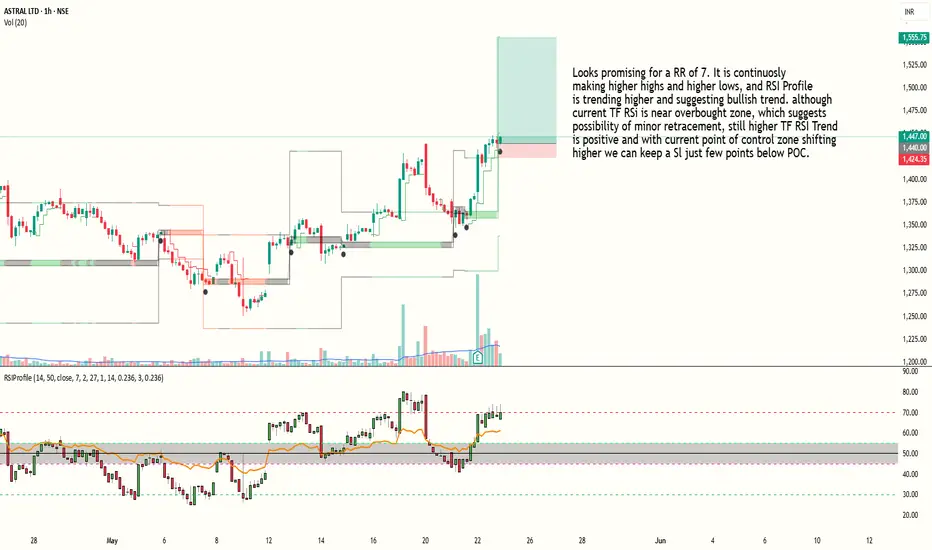
Bullish trade building up in Astral with RR of 7Looks promising for a RR of 7. It is continuosly making higher highs and higher lows, and RSI Profile is trending higher and suggesting bullish trend. although current TF RSI is near overbought zone, which suggests possibility of minor retracement, still higher TF RSI Trend
is positive and with current point of control zone shifting higher we can keep a Sl just few points below POC.
Entry at 1440
SL around 1423
Target around 1555
Risk to reward ratio is around 7.
Indicator used : RSI Hybrid Profile (Link available in my profile)
PS : This is an Educational post and doesn't constitute any trading or financial advice, just do your own research.
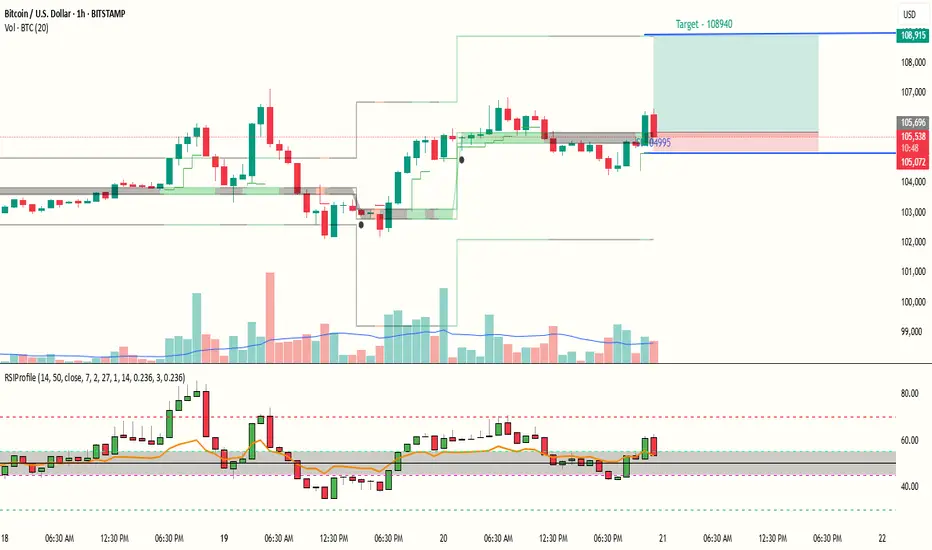
BTC ready for continuation of UP move with a reward ratio of 5RSI Profile shows a positive trend for BTCUSD and and risk reward ration is above 5. Also a Bullish triangle pattern seems to reach near complete on BTC Chart. Price is above RSI Point of Control, hence a small SL below POC and target is near the Value area High.
Entry near 105600
Target near 108940
Sl near 104995
RR : 5.16
PS : Above is only for Educational purpose and does not constitute any financial advice. Do your Own Research.
Multi year breakout detectedAs we discussed in our previous posts. we showing power of RSI. Also showing Cup and handle pattern and multi year breakout
When RSI close above 60 in previous month it can go up by minimum 20% in a short term.
Today's stock is JAGSNPHARM.
So TGT will be 843.
Note: this is not a buy or sell recommendation of any stocks or crypto or forex. This is for educational purpose only.

It can give Big move by 30%Yes, As per my technical analysis If any stock which trade over RSI 60. it will go up by 30%.
Same situation happens in ICICIGI.
ICICIGI gives breakout with RSI in last month. also it generates the cup pattern.
So the target will be 2200.

It can give 13% from NowYes, As per my technical analysis If any stock which trade over RSI 60. it will go up by 13%.
Same situation happens in AMBER.
AMBER gives breakout with RSI in last month. also it generates the cup pattern.
So the target will be 5610
Note: this is not a stock recommandation for buy or sell. this post for learning purpose only.

Keep eye on itAs we discussed in our previous posts. we showing power of RSI. Also showing double bottom pattern.
When RSI close above 60 in previous month it can go up by minimum 20% in a short term.
Today's stock is POKARNA.
Note: this is not a buy or sell recommendation of any stocks or crypto or forex. This is for educational purpose only.

It can go up Monthly RSI> 60.
As we See in previous posts when RSI crossed above 60 then it go up minimum 20 percentage Max we can't say

Ambika Cotton Mills Ltd | A Trending sectorAmbika Cotton Mills Ltd | A Trending sector
Ambika Cotton Mills is engaged in manufacturing and selling specialty cotton yarn catering to the needs of manufacturers of premium branded shirts and t-shirts. Exports constitute significant portion of the operations. The company operates with total installed spindle capacity of 108288 (Previous Year 108288 Spindles) of compact facility housed in four units and Knitting facility of converting 40,000 Kgs of yarn per day into fabrics.
Market Cap =₹ 1,014 Cr. ROCE=20.7 % ROE=14.5 % Debt to equity=0.00
Promoter holding =50.2 % Profit Var 3Yrs=28.9 % Sales growth 3Years=10.8 %
Return on assets=12.4 %
company s almost debt free and having good sales and profit growth.
chart shows rounding bottom and consolidation period over .
its time to up move in momentum side.
friends I am not SEBI registered analysis. this is just education purpose only.
before investing please do your research.
if you like my simple way to teach technical and fundamental analysis than like boost and follow for more.
thanks for supporting me.

The great potential stock detected.Yes, The great potential stock detected which is SUNTV.
The RSI > 60 also 3 white soldires and cup and handle pattern are detected.
So Based on cup and handle pattern Target will be 1145.
Note: this is not a stock recommandation for buy or sell. this post for learning purpose only.

Short-Term Swing Trade:QBE:ASX Insurance Post-New Caledonia NewsTrading Idea: QBE Insurance (ASX)
Technical Analysis:
QBE Insurance, listed on the ASX, has experienced a price drop following recent news from New Caledonia. Despite this, the stock remains in an overall uptrend and exhibits strong fundamentals, making it a potential candidate for a mean reversion trade. Stock has generated Bullish candle stick pattern with RSI breaking out and rising
Entry:
Current Market Price (CMP): $17.75 to $18.00
Stop Loss:
Lower of previous candle: $17.40 to $17.42
Target:
If the price crosses the 9 EMA or reaches $18.45
Risk Reward:
Ratio: 1:2 to 1:2.5
Allocation:
Up to 5-6% of your capital
Type:
Short term swing trade (1-2 weeks)
Conclusion:
Given the recent price dip and the strong overall uptrend of QBE Insurance, this setup offers a favorable risk-reward ratio for a short-term swing trade. Consider entering within the specified range and manage risk with the defined stop loss and target levels.

Deepak NitrateStock has closed with good volumes and good momentum and managed to close above Fibonacci No which is 61.8 one can look to buy abv 2405 sl 2220 tgt 2550.
Disclaimer: I am not SEBI registered Analyst Kindly consult your financial Advisor before taking any trading decisions.

ASIAN PAINTS LTDAsian paints Looks like bottoming out.
ADX about to get a positive divergence and already fell from 50 level
RSI above 50
BUY on dips with a SL of 2770, for the target of 3040 and 3230
CHART & ANALYSIS
ADARSH DEY


MOMENTUM SWING IDEA 15 FEB 24Balaxi Pharmaceuticals Ltd| MOMENTUM SWING IDEA 15 FEB 24
Balaxi Pharmaceuticals Ltd is an IPR-based pharmaceutical Company engaged in producing, stocking, selling, and supplying branded and generic medicines
Financial: strong
Market Cap =₹ 639 Cr. ROCE = 38.5 % ROE = 32.2 %
Debt to equity = 0.12 Promoter holding = 71.2 %
Quick ratio = 1.40 Current ratio = 2.93
Profit Var 3Yrs = 96.0 % Sales growth 3Years =94.6 % Return on assets = 22.1 %
This is pharma sector stock with strong fundamental. Pharma sector is in momentum so I select this stock to ride. Rsi is also showing positive trend. lets see how market recognize it.
Note: I am not SEBI registered financial Adviser. I solely present my views on chart .I do not charge any kind of service. This is not buy sell recommendation.
If you like my ideas than like boost and follow me for more ideas.
Thanks and comment freely

NIIT Learning Systems Ltd | A investment pickNIIT Learning Systems Ltd | A investment pick
NIIT Learning Systems Limited offers Managed Training Services to companies across 30 countries. The NLSL has comprehensive suite of Managed Training Services includes Custom Content and Curriculum Design, Learning Delivery, Learning Administration, Strategic Sourcing, Learning Technology, and L&D consulting services. The company also offers specialized solutions including immersive learning, customer education, talent pipeline as a service, DE&I training, digital and IT trainings well as leadership and professional development services.
Fundamentals:
Market Cap = ₹ 5,538 Cr. ROCE = 36.5 % ROE = 31.8 %
Debt to equity = 0.15 Promoter holding = 34.8 % Return on assets = 15.8 %
its almost debt free learning solution based company its upcoming future is bright .
good financial . we will closely track financial in upcoming years .
If you like my ideas and find some valuable knowledge than follow me and boost my ideas.
note: I am not SEBI registered financial adviser. pls do your own research first.

Tamil Nadu Petro Products Ltd| A Momentum StockTamil Nadu Petro Products Ltd| A Momentum Stock
Tamilnadu Petroproducts Limited, headquartered at Chennai, Tamilnadu, India is jointly promoted by Southern Petrochemical Industries Corporation Limited (SPIC) and Tamilnadu Industrial Development Corporation Limited (TIDCO) and is engaged in the business of petrochemical products viz, Linear Alkyl Benzene (LAB), Caustic Soda, Chlorine and Propylene Oxide.
Friends
you can clearly seen down rectangle pattern break out with rsi above 55(indicate momentum start).
my motto: I learn simple ways and earn simple ways. Though I present all my ideas with simple presentation . so everyone can understand and learn simple ways to make money.
Financial: excellent
Market Cap = ₹ 900 Cr. ROCE = 15.1 % ROE = 11.8 %
Debt to equity = 0.03 Promoter holding = 34.5 %
Quick ratio = 3.65 Current ratio = 4.45 Piotroski score = 4.00
Profit Var 3Yrs = 13.6 % Sales growth 3Years = 20.6 % Return on assets = 8.88 %
company is in well stable financial with momentum zone.
nugget: stock market me shadi vaha hoti hai jaha dol nahi bajate. yani ki jab koi bat na kare us stock ke bare me tab usko buy karna chahie.
Note: I am not SEBI registered financial Adviser. I solely present my views on chart .I do not charge any kind of service. This is not buy sell recommendation.
If you like my ideas than like boost and follow me for more ideas.
Thanks and comment freely

Indoco Remedies Ltd |A Sector Rotation (Pharmaceutical)Indoco Remedies Ltd |A Sector Rotation (Pharmaceutical)
Indoco Remedies (Indoco) is a Mumbai-based pharmaceutical company that focuses on formulations with a presence in contract manufacturing and research.
Market Cap = ₹ 3,758 Cr. Dividend Yield=0.55 % ROCE=17.4 %
ROE =14.8 % Debt to equity = 0.46 Promoter holding = 58.7 %
Quick ratio = 1.13 Current ratio = 1.76 Piotroski score = 5.00
Profit Var 3Yrs = 80.6 % Sales growth 3Years = 14.7 %
Pledged percentage = 0.00 % Return on assets = 9.11 %
Indoco Remedies Limited
is now in momentum zone
I just analyses chart and as per my view I shared my entry exit and tgt
please do your research before investing.
if you like my idea than like and boost and follow me for more ideas.
thanks.

Bajfinance | RSI divergence Strategy 🎯⭕ Swing Trading opportunity ! 1hrs Chart Alert !!! ⭕
--Buy above =5067 or CMP
--Target = 5166 | 5303
--Stop-loss =4999
--Lot Size = 250
--R:R =3.5
--Expected Profit = 59k + ₹ per lot ( 4.66% )
--Expected Holding = 15 day only
#ThankU For Checking Out Our Content , We Hope U Liked IT 📌
======================================================
⭕ Technical Reasons to trade or Strategy applied :- ⭕
1) rsi divergence is the biggest reason
2) Trendline resistance also break
3) volume is good enough
4) support & resistance is already mentioned
Guys check out the related ideas as well, it will work really well GUARANTEED !
🙏FOLLOW for more !
👍LIKE if think is useful !
✍COMMENT Below your view !

GAIL | Be Ready To Buy It.....1. RSI oversold and made higher high while on the line chart there was lower low that means trend is going to change
2. for perfect entry i waited for downtrend to reverse by initiating the trade after trendline break with volume and it is now the same
3. 1st Targets are mentioned as per longterm trenline & 2nd target is based on resistance
DON'T forget to check out the related ideas which i have posted down below
LIKE & COMMENT & FOLLOW
