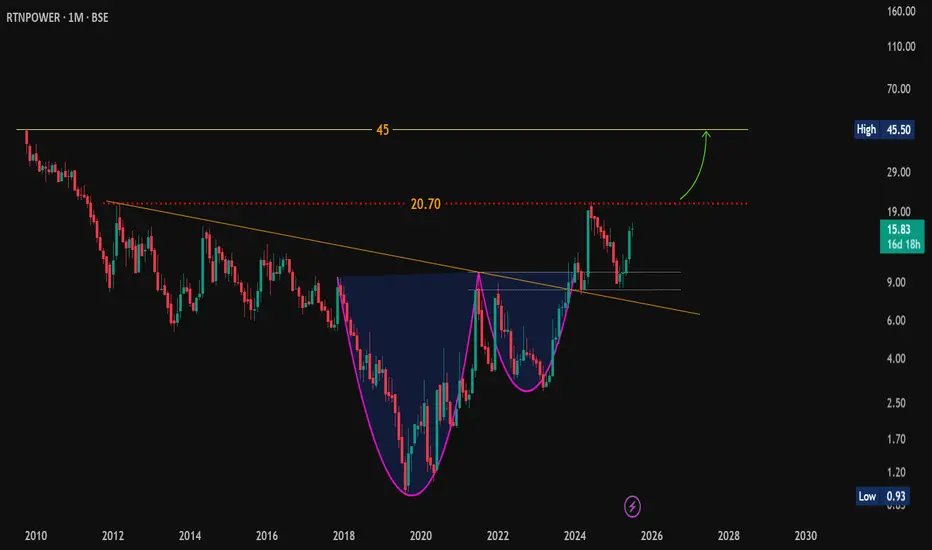
RTNPOWER Nearing Breakout Zone Again After Retest#OnRadar
#RTNPOWER (RattanIndia Power Ltd.)
CMP: 15.83
Support Zone: 10.00 – 7.90
📊 Technical Outlook:
Earlier gave a strong breakout from a Cup & Handle pattern on the long-term chart, rallying up to 21.13. However, it failed to close above the 2012 high of 20.70 on a monthly basis, triggering a healthy pullback to retest the breakout zone.
The stock is now showing renewed momentum. A monthly close above 20.70 may open the door to all-time highs near 45 .
Extended View:
If the stock sustains above its all-time highs, long-term targets of 75 / 100+ could be achievable, subject to broader market conditions and continued trend strength.
📎 This is a technical observation, not a buy/sell recommendation. Please consult a SEBI-registered investment advisor before making any investment decisions.
📝 This stock was discussed in personal circles around ₹3.55 in 2022 for educational purposes.
#RTNPOWER | #TechnicalAnalysis | #CupAndHandle | #StockCharts | #LongTermView
RTNPOWER
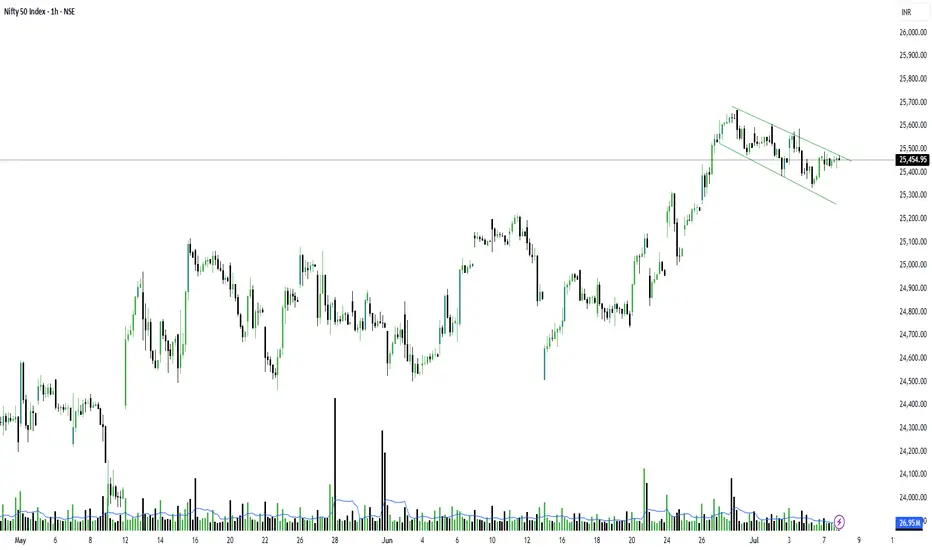
Do not think that nothing has happened in the market today!Do not think that nothing has happened in the market today and it was a pure sideways day.
No, it wasn't.
The intraday trend in NSE:NIFTY has tilted upward, but the daily trend got whipsawed today with sellers outnumbering buyers by 6.6 million volume. However, there was also buying push from the downside, and until that is held, we are good. When that breaks, we may see a downside in a few days.
All this is happening because of #Banknifty. I have been saying that BNF is getting weaker.
However, if the index closes above 25600, then all the negativity will be absorbed.
Until then, the support stays at 25365 as written in yesterday's commentary.
Individual stocks will do good, especially VCPs. Like today's NSE:KRN , NSE:RTNPOWER and NSE:JPPOWER
If you are looking for a good short-term pick, #RTNPOWER must be on your list.
NSE:BANKNIFTY is clearly messing with the trend—whether because of the Jane Street scandal or something else. But everything was clearly visible on the chart, so if you blame Jane Street or the Govt, don't call yourself a trader. No one will save you from such scams. They will continue because the market needs them. Only knowledge to read the chart can help you stay in the market in the long run.
56623 will be the support for BNF, and 57193 is the intraday resistance.
Avoid taking positions with MTF. Avoid intraday as well unless we get a good closing in both of the indexes—mainly BNF.
July is historically a bullish month for markets, but this time I am sitting on cash and not opening any new short-term positions. Waiting for the right opportunity. Let's see.
That will be all for the day. Take care. Have a profitable tomorrow.
RATTANINDIA POWER LTDTechnical View:
Price: ₹14.39 (+3.60%)
Volume: Very strong volume (~645M), indicating institutional interest or strong buying pressure.
EMA: Price is trading well above the EMA – confirms short-term bullish strength.
RSI: Currently at 66.67 – strong positive momentum.
Chart Pattern View:
Price is moving within a well-defined ascending channel.
Recently rebounded from the lower boundary – and now heading toward the upper resistance line.
Candlestick View:
Strong bullish candlestick seen in the current breakout candle.
No upper wick implies buyers were in full control throughout the session.
Buy Opportunity:
Entry Zone: 15.00 above
Target 1: 17.50 (previous swing high).
Target 2: 20.00 ++ (upper channel resistance if momentum continues).
Stop Loss: 12.90 (below breakout level and channel lower band).

RTNPOWER – A Classic Price Action Study Around Major Trendlines🟦 Dotted Blue Line
Represents the main counter trendline, stretched over a significant duration. Price has currently pushed above it, but the weekly candle is still open.
⬜ White Line (Hidden CT)
A hidden resistance line, drawn from key lower highs. Price is currently reacting near this line — acting as a logical area where sellers might test control ( for my setups )
🟨 Yellow Zones
These levels highlight higher lows, a sign of evolving structure. These bases often add context to the strength behind a breakout move.
🔴 Red Line (MTF Resistance)
Plotted from historical monthly rejection zones — a crucial area for confluence and reaction.
🛠️ Only sharing my Charting — no recommendations, no forecasting .

#TORNTPOWER 1668 TGT 15% 1940+ NSE:TORNTPOWER
Target 1940 15% upside
NSE:TORNTPOWER CPM 1668
TGT 1940+ (15%)
SL 1550
TF < 6M
If you like my work KINDLY LIKE SHARE & FOLLOW this page for free Stock Recommendations. With 💚 from Rachit Sethia

RTN POWER - BULLISHWave 4 unfolding
Stock almost bottoming out with low volume
Ready to break trendline
Expect big targets in coming time

#RTNPOWER TRADE SETUPGreetings Folks,
today i have prepared a setup of RTNPOWER on NSE
the analysis is as follows-
- The price is speculating in a minor range right now
- very straight forward setup, wait for breakout either side as i am not in a particular bias right now
don't play with fire, always use a predefined stoploss
RTNPOWERprobably head & shoulder in making on multi year time frame. need to stay above 5.4. support at 4.35. target 13.5 in next 1 year.
