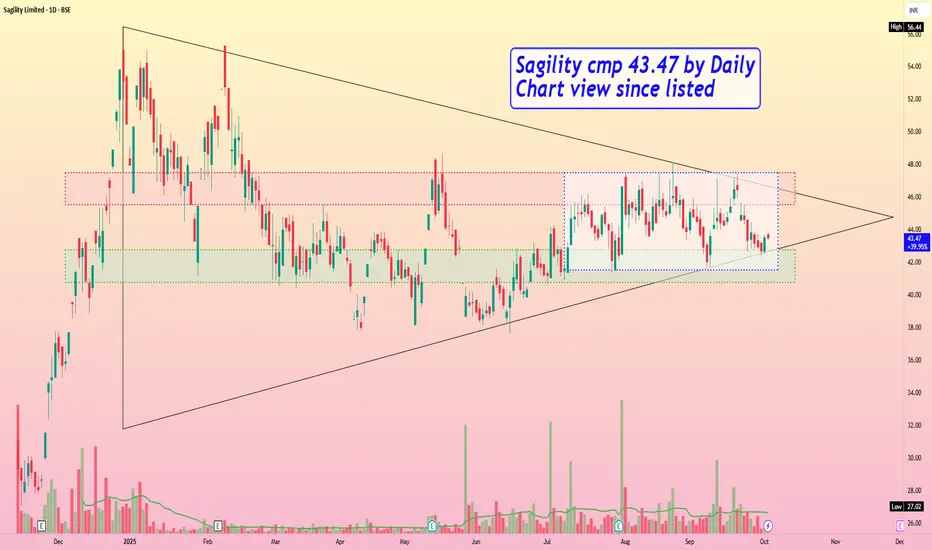
Sagility cmp 43.47 by Daily Chart view since listedSagility cmp 43.47 by Daily Chart view since listed
- Support Zone 40.75 to 42.75 Price Band
- Resistance Zone 45.50 to 47.50 Price Band
- Price traversing inside Symmetrical Triangle pattern
- Support Zone repeatedly tested rested since month of July 2025
- Price trending in Darvas Box range 41.50 to 47.50 and awaiting Breakout
- Price rejection seen by frequent selling pressure at Resistance Zone upper band
- Fresh Breakout possible basis supportive Volumes based closure above 47.50 price level for few days
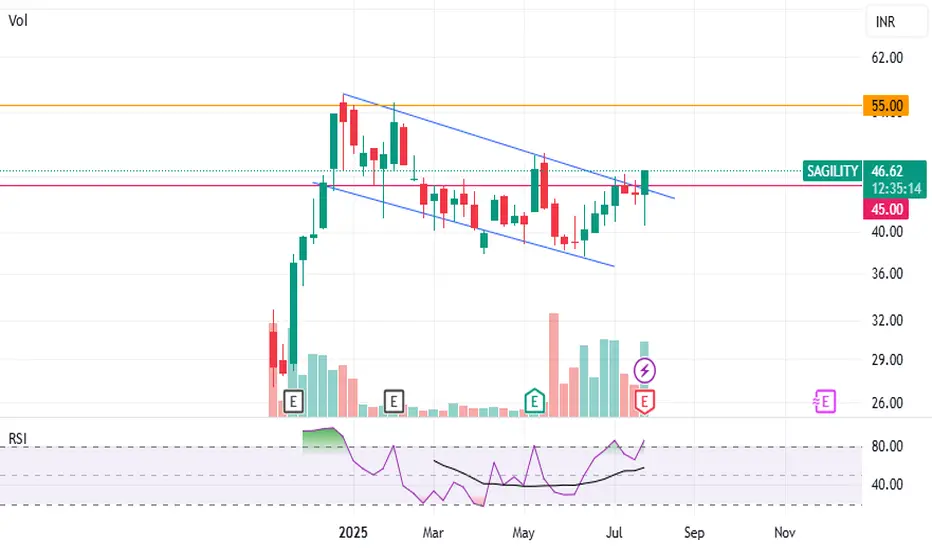
SAGILITY
Sagility India LtdSAGILITY has been trading within a descending wedge pattern and has now broken above the upper trendline, confirming a bullish momentum. This breakout is further validated by rising volume, adding strength to the move.
Additionally, while the price was making lower lows, the RSI showed higher lows, indicating underlying strength. The stock is also trading above key moving averages, suggesting a continued bullish bias.
If it sustains above 45, targets of 52 and 55 seem achievable. If it closes above 55, it could unlock higher levels.