SARDAEN: Triangle Breakout, Chart of the WeekWhy NSE:SARDAEN Triangle Breakout Could Signal the Next Big Move in it, let's analyze in "Chart of the Week" Post Strong Q1 FY26 Results
As per the Latest SEBI Mandate, this isn't a Trading/Investment RECOMMENDATION nor for Educational Purposes, it is just for Informational purposes only. The chart data used is 3 Months old, as Showing Live Chart Data is not allowed according to the New SEBI Mandate.
Disclaimer: "I am not a SEBI REGISTERED RESEARCH ANALYST AND INVESTMENT ADVISER."
This analysis is intended solely for informational purposes and should not be interpreted as financial advice. It is advisable to consult a qualified financial advisor or conduct thorough research before making investment decisions.
Price Action Analysis:
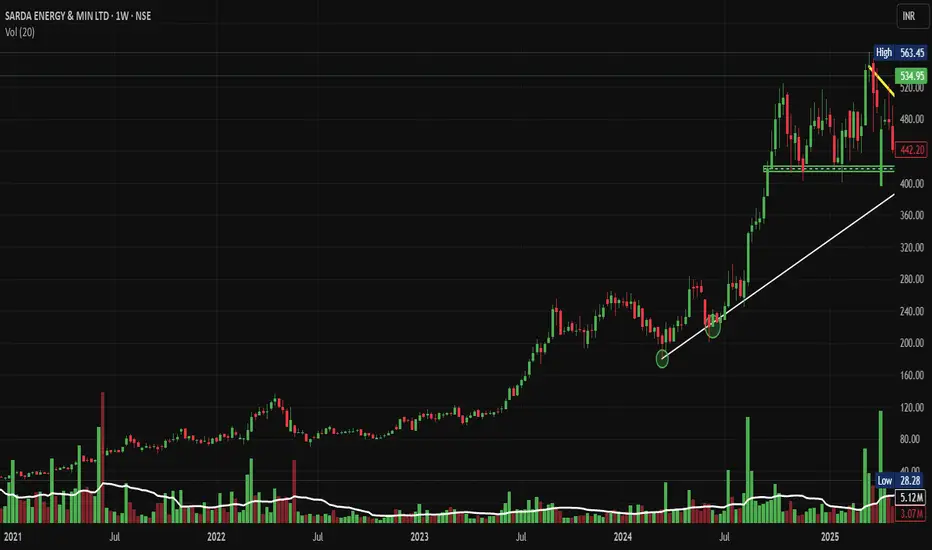
• Stock has exhibited a strong uptrend from 2022 lows around ₹120-140 to current levels of ₹534.95
• Major rally phase from mid-2023 onwards, gaining over 300% in approximately 18 months
• Current consolidation phase since late 2024, around ₹400-600 range, indicates institutional accumulation
• Recent price action shows formation of higher lows with resistance being tested multiple times
Volume Spread Analysis:
• Volume spikes during major breakout moves confirm institutional participation
• Recent consolidation accompanied by relatively lower volumes, typical of the accumulation phase
• Volume breakout above 7.11M suggests renewed interest at current levels
• Volume pattern supports the bullish bias with buying interest on dips
Key Technical Levels:
Base Formation:
• Primary base established between ₹400-₹430 levels during 2024 consolidation
• Secondary base forming at ₹480-₹500 range as recent support
• Base width of approximately 8-10 months indicates a strong foundation for the next leg up
Support Levels:
• Immediate Support: ₹480-₹500 (recent swing lows and 50-day moving average area)
• Strong Support: ₹420-₹440 (previous resistance turned support)
• Major Support: ₹380-₹400 (long-term trend line support and 200-day moving average)
Resistance Levels:
• Immediate Resistance: ₹560-₹580 (recent highs and psychological level)
• Major Resistance: ₹600-₹620 (all-time high zone and round number resistance)
• Extended Resistance: ₹680-₹720 (measured move projection from triangle pattern)
Technical Pattern Recognition
Symmetrical Triangle Pattern:
• Clear triangle formation visible from the chart with converging trend lines
• Triangle spans approximately 8-10 months, indicating a significant pattern
• Breakout direction typically follows the prevailing trend (bullish in this case)
Trend Line Analysis:
• Primary uptrend line intact from 2022 lows, providing dynamic support
• Resistance trend line from 2024 highs is being challenged multiple times
• Converging trend lines creating the triangle pattern setup
Fundamental and Sectoral Backdrop:
Company Fundamentals:
• Market Cap: ₹18,852 crore (up 88.40% in 1 year)
• Revenue: ₹5,350 crore with profit of ₹941 crore (TTM)
• Business Model: Manufacture of sponge iron, ferro alloys, billet, wire-rod, and iron ore pellet through Steel, Ferro, and Power segments
• Promoter Holding: 73.16% indicating strong management confidence
• Dividend Policy: Low payout at 7.69% of profits over the last 3 years, suggesting reinvestment focus
Sectoral Outlook:
• Steel Industry: India is the world's largest steel producer with strong domestic demand
• Ferro Alloys Market: Global market projected to grow from $156.37 billion in 2024 to $204.2 billion by 2032 at 5.60% CAGR
• Indian Ferrosilicon: Market valued at $347.7 million in 2022, estimated to grow at 5.0% CAGR through 2030
• Infrastructure Push: Union Budget 2025-26 increased capital investment outlay for infrastructure by 11.1% to ₹11.2 lakh crore
Growth Lever:
• Integrated business model across the steel value chain provides operational synergies
• Strong promoter holding indicates alignment with minority shareholders
• Beneficiary of India's infrastructure development and steel demand growth
• Consolidation phase completion, suggesting readiness for the next growth phase
Key Risk Factors:
• Commodity price volatility affecting margins
• Working capital days increased from 78.1 days to 119 days, indicating efficiency concerns
• Current valuation appears overvalued by 52% compared to intrinsic value
• Global steel demand fluctuations and trade policy changes
Market Catalysts:
• Government infrastructure spending and PLI schemes
• 2025 outlook suggests potential upturn in steel producer activity with lower input costs and shifting trade policies
• Iron ore production increased by 5.5% to 135 MMT in FY 2024-25, supporting raw material availability
• Ferro Alloys industry poised to reach $188.7 billion by 2025, driven by a robust economy
Full Coverage on my Newsletter this Week
Keep in the Watchlist and DOYR.
NO RECO. For Buy/Sell.
📌Thank you for exploring my idea! I hope you found it valuable.
🙏FOLLOW for more
👍BOOST if you found it useful.
✍️COMMENT below with your views.
Meanwhile, check out my other stock ideas on the right side until this trade is activated. I would love your feedback.
As per the Latest SEBI Mandate, this isn't a Trading/Investment RECOMMENDATION nor for Educational Purposes, it is just for Informational purposes only. The chart data used is 3 Months old, as Showing Live Chart Data is not allowed according to the New SEBI Mandate.
Disclaimer: "I am not a SEBI REGISTERED RESEARCH ANALYST AND INVESTMENT ADVISER."
This analysis is intended solely for informational purposes and should not be interpreted as financial advice. It is advisable to consult a qualified financial advisor or conduct thorough research before making investment decisions.
Sardaenergy
Sarda Energy - Swing TradeNSE:SARDAEN today broke key levels with good levels, it again took support near the base where it is being accumulated and is trading in a Flat Channel which makes this a good swing to the upper edge of the Flat Channel if the Flat Channel is broken it can give a good Swing Up again so keep in watchlist and can buy again at lower level of the channel if retraced.
About:
Incorporated in 1973, NSE:SARDAEN is the flagship company of Sarda Group and is engaged in the production of steel, ferro alloys and power.
Trade Setup:
Good be a Good Typical Flat Channel Trade With RSI and MACD Trending Up with Good Volumes.
Target(Take Profit):
Short Swing towards 525 (ATH) and if Flat Channel is Broken Can Give Further Upswing.
Stop Loss:
Today's Candle Low i.e. 473 or Entry Candle Low if Trade Taken in Retracement.
📌Thank you for exploring my idea! I hope you found it valuable.
🙏FLLOW for more
👍BOOST if useful
✍️COMMENT Below your views.
Meanwhile, check out my other stock ideas on the right side until this trade is activated. I would love your feedback.
Disclaimer: "I am not SEBI REGISTERED RESEARCH ANALYST AND INVESTMENT ADVISER."
This analysis is intended solely for informational and educational purposes only and should not be interpreted as financial advice. It is advisable to consult a qualified financial advisor or conduct thorough research before making investment decisions.

Sarda Energy - Weekly EW Analysis - Long Set-upWave 4 seems over. Play for another 50% in 5 of of 3.
This is just larger wave 3. So long way to go for investors.

SARDAEN - Ichimoku Breakout📈 Stock Name - Sarda Energy & Minerals Limited
🌐 Ichimoku Cloud Setup:
1️⃣ Today's close is above the Conversion Line.
2️⃣ Future Kumo is Turning Bullish.
3️⃣ Chikou span is slanting upwards.
All these parameters are shouting BULLISH at the Current Market Price and even more bullishness anticipated AFTER crossing 301.
🚨Disclaimer: This is not a Buy or Sell recommendation. It's for educational purposes and a guiding light to learn trading in the market.
#CloudTrading
#IchimokuCloud
#IchimokuFollowers
#Ichimokuexpert
Excited about this analysis? Share your thoughts in the comments below!
👍 Like, Share, and Subscribe for daily market insights! 🚀
#StockAnalysis #MarketWatch #TradingEducation #ichimoku #midcap #smallcap #SARDAEN

Unlocking Potential: Sarda Energy's Path to Progress!Sarda Energy could advance if it revisits the 4-hour bulls order block and retracement level. Should it rebound from the 4-hour bulls order block, we may view it as a chance to consider buying.

SARDAEN| Good for Long NSE:SARDAEN
Cmp : 1106
Good Volume
Try on pullback near 1067
#Study, Learn & Earn.
Disclaimer: All the information posting on this page are for the educational purpose only, we are not SEBI registered financial advisor. We wont recommend any BUY/SELL of stocks. Contact your financial advisor before taking any action.


Swing setup for Sarda energy Watch above 830
Upside 892/930
Downside 786
Details explained on chart.
Simple analysis for learning and growing.
chart and levels only for education purpose.
Should be on watch list and execution.

Cup and handle breakout-Sarda EnergyCup and handle breakout. A new rally can start once it crosses 926 levels with good volumes. It can once retest the breakout levels. Can add small quantities near 900 levels


Sarda Energy LongSarda Energy & Minerals has an operating revenue of Rs. 2,198.82 Cr. on a trailing 12-month basis. Annual revenue growth of 18% is outstanding, Pre-tax margin of 23% is great, ROE of 16% is good. The company has a debt to equity of 67%, which is a bit higher.


SARDA ENERGYSARDAEN LOOKS GOOD ABOVE 642 STRONG TILL 1198 WEAK BELOW 528 CMP 712 (WAIT FOR PULLBACK)

Record High - Bullish Sentimentsnew 5 year high
volume support seen
close near day's high showing bullish sentiments at close
stay long till rsi daily close below 55
levels to watch at down side - 648 / 528
disclaimer - trade @ own risk

Sarda Energy Minerals - Resistance - BreakoutPositional Trade: Sarda Energy Minerals has broken out of a resistance at 553.
Buy: Sarda Energy Minerals
CMP: 568
Target: 610
Stop Loss: 541


#SARDAEN CUP & HANDLE BO#SARDAEN CUP & HANDLE BO
1. CUP & HANDLE BO
2. Accumulate between 408-398
3. CBSL 350
4. TARGETs 439, 452, 489, 501, 536, 642, 677, 720, 741+

SARDA energy & Minerals - Study - Long above 210SARDA is trading near its tight support of 205 levels, glided through ascending trendline with huge volumes.
Look for long positions above 210 for the below target.
T1 : 236
T2 : 296
T3 : 382
Stop : 185
