State Bank Of India ---- Deep Analysis________________________________________
Technical Research Report on SBI (NSE: SBIN)----------
Segment: Equity – Large Cap
Sector: Banking – PSU
Analyst: Hitesh Tailor
Date: July 29, 2025
Time Frames Analyzed: Daily Time Frame
________________________________________
1. Performance Summary--------------
State Bank of India (SBIN) is currently at a key technical levels. The stock recently showed a bearish divergence on the RSI while approaching an extreme orderblock near ₹840.60. A rejection from this level with divergence confirmation indicates potential downside towards the imbalance zone and deeper OB + FVG zones. Currently trading around ₹798.30, the bias is cautious bearish for swing traders.
________________________________________
2. Stock Profile--------------
Parameter Details
Company Name State Bank of India (SBI)
Ticker Symbol SBIN (NSE)
Sector PSU Banks
Market Cap ₹6.5+ Lakh Crores (approx.)
52 Week High/Low ₹899.65 / ₹666.30
CMP (as of July 29, 2025) ₹799.20
________________________________________
3. Chart Setup & Timeframe Analysis----------
A. Daily Timeframe
• Trend: Recent lower high and lower low structure (LL)
• Pattern: Bearish RSI divergence + rejection from Order Block (OB) zone
• Support Zone: ₹770 – ₹760 (Gap imbalance support zone)
• Resistance Zone: ₹840.60 – ₸899.65 (OB and extreme resistance)
• Price Action View: Price rejected from OB with clear bearish divergence and a breakdown below short-term structure. Weakness expected until FVG zone.
B. Weekly Timeframe
• Trend Continuity: Mixed. Long-term trend intact, but facing supply pressure near 52-week highs
• Price Relative to EMA: Trading near 200 EMA; watching for hold or breakdown
C. Intraday 1H Timeframe
• Outlook: Price showing LH-LL structure. Short-term liquidity grab may occur before downside continuation.
________________________________________
4. Technical Indicators-----------------
Indicator Observation
Moving Averages Price below 20 EMA but above 200 EMA – Neutral to Bearish
RSI (14) ~42 with bearish divergence (daily)
MACD -- Not analyzed
Volume -- Not Analyzed
Bollinger Bands -- Not Analyzed
________________________________________
5. Key Technical Levels------------
Type Price (₹)
Immediate Support 770.00
Major Support 700.00 (OB + FVG)
Resistance 1 840.60
Resistance 2 899.65
CMP 798.30
________________________________________
6. Trade Idea / Recommendation-------------
Swing Sell Setup (1–2 Weeks)
• Sell Zone: ₹800 – ₹820
• Target 1: ₹770.00
• Target 2: ₹700.00
• Stop Loss: ₹845.00
• Risk-Reward Ratio: Approx. 1:2.5
Bias: Bearish below ₹820. Reversal confirmation only above ₹840.60.
________________________________________
7. Risk Factors------------
• Positive PSU bank sector news or surprise earnings could invalidate downside
• Global risk-on events may cause aggressive short-covering
• RBI interventions or policy rate changes
________________________________________
8. Conclusion------------
SBI appears technically weak after facing rejection from a strong supply zone marked by an extreme orderblock and bearish RSI divergence. Price is below short-term EMAs and breaking structure levels, pointing towards downside potential. Traders can consider short trades with a strict stop loss and monitor price behavior near imbalance and FVG zones.
________________________________________
Disclaimer: This Technical Research Report is made for Educational Purpose Only. Do not consider it as any Investment idea. I'm not SEBI Registered Research Analyst. Consult your Registered Financial Advisor Before Investment.
-------------------------------------------------------------------------------------------------------------------
Your Views or Comments are Most Welcome.
Hit like if you find these insights helpful.
-------------------------------------------------------------------------------------------------------------------
Regards,
Hit_Analyst
SBI

Master Institutional TradingInstitutional trading refers to the buying and selling of financial assets—stocks, bonds, derivatives, commodities, currencies—by organizations that invest large sums of money. These trades are typically large in volume and value and are executed through private negotiations or electronic networks designed for block trading.
Key Characteristics:
High volume orders
Priority on stealth execution
Access to premium data
Quantitative modeling
Advanced algorithms

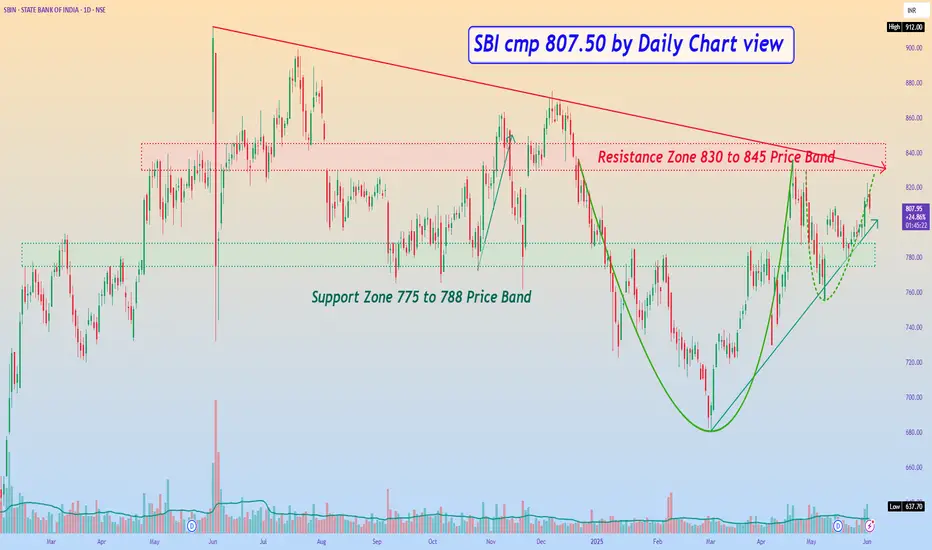
SBI cmp 807.50 by Daily Chart viewSBI cmp 807.50 by Daily Chart view
- Support Zone 775 to 788 Price Band
- Resistance Zone 830 to 845 Price Band
- Support Zone tested retested for probable upside move
- Back to Back Bullish Rounding Bottoms by Resistance Zone neckline
- *IF ..... Price takes breakout by Volumes increase support and sustain closure above Resistance Zone, fresh upside is anticipated*
State Bank of India - Breakout OpportunityDate : 5-Dec-2024
LTP : Rs. 865.45
Targets: (T1) Rs. 912 --> (T2) Rs. 1,023
SL : Rs. 765
Technical View:
• NSE:SBIN is in primary uptrend and was recently going through it's secondary downtrend within primary uptrend.
• After touching the high of 912 on 3-Jun-2024, it has retraced 16% to 761.55 level.
• NSE:SBIN has breakout from it's secondary downtrend with high volume on 5-Dec-2024.
• NSE:SBIN is trading above 20 DEMA and 50 DEMA since last few sessions. 20 DEMA is also trading above 50 DEMA.
• RSI is in buy zone and trading at 62.74. MACD is bullish and trading at 10.63.
• Both RSI and MACD are showing positive divergence, indicating trend reversal.
• Looking good to start a new swing from here.
Liked the analysis? Boost/Like this idea and follow my ID.
Disclaimer: I am not a SEBI registered analyst/consultant and not recommending anyone to take any BUY or SELL position in stock market. Investing in stock market is risky and one should do a self analysis and validation before investing in stock market. My ideas are published for learning purpose only and are available to everyone at no cost/charge.

SBI cmp 847.65 by Daily Chart viewSBI cmp 847.65 by Daily Chart view
- Support Zone 834 to 841 Price Band
- Support at 814 > 781 > 751 with Resistance at 868 > 883 > ATH 912
- Stock Price is testing and Retesting the Support Zone over the past week
- Volumes seem steady showing intermittent spikes by demand based buying

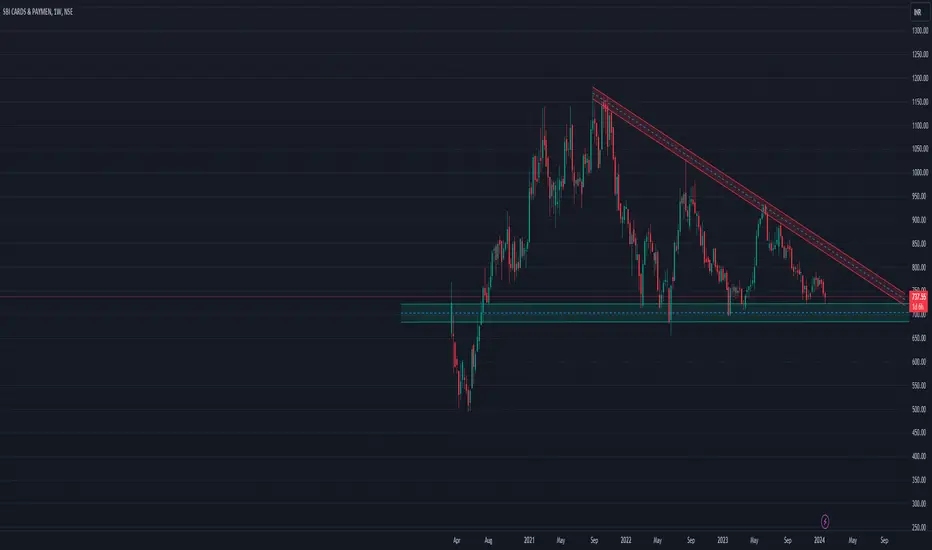
SBI CARD#SBICARD
stock holds abv the resistance
looking good for buying
weak below 690
upside targets 715-730

UPL in BUYHi Everyone...
In UPL we got W pattern with CHOCH confirmation but still is Sell channel
Risky traders entry the buy @502-486-455
SL 446
Safe traders wait for breakup....follow the chart drawing and enter the retracement @432
SL 446
Both TPS WILL BE
529-604-700-750-800-850-1250

SBI Bank Channel Breakout and Bullish Flag PatternDetails:
Asset: State Bank of India (SBI)
Pattern: Channel breakout and Bullish Flag
Breakout Level: Above 800
Potential Targets: Projection based on channel width or flagpole height, or next significant resistance levels
Stop Loss: Below breakout level or as per risk tolerance
Timeframe: Medium to long-term
Rationale: State Bank of India (SBI) is exhibiting a channel breakout above the 800 level, indicating a potential shift in sentiment. Additionally, the price action resembles a bullish flag pattern, characterized by a sharp upward move (flagpole) followed by a period of consolidation in the shape of a flag. The breakout above 800 suggests the possibility of a significant upmove, considering the bullish pattern formation.
Possibilities:
Bullish Momentum: The channel breakout and bullish flag pattern suggest the presence of bullish momentum in SBI.
Projection Targets: Potential upside targets can be estimated by measuring the width of the channel or the height of the flagpole and extrapolating it from the breakout point.
Confirmation: Confirmation of the breakout and pattern validity with sustained trading volume would provide further conviction for the bullish scenario.
Risk-Reward Ratio: Depends on individual risk appetite and stop-loss placement.
As always, it's important to conduct thorough analysis and consider risk management strategies before initiating any trades or investments.

GOLD IN CORRECTIONHi everyone...
Right now market touches our 1st Weekly PULL BACK zone which is 2357-2477 zone
We got Day High(using MY HIGH find method)-correction sell 80% confirms
In 4hrs the market got bounce on small buy zone which is 2335-2320
Also we got 15min low(using MY LOW find method)-trend continues
but doesn't get CHOCH(doesn't cross 2319) confirmation in 15Mins and 4Hrs
Careful with sell
And mainly in Monthly time frame previously we got H&S
so Head and Shoulder full target is 2527
Monthly 1st back zone we Got here which is 2462-2689
Here is the Result
1st Analysis
Buy@2344.3-2336
SL@2330(or use buy limit SL)
TP 2346
TP 2352
TP 2364
TP 2388
TP 2430
TP 2520
Buy limit@2329-2323
SL@2319
TP 2331
TP 2345
TP 2352
TP 2364
TP 2388
TP 2430
TP 2520
2nd Analysis
Sell limit@2388-2395(we need a confirmation before enter this)
SL@2397
TP 2386
TP 2380
TP 2300
TP 2278
TP 2167
TP 2050
TP 1973
Sell limit@2426-2428(EXTREME SELL zone BUT BE CARE FULL WE DOSENT GET 15M & 4h CHOCH)
SL@2432
TP 2424
TP 2400
TP 2380
TP 2300
TP 2278
TP 2167
TP 2050
TP 1973
USE RISK MANAGEMENT
SAFE TRADER ONLY TAKE 3 TO 5 TRGT BASED ON YOUR EQUITY BUT 1ST TP MUST
AFETR HIT 1ST TP MUST SET BE(Break Event)
==Use stop order -.5 pips from SL(if you ok)
stop order needs high equity==
NOTES:EDUCATIONAL PURPOSE ONLY

Bullish on Sbi Card Any one who wants to invest in credit card companies can go with sbi card as you see in chart that this share has starts fall from jun 2023 and now almost in ends .
this is trading bet as well as long term for 1 year . . .
this share forms a pattern of falling wedge so accurate
Discalimer:- i am not sebi registered all loss as well as profit both is solely yours . i am not responsbile for any kind of loss or profit solely you are respobile for that .

GOLD IN BUYGOLD/USD March FINAL WEEK PLAN...
In GOLD-USD Friday (22-03-2024) Market reaches our 2nd sell target of 2160...
Which is buy correction zone(BUY FLIP ZONE)...
EXTREM BUY ZONE IS still there 2152-2146
I am looking for buy because of below mentioned points:
1.Before reaching 2160 market forms buy liquidity(BUYING PATTERN) in FAIR GAP Area
2.In 30M Awesome Oscillator indicates upside distribution even market comes down...
3.In 15M-50% Buy confirmation we got...
4.In DAY TF i am expecting 2258-2300 is 1st Pull back zone(only my opinion not confirms yet)
Here we got 3 entry zones with 3 different entry method...
1.Intraday Setup-- use 1% RISK of your capital in every entry
we have 3 intraday setup
(_a_).15M Gives only 50% confirmation for BUY REWARD---1:20 Ratio
BUY limit @2160
SL 2156
TP 2185
TP 2206
TP 2211
(_b_).5M mid range entry(if confirms get we will updates here then entry this)BUY
REWARD--1:22 Ratio
BUY limit @2153
SL 2149.4
TP 2185
TP 2206
TP 2211
(_c_).30M Extreme entry zone previous BUY LIQUIDITY zone...
Also PULL BACK AREA...In 2146 is trend line passing point...
you can place order without confirmation... REWARD--1:24 Ratio
BUY limit @2149
SL 2144
TP 2185
TP 2206
TP 2211
2.Mid Risk Setup-- use 4to5% RISK of your capital.... REWARD--1:8-1:10 Ratio
USE 2 Layers 5 Orders Strategy
BUY LIMIT @2153-2149
SL 2144
TP 2185
TP 2206
TP 2221
Once Market HIT 2149...SET 2153 as a Target BE(close @entry)
3.Swing setup-- Need higher capital.... REWARD--1:7-1:8-1:10 Ratio
USE 3 Layers 5 Orders Strategy
BUY LIMIT @2160-2153-2149
SL 2144
TP 2185
TP 2206
TP 2221
TP 2270
Once Market HIT 2149...SET 2160 as a Target BE(close @entry)
IF MARKET TREND CHANGE... OVER ALL SELL STOP 2143..use x2 lot size which total lot size you use in above buy limit orders ( Targets & SL will updates later)
or
Don't use sell stop wait for next recovery update...
All The Best...
NOTES:EDUCATION PURPOSE ONLY

follow pattern and make quick profits in SBISBI cards caught up in a pattern from very long. grab the chance and make instant profits for around 830.


SBI card trading close to a support zoneSBI Card is trading very close to a support zone on weekly charts. What do you think? We will see a reversal from here or a breakdown?
Note : For educational and informational purpose only. We do not provide any buy or sell recommendations as we are not a SEBI registered Research Analyst .
sbi breaked the trendline it will be down for a weeksbin breaks this weaks stong trendline its falls a lot and gives a good target hunting oppurtinity
its clearly showing

Weak below supportSBIN is looking weak below the support levels as it has formed the head and shoulder pattern on the top and Indian financial banks like HDFC banks are also under pressure ....

SBI rr tradeSbi can climb up from here if holds 586.. cn buy in range oof 586-589 with 582 as stop loss for 600 620 targets.. Only taking trade for high risk reward


State Bank of India ( Neowave Forecast)Hi Everyone
This is our final chart of SBI which consist 10 percentage weightage of Bank NIfty. Already posted HDFC bank and ICICI bank (both consist 60 percentage weightage)
With this you will have proper understanding of current and future directions of banknifty. I will update further when the times come, till than happy hunting.
Thank You.

BUY WHIRLPOOL OF INDIATargets are mentioned in the chart. But for long term investing. Company financials looks good. Profit down during Covid period, now gets increasing. Coffee can stock.


SBIN TO ALL TIME HIGHS AGAIN?NSE:SBIN SBIN is showing bullish reversal sign and can achieve 560 level zone easily in coming weeks with buy on deeps strategy (only in new high new low formation) .
current resistance for sbin is at 533/532 zone, above that 540 /538 is the next resistance zone,
best entry will be when sbin hits 540/538 res zone and retests previous resitance of 433/532 and makes it a new support, sl should be be 510 as current support zone is at 521/517 from which sbin can carry on the upside trend move.
