SBI BANK |Neowave AnalysisNamaskaram Everyone
I trade using Neowave and on that I have created an trading setup, which is kind of automatic entry and exit with Neowave.
Neowave is kind of a method in which you synchronize all the price action across all the time frames. It hides all the noise and tells you market is bullish or bearish.
About Stock
This is not a trading idea, it would have been if updated few weeks back. Just a neowave counts update for some one who is already holding the stock.
Stock already started its rally in correction, if you get some retracement than buy it.
For coding style read the below post
If you have the stock than hold it and trail it as the counts proceed in future.
Like and share is appreciated.
Thank You
To understand how our coding works read the below post-
NSE:SBIN
Sbibank

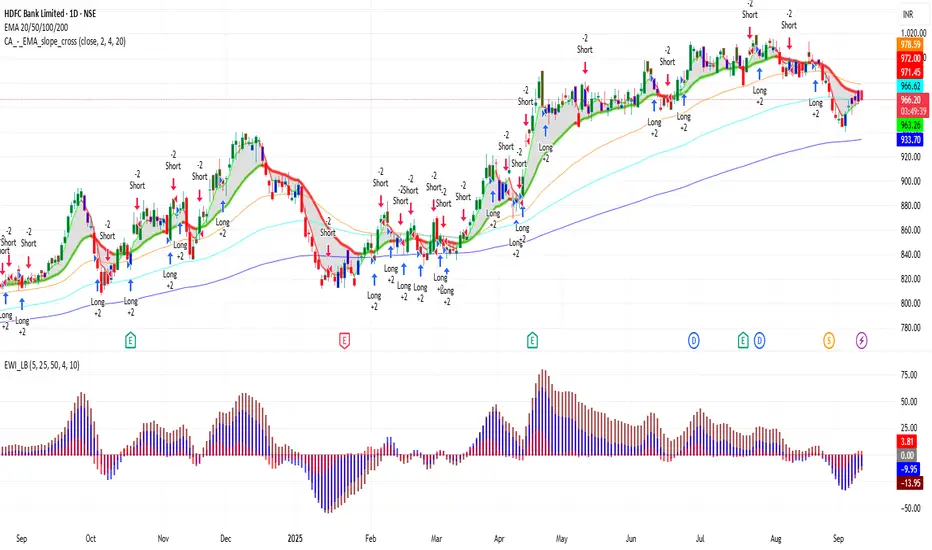
HDFCBANK 1D Time frame📍 HDFCBANK – 1D Important Levels (Current)
🔹 Support Zones
1,570 – 1,580 → Immediate daily support
1,530 – 1,550 → Strong support; buyers likely to defend this zone
1,480 – 1,500 → Major support; breakdown may shift trend bearish
🔹 Resistance Zones
1,620 – 1,630 → Immediate daily resistance
1,660 – 1,680 → Strong resistance zone
1,720 – 1,740 → Major resistance; breakout here may trigger a bigger rally
⚖️ Daily Trend Outlook
HDFC Bank is currently in a sideways-to-bullish phase on the daily chart.
As long as price holds above 1,570, momentum can stay positive.
A breakout above 1,630 – 1,680 may extend upside towards 1,720 – 1,740.
A breakdown below 1,570 could drag it back to 1,530 – 1,500.
Options Trading Strategies📌 What Are Options in Trading?
Before we get into strategies, let’s understand what options actually are.
In the simplest form, options are contracts that give a trader the right, but not the obligation, to buy or sell an asset (like a stock, index, or commodity) at a specific price before or on a specific date.
There are two main types of options:
Call Option – Gives you the right to buy something at a set price.
Put Option – Gives you the right to sell something at a set price.
These tools can be used to hedge, speculate, or generate income. Now that you know what options are, let’s go deeper into strategies.
🎯 Why Use Options Strategies?
Options trading is not just about buying Calls and Puts randomly. It’s about smart combinations and planned risk management. With the right strategies, you can:
Profit in up, down, or sideways markets
Limit your losses
Leverage small capital
Hedge your stock or portfolio
Earn regular income
Let’s now dive into some popular options trading strategies—from basic to advanced—with examples.
✅ 1. Covered Call Strategy
💡 Use When: You own a stock and expect neutral or slightly bullish movement.
You own shares of a stock and you sell a Call Option on the same stock. You receive a premium from selling the Call, which gives you extra income even if the stock doesn’t move.
📘 Example:
You own 100 shares of Reliance at ₹2800. You sell a 2900 Call Option and receive ₹30 per share as premium.
If Reliance stays below ₹2900 – You keep your stock and the premium.
If Reliance goes above ₹2900 – Your stock gets sold (you deliver), but you still profit from stock rise + premium.
✅ Pros:
Earn extra income
Lower risk than buying naked calls
❌ Cons:
Limited upside
Need to own stock
✅ 2. Protective Put Strategy
💡 Use When: You own a stock but want to protect from downside risk.
Here, you buy a Put Option along with owning the stock. It acts like insurance – if the stock crashes, the Put will rise in value.
📘 Example:
You buy HDFC Bank shares at ₹1700 and buy a 1650 Put Option for ₹25.
If HDFC drops to ₹1600 – Your stock loses ₹100, but your Put may gain ₹50–₹75.
If HDFC goes up – You lose only the premium ₹25.
✅ Pros:
Protects your portfolio
Peace of mind in volatile markets
❌ Cons:
You pay a premium (like insurance)
Can eat into profits
✅ 3. Bull Call Spread
💡 Use When: You are moderately bullish on a stock.
You buy a Call Option at a lower strike and sell another Call Option at a higher strike (same expiry). This reduces your cost and risk.
📘 Example:
Buy Nifty 22500 Call at ₹100
Sell Nifty 23000 Call at ₹50
Your net cost = ₹50
Max profit = ₹500 (if Nifty ends above 23000)
✅ Pros:
Lower cost than naked Call
Defined risk and reward
❌ Cons:
Limited profit potential
✅ 4. Bear Put Spread
💡 Use When: You are moderately bearish.
You buy a Put at higher strike and sell another Put at lower strike. This is just like Bull Call, but for falling markets.
📘 Example:
Buy Bank Nifty 50000 Put at ₹120
Sell 49500 Put at ₹60
Net Cost = ₹60
Max Profit = ₹500
✅ Pros:
Risk-managed way to profit in downtrend
❌ Cons:
Limited profits if market crashes heavily
✅ 5. Iron Condor
💡 Use When: You expect the market to stay sideways or within a range.
It’s a neutral strategy involving four options:
Sell 1 lower Put, Buy 1 far lower Put
Sell 1 upper Call, Buy 1 far upper Call
📘 Example:
Sell 22500 Put
Buy 22200 Put
Sell 23000 Call
Buy 23300 Call
You receive a net premium. If the index stays between 22500–23000, you make full profit.
✅ Pros:
Profits in range-bound market
Low risk, fixed reward
❌ Cons:
Requires margin
Complicated setup
✅ 6. Straddle Strategy
💡 Use When: You expect a big move in either direction, but not sure which.
Buy both a Call and a Put at the same strike price and expiry. One side will definitely move.
📘 Example:
Buy Nifty 23000 Call at ₹80
Buy Nifty 23000 Put at ₹90
Total cost = ₹170
If Nifty makes a big move (up or down), one side can explode in value.
✅ Pros:
Unlimited potential if market breaks out
Great for news events
❌ Cons:
Expensive to enter
Needs big movement to profit
✅ 7. Strangle Strategy
💡 Use When: You expect a big move, but want to reduce cost compared to straddle.
Buy an Out-of-the-Money Call and Put.
📘 Example:
Buy Nifty 23200 Call at ₹40
Buy Nifty 22800 Put at ₹50
Total cost = ₹90
You still profit from big movement, but cheaper than a straddle.
✅ Pros:
Lower cost
Profits from big moves
❌ Cons:
Requires even larger movement than straddle
✅ 8. Short Straddle (for experts)
💡 Use When: You think the market will stay flat (low volatility).
Sell a Call and a Put at the same strike. You earn double premium.
⚠️ Risk: Unlimited risk if market moves too much!
This strategy is not for beginners. You need tight stop losses or hedges.
🔐 Risk Management Is Key
No matter which strategy you use:
Always define your maximum risk and reward.
Avoid taking naked positions without hedging.
Use stop losses and trailing SLs.
Don’t bet your whole capital – use position sizing.
Avoid trading right before major events unless you understand the risks.
Strangle
🤔 Real-Life Example (Simple Breakdown)
Let’s say the market is range-bound and Nifty is stuck between 22500–23000 for weeks. You can go with an Iron Condor:
Sell 22500 Put at ₹80
Buy 22200 Put at ₹40
Sell 23000 Call at ₹70
Buy 23300 Call at ₹35
Net Premium = ₹75
If Nifty expires between 22500–23000, you get full ₹75 profit per lot. If it breaks the range, losses are capped due to hedges.
💬 Final Thoughts
Options trading strategies are like different weapons in your trading arsenal. But using them without understanding or discipline is dangerous. Always know:
What is your market view?
What is your max risk?
How will you manage losses?
The smartest traders don’t gamble—they plan. They treat options like a business, not a lottery ticket.
So whether you’re trading with ₹5000 or ₹5 lakhs, always use a strategy with:
✔ Proper Risk-Reward
✔ Defined Exit Plan
✔ Strong Logic (not emotion)
Learn Advanced Institutional Trading🏛️ Learn Advanced Institutional Trading
Step into the world of professional-level trading and master how institutions control the markets.
This advanced level dives deep into:
Market Structure Mastery – Spot trends, breakouts & manipulation zones
Smart Money Tactics – Learn how big players accumulate & distribute silently
Volume & Liquidity Zones – Trade where institutions trade
Precision-Based Entries – No noise, just logic
Risk Management Systems – Protect capital like a pro
Avoid Retail Traps – Outsmart fakeouts, stop hunts & emotional trades
Whether you're trading options, futures, or intraday levels—this training gives you the edge to follow the real money and make consistent, calculated moves.
📌 Upgrade your strategy. Trade with purpose. Win like institutions.

Institutional Intraday option Trading🏛️ Institutional Intraday Option Trading
Trade like the big players — with speed, strategy, and smart money precision.
This is high-level intraday options trading the way institutions do it — not with guesswork, but with structure, volume, and calculated risk.
🔥 What You’ll Learn:
Smart Money Concepts – Recognize institutional footprints & price manipulation
Intraday Market Structure – Breakouts, fakeouts, traps & liquidity zones
High-Volume Option Levels – Trade where institutions act
Scalp-to-Swing Entries – Fast setups with defined risk
Tight Risk Management – Stop loss placement like a pro
Time & Premium Decay Tactics – Trade with Theta on your side
💼 Perfect For:
✅ Intraday Option Traders
✅ Scalpers & Index Traders (Nifty/BankNifty )
✅ Anyone ready to follow the real momentum
📌 Fast markets need smart strategies.
Learn to dominate intraday moves with institutional logic.

Options Trading vs Stock Trading👋 Introduction
If you've ever stepped into the world of the stock market, chances are you've heard about both stock trading and options trading. While they both exist under the umbrella of equity markets, they are fundamentally different beasts.
Imagine stock trading like buying a house — you own the asset. In contrast, options trading is like paying a small amount to rent the house with the option to buy it later — you get access, flexibility, and leverage, but also more complexity and risk.
In this guide, we’ll break it down in simple language, so you can understand:
What each involves
How they work
Risks vs rewards
Which one suits your trading style
📌 1. What Is Stock Trading?
Stock trading involves buying and selling shares of publicly listed companies on the stock exchange.
Example:
You buy 10 shares of TCS at ₹3,500, totaling ₹35,000. If the price rises to ₹3,800, and you sell, you make a ₹3,000 profit.
Key features:
Ownership: You become a partial owner of the company
No expiry: You can hold stocks forever
Dividends: You may earn income from dividends
Capital appreciation: Profit is made when price rises
Lower complexity: Ideal for beginners
📌 2. What Is Options Trading?
Options trading involves buying and selling contracts (not shares directly), that give you the right (but not the obligation) to buy or sell a stock at a specific price before a set date.
There are two main types of options:
Call Option: Betting that the price will go up
Put Option: Betting that the price will go down
Each contract typically covers 1 lot (e.g., 25 shares) of a stock or index.
Example:
You buy a Reliance 2800 Call Option for ₹50, and each lot = 250 shares. Your total cost = ₹12,500. If Reliance goes above ₹2800 and the premium rises to ₹100, you earn ₹12,500 profit.
Key features:
Leverage: Small capital, large exposure
Limited time: All options have expiry dates (weekly/monthly)
No ownership: You control a right, not the actual stock
Higher risk: Gains can be huge, losses can be total
Advanced strategy: Better for experienced traders
💥 3. Risk-Reward Trade-off
Stock Trading:
Lower volatility: Stock prices move gradually
Better for long-term wealth
Risk is limited to the price going down, but you still own the stock
Options Trading:
High leverage = high reward, high risk
Option premiums can decay rapidly due to time decay (theta)
Entire premium can become zero at expiry
Can be used for hedging or speculation
🧮 4. Margin & Capital Requirements
Stock Trading:
You pay the entire value of the stock upfront (unless using margin facilities)
Brokers may offer 5x margin for intraday, but that’s separate
Options Trading:
Option buyers pay only the premium
Option sellers (writers) require huge margin due to unlimited loss potential
Can start with as low as ₹500–₹5,000 per trade
🧠 5. Who Should Trade What?
You Are Prefer Stock Trading Prefer Options Trading
Beginner ✅ Yes ❌ No (unless trained)
Short-term trader ✅ Yes ✅ Yes
Investor ✅ Yes ❌ Not ideal
Hedger ❌ No ✅ Yes
Speculator ❌ Less ideal ✅ Perfect
🔁 8. Time Decay – The Invisible Killer in Options
One key concept in options is time decay (theta). As expiry nears, the premium loses value even if the stock doesn’t fall.
If you're long in options and your view is wrong or delayed, your option can become worthless.
Stock trading has no such concept — the price remains based on fundamentals and demand-supply.
🧮 6. Strategies Comparison
📈 Stock Trading:
Buy and Hold
Swing Trading
Intraday
🧩 Options Trading:
Buy Call / Buy Put (directional)
Sell Options (income)
Straddle / Strangle (neutral)
Iron Condor / Butterfly (advanced)
🧭 7. Regulatory Perspective
SEBI has increased margin requirements for option sellers due to high risk.
Recent data shows that:
90%+ retail option buyers lose money
85%+ option sellers make money, but require capital and strategy
Stock traders lose less on average, but make smaller % gains
💬 8. Psychological Factor
Stock trading is slower and requires patience
Options trading is fast, intense, and emotional — often leading to impulse trading
You must develop:
Strong discipline
Risk management
Understanding of Greeks (for options)
📚 9. Learning Curve
Area Difficulty (1 to 10)
Stock Trading 3–5
Options Trading 7–9
Options involve:
Understanding of strike prices, expiry, premium, Greeks (delta, theta, vega, gamma)
Quick decision-making under pressure
Multiple possibilities with the same price movement
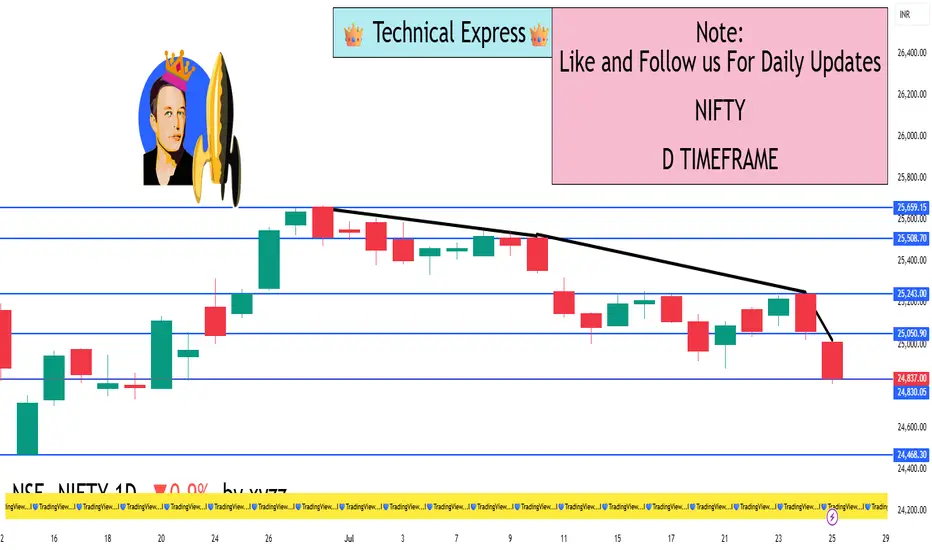
NIFTY 1D TimeframeClosing Price: 24,837.00
Net Change: −225.10 points (−0.90%)
Opening: 24,981.35
High: 25,008.90
Low: 24,770.85
Trend: Bearish
📊 Technical Overview
✅ Candle Type:
Bearish candle formed with a long body and small wicks.
Indicates strong selling pressure throughout the day.
🔻 Support Zones:
24,750 – Immediate support (tested on 25 July)
24,600 – Stronger support zone
24,400 – Medium-term support from early July
🔺 Resistance Zones:
24,900 – Immediate resistance
25,000 – Psychological resistance
25,150–25,300 – Strong resistance zone
📈 Indicators Summary:
RSI: Likely near 45 – showing weakening momentum
MACD: Bearish crossover continues – indicating downward trend
Volume: Slightly higher than average – confirms active selling
🧠 Market Sentiment:
Sentiment remains cautious and bearish.
Selling seen in major sectors like Auto, Energy, FMCG, and Banking.
Only Pharma showed relative strength.
Global cues and foreign investor selling weighed on market sentiment.
This marks the fourth straight weekly loss for the Nifty index.
✅ Conclusion:
Nifty is in a short-term downtrend, unable to sustain above 25,000.
If 24,750 is broken decisively, the next target could be 24,600 or lower.
Bulls must reclaim and hold above 25,000–25,150 to reverse the sentiment.
Institutional Option Trading🏛️ Institutional Option Trading
Institutional Option Trading refers to how large financial institutions like hedge funds 📊, investment banks 🏦, insurance firms 🧾, and asset managers 💼 use options contracts strategically to hedge risks, generate income, or make large, leveraged bets with controlled risk.
These institutions trade options using:
🧠 Advanced analytics & algorithms
📉 Volatility-based strategies (like straddles, condors, and spreads)
📊 Risk-neutral positioning using Greeks (Delta, Vega, Theta, etc.)
🛡️ Portfolio hedging & macroeconomic plays
💼 Multi-million dollar contracts with custom structures
Their trading is not based on emotions, but on probabilities, risk-reward analysis, and long-term objectives.
📌 In simple words:
Institutional Option Trading is how big players use options smartly to manage risk and extract value — with precision, scale, and professional tools. 💼⚙️📈

Master Institutional Trading🔷 What is “Master Institutional Trading”?
Master Institutional Trading refers to mastering the art and science of how big players (institutions) operate in the financial markets—especially in equities, derivatives, and futures. This includes understanding how they think, trade, manage risk, and move money.
Institutions include:
Hedge Funds
Mutual Funds
Foreign Institutional Investors (FIIs)
Domestic Institutional Investors (DIIs)
Proprietary Trading Desks
Investment Banks
These players account for over 80% of the market volume, so understanding how they trade is crucial if you want to trade profitably. Mastering institutional trading means not following retail patterns or lagging indicators—it means learning how to track smart money and align your trades with theirs.
🔶 Why is Mastering Institutional Trading Important?
Most retail traders:
Trade based on tips or indicators
Use small capital with high risk
Get trapped by smart money moves (fake breakouts, stop loss hunts)
Lose because they don’t understand the real forces behind price movement
But once you learn institutional trading:
✅ You stop chasing trades
✅ You avoid retail traps
✅ You begin to trade with the trend and understand liquidity behavior
✅ You align your entries with where institutions enter/exit
This is the difference between being a random trader and a skilled, consistently profitable trader.
🔷 Key Institutional Trading Concepts You Must Master
📊 1. Market Structure (Not Just Candles)
Institutions don’t rely on RSI or MACD. They follow market structure, which includes:
Higher Highs & Higher Lows (uptrend)
Lower Highs & Lower Lows (downtrend)
Range & Consolidation Zones
Break of Structure (BOS) – signals direction shift
Change of Character (ChoCH) – where market flips direction
They wait for market structure to align before placing trades. If you don’t understand structure, you’re trading blind.
🔍 2. Liquidity & Smart Money Concepts (SMC)
Institutions need liquidity to place massive orders. But liquidity is created through:
✅ Retail Stop-Loss Orders
✅ Fake Breakouts
✅ News-Based FOMO entries
Institutions purposely trigger these levels to enter or exit quietly.
Key smart money concepts:
Order Blocks – where institutions enter bulk orders
Liquidity Pools – areas where retail stop-losses sit
Imbalance / Fair Value Gaps (FVG) – price moves too fast, returns later
Mitigation Blocks – previous institutional entries revisited
🎯 Learn these areas to enter with institutions, not against them.
📈 3. Volume & Order Flow Analysis
Institutions move in and out using volume. Retail traders don’t understand volume deeply.
Mastering institutional trading means tracking:
Volume Spikes near key zones
Footprint Charts (Volume per candle)
Delta Volume (Buy vs Sell pressure)
Also important: Volume Profile—it shows where the most trading happened, and that’s often where institutions are active.
⚖️ 5. Risk Management Like Institutions
Institutions don’t risk their capital blindly. They:
✅ Use fixed % risk per trade (like 0.5% or 1%)
✅ Use multi-layer hedging techniques
✅ Track correlation between sectors
✅ Don’t overtrade—they wait for high-probability setups
You need to build the same habit:
Never risk more than 1–2% per trade
Define entry, stop loss, target clearly
Avoid overleveraging, especially in options
📉 6. Institutional Options & Derivatives Tactics
Institutions use options for:
Hedging large equity positions
Generating income (selling options)
Directional bets with limited risk
Creating synthetic long/short positions
You’ll learn:
Open Interest Analysis
Option Greeks (Delta, Theta, Gamma, Vega)
Institutional options setups (Short Straddle, Ratio Spread)
Volume-OI Divergence (when data doesn't match the price)
These help you follow institutional footprints in options chain.
📚 7. Economic and Macro Analysis
Institutions also look at:
Interest rates (RBI/FED policies)
Inflation, GDP, Unemployment data
Sector rotation based on economic trends
Mastering institutional trading means learning macro context to know:
Which sectors will rise/fall
Which events move volatility
How FIIs/DIIs flow capital across sectors
🔧 8. Tools Used in Institutional Trading
You won’t find institutions using free websites for trading.
They use:
Bloomberg Terminal / Reuters
Institutional platforms like MetaStock, CQG, NinjaTrader
Order Flow Tools (e.g., Bookmap, Sierra Chart)
Algo + Automation Tools
High-speed execution setups
Retail traders can still mimic them using:
TradingView + Volume Profile tools
Option Analytics tools (Sensibull, Opstra)
Volume/Delta-based indicators
📅 9. Intraday vs Positional – Institutional Styles
Institutions use both styles:
✅ Intraday:
High-frequency strategies
Scalping based on liquidity
Options intraday decay selling
✅ Positional:
Sector rotation plays
Accumulation of stocks over weeks/months
Event-driven strategies (earnings, budget, rate hikes)
You need to choose what style suits your capital, time, and personality.
👣 10. Following Institutional Footprints
You can track them through:
🟩 Bulk Deal & Block Deal Data (NSE site)
🟩 FIIs & DIIs Buying/Selling Activity
🟩 Option Chain + OI shifts
🟩 Price rejection from key supply-demand levels
🟩 Volume spikes with no news
🎯 These are the breadcrumbs smart money leaves behind.
🎓 How to Master Institutional Trading – Step-by-Step Roadmap
Step 1: Master Market Structure
Learn BOS, CHoCH, HH-LL analysis
Study smart money patterns
Step 2: Study Order Blocks & Liquidity Zones
Mark order blocks, gaps, imbalance zones
Use TradingView to practice
Step 3: Learn Volume + OI Analysis
Understand OI buildup, unwinding
Track volume spikes, exhaustion points
Step 4: Study Options Data
Learn options chain interpretation
Practice on Bank Nifty/Nifty with OI analysis
Step 5: Develop Strategy
Build high RRR strategies (minimum 1:2)
Include entry, stop loss, target rules
Step 6: Practice With Real Charts
Use market replay tools
Analyze previous days—“what did institutions do?”
Step 7: Journal Everything
Log trades, reasons, emotions, outcomes
Focus on learning, not just profit
📌 Final Thoughts
Mastering Institutional Trading isn’t about learning 100 strategies.
It’s about learning:
How markets actually move
Why smart money creates traps
How to follow institutional zones
How to manage risk like a professional
You’ll no longer be confused by breakouts or false news.
You’ll start seeing behind the candles—where the real action is happening.

Institutional Objectives in Options Trading🔷 What Are Institutions in the Market?
Before diving into their objectives, let’s first understand who institutions are:
Institutions are large, professional organizations that trade in the financial markets using massive amounts of capital. These include:
Mutual Funds
Hedge Funds
Pension Funds
Insurance Companies
Investment Banks
FIIs (Foreign Institutional Investors)
Proprietary Trading Firms
These players account for over 80-90% of daily turnover in options markets like NSE’s Bank Nifty and Nifty. Unlike retail traders, they don’t trade emotionally or randomly. Every move they make has a calculated reason behind it.
🎯 Why Do Institutions Use Options?
Options are powerful tools. Institutions don’t just trade them for direction; they use options to achieve multiple objectives:
✅ 1. Hedging Portfolios
🔍 Objective:
To protect their large equity/futures holdings from adverse market movements.
Institutions have huge long-term positions in stocks or indices. If the market falls sharply, these positions can suffer big losses. So, they use PUT options to hedge.
📈 Example:
A pension fund holds ₹500 crore worth of Nifty 50 stocks.
It buys Nifty 50 PUT Options at 22,000 strike.
If market crashes, the loss in stocks is offset by profit in PUTs.
📌 Result: Limited downside, peace of mind, capital protection.
✅ 2. Generating Additional Income (Option Writing)
🔍 Objective:
To generate consistent income from existing holdings through Covered Calls, Cash-secured Puts, or Iron Condors.
Institutions write options (sell) to earn premium—especially in sideways markets.
💡 Examples:
Covered Call: Own Reliance shares + Sell OTM Call option to earn income.
Short Strangles: Sell far OTM Put and Call if volatility is high.
Iron Condor: Sell call/put spreads to profit from time decay.
📌 Result: Generates passive income with controlled risk.
✅ 3. Arbitrage and Spread Trading
🔍 Objective:
To lock in risk-free or low-risk profits through price inefficiencies.
Institutions use Calendar Spreads, Box Spreads, or Volatility Arbitrage to exploit inefficiencies in option pricing.
🔧 Example:
Calendar Spread: Buy Nifty 22500 CE in August, sell Nifty 22500 CE in July.
Profit from IV differences or time decay.
📌 Result: Non-directional trading, but consistent profits with high capital.
✅ 4. Taking Directional Bets With Defined Risk
🔍 Objective:
To take high-conviction trades without exposing entire capital like futures.
Institutions use Debit Spreads, Straddles, or Long Options for directional views with limited risk.
💡 Example:
If expecting a bullish breakout, they might:
Buy 22000 CE
Sell 22200 CE
It caps both risk and profit. Perfect for risk-managed directional exposure.
📌 Result: Risk-defined entry into market trends without using futures.
✅ 5. Volatility Trading (Not Price Trading)
Institutions often trade volatility, not just price direction. They use Straddles, Strangles, Calendar Spreads to play IV.
💡 Example:
If implied volatility is low and an event is coming (like RBI policy):
Buy Straddle (ATM Call + Put)
Expect IV spike or a big move
📌 Result: Profit from volatility expansion or collapse, even if price stays in a range.
✅ 6. Managing Fund Exposure / Risk Neutralizing
Large funds have multiple exposures—options help them balance and adjust their overall risk (Delta-neutral, Vega-neutral, etc.).
They regularly:
Adjust positions using Gamma scalping
Balance portfolio Delta using options
Reduce Vega risk in high IV periods
📌 Result: A smooth, hedged, and controlled portfolio with minimal exposure to wild market moves.
✅ 7. Creating Synthetic Positions
Sometimes, instead of using equity or futures, institutions use options to replicate or create synthetic trades.
💡 Example:
Buy Call + Sell Put = Synthetic Long Future
Sell Call + Buy Put = Synthetic Short
This helps institutions:
Avoid STT, slippage
Better margin use
Higher flexibility with position sizing
📌 Result: Capital efficiency and strategic execution
📈 How to Spot Institutional Activity in Options?
You can decode institutional movement using these tools:
🔸 1. Open Interest (OI) Analysis
Spike in OI with price action = smart money at work
Build-up of OI near a strike = possible resistance/support zone
Use tools like Sensibull, Opstra
🔸 2. Volume + Price Movement
Sudden spike in volume in far OTM options = Institutional hedging or setup
Buy-Sell flow data shows positioning
🔸 3. Put-Call Ratio (PCR)
Used to detect market sentiment and institutional net positioning
🔸 4. IV Charts / Skew
Institutional volatility strategies are visible through steep IV skew or unusual IV changes
🔐 Final Thoughts
Institutional trading in options is not speculation. It is a scientific approach to manage:
Capital exposure
Risk control
Income generation
Volatility protection
Their objectives are not just to win trades, but to:
Protect capital
Optimize returns
Stay profitable in all market conditions

Technical Class🧠 Why Learn Technical Analysis?
Because price is king.
All news, fundamentals, and economic data are already reflected in price. Technical analysis teaches you how to read price charts and anticipate movements—giving you the timing advantage.
Institutions, traders, and even algorithms rely heavily on technical levels. So if you want to:
Know when to enter/exit
Understand where big money is active
Manage risk smartly
Improve accuracy
…you need strong technical skills.
🔍 What Will a Good Technical Class Cover?
Let’s break this into 10 structured modules, explained in human-friendly language.
📘 1. Basics of Price Action
What is a chart? (Line, Bar, Candlestick)
Understanding OHLC (Open, High, Low, Close)
Why price is the most important factor
How price creates support, resistance, and trends
👉 Outcome: You’ll read any chart confidently.
📘 2. Candlestick Patterns
Single candlesticks: Doji, Hammer, Engulfing, Marubozu
Dual & triple candle patterns: Morning Star, Evening Star, Three Soldiers
Reversal vs Continuation patterns
👉 Outcome: You’ll know how to identify potential trend reversals or strength.
📘 3. Chart Patterns (Price Structures)
Reversal Patterns: Double Top/Bottom, Head and Shoulders
Continuation Patterns: Triangles, Flags, Pennants, Rectangles
Understanding Breakouts vs Fakeouts
👉 Outcome: You’ll recognize market structures and act before the move begins.
📘 4. Support and Resistance Mastery
How to identify major support/resistance levels
Role of historical price zones
Dynamic support/resistance using moving averages
Price reaction techniques
👉 Outcome: You’ll place entries and exits at the most strategic levels.
📘 5. Trend Analysis
What is a trend? (Uptrend, Downtrend, Sideways)
How to draw trendlines correctly
Role of higher highs & lower lows
Using Multiple Timeframe Analysis
👉 Outcome: You'll align trades with major trends like professionals do.
📘 6. Indicators & Oscillators
Moving Averages (SMA, EMA): Trend confirmation
RSI: Overbought/Oversold signals
MACD: Momentum and divergence detection
Bollinger Bands: Volatility breakout
Volume Profile / VWAP
👉 Outcome: You’ll combine indicators for confluence and higher accuracy.
📘 7. Intraday Technicals
Best indicators for intraday (VWAP, Supertrend)
Time-based chart usage (5m, 15m, 1hr)
Institutional trap zones (fakeouts, liquidity sweeps)
Scalping vs momentum setups
👉 Outcome: You’ll confidently take trades within the day using fast setups.
📘 8. Risk Management and Trade Psychology
Position sizing
Risk-Reward ratio planning
Importance of Stop Loss
Emotional control: Fear, Greed, Impatience
Creating a rule-based system
👉 Outcome: You’ll trade stress-free, without blowing up your capital.
📘 9. Advanced Institutional Concepts
Smart Money Concepts (SMC): Liquidity, Order Blocks, BOS/CHOCH
Institutional Order Flow: Where big money trades
Volume Spread Analysis
Wyckoff Theory (Accumulation/Distribution phases)
👉 Outcome: You’ll learn how institutions move the markets and how to follow them.
📘 10. Strategy Building and Backtesting
Creating rule-based strategies
Journaling trades and analyzing results
Backtesting on historical data
Live market application with confidence
👉 Outcome: You’ll develop your own strategy and remove guesswork.

Option Buying vs. Option Selling🔍 What Are Options in Simple Terms?
Options are contracts that give you the right, but not the obligation, to buy or sell a stock (or index) at a specific price (called the strike price) before a certain date (the expiry).
There are two types of options:
Call Option: Gives you the right to buy.
Put Option: Gives you the right to sell.
Now, you can either buy these options or sell/write them. This is where Option Buying and Option Selling come into play.
🎯 Option Buying – The Dreamer’s Game
✅ What is Option Buying?
You pay a premium (small amount) and get the right to benefit from a big move in the market—either up or down—depending on the type of option you buy.
If you expect the market to go up, you buy a Call Option.
If you expect the market to go down, you buy a Put Option.
✅ Why Do People Love Option Buying?
Low Capital Requirement: You can buy an option for ₹100–₹2,000 and control a large value of the index/stock.
Unlimited Profit Potential: Your losses are limited to the premium, but profits can be huge if the market moves in your favor.
Simple to Execute: Easy for new traders to understand and start with.
❌ But Here’s the Harsh Reality...
Time Decay (Theta): Every day, your option loses value if the price doesn’t move. You’re fighting time.
Low Winning Ratio: Most options expire worthless. So unless you catch a big, fast move, you lose.
Emotionally Draining: You’ll be right on direction but still lose money due to premium decay or slippage.
🔄 Real-Life Example
Imagine buying a Bank Nifty 49,000 CE for ₹150. If Bank Nifty goes to 49,200, you might make good returns. But if it stays sideways or only moves near expiry, your ₹150 can become ₹10—even though your view was right.
Option Buyer’s Risk = 100% of Premium
Option Buyer’s Reward = Unlimited (theoretically)
🛡️ Option Selling – The Smart Money’s Edge
✅ What is Option Selling?
You sell/write options and receive the premium upfront. You win if the option loses value—which is what happens most of the time.
If you believe the market will not go above a certain level, you sell a Call Option.
If you believe the market will not fall below a certain level, you sell a Put Option.
Basically, you're betting on nothing extreme happening.
✅ Why Do Institutions Prefer Option Selling?
High Probability of Profit: Around 70–80% of options expire worthless. That’s why sellers profit more often.
Theta Decay Works in Your Favor: Time works for you, not against you.
Regular Income: You can create strategies to earn consistently—especially in rangebound markets.
❌ What Are the Risks?
Unlimited Loss Potential: If the market moves against you sharply, your losses can be massive.
Needs Big Capital: Option selling requires margin, usually ₹1.5 to ₹2 lakhs per lot.
High Discipline Required: One mistake (overleveraging or wrong strike selling) can blow up your account.
🔄 Real-Life Example
Suppose you sell Nifty 23,300 CE for ₹100 and Nifty closes at 23,100 on expiry. That ₹100 premium becomes zero, and you keep it fully. But if Nifty suddenly jumps to 23,500, your ₹100 premium may become ₹400 or ₹800, and you’ll be in deep trouble unless you manage your position.
Option Seller’s Risk = Unlimited (in theory)
Option Seller’s Reward = Limited to Premium
🧠 Which One Is Better?
It depends on your mindset, capital, and risk appetite.
👉 Option Buying is better if:
You are a small retail trader with ₹5K–₹20K capital.
You have a strong directional view (especially on event days).
You can afford to lose small amounts for big returns.
You don’t want to manage complex positions or margins.
👉 Option Selling is better if:
You have ₹1–₹2 lakh+ capital and a focus on consistent profits.
You can manage risk through hedging or spreads.
You prefer high accuracy and stable income over jackpot trades.
You follow rules and don’t panic with market moves.
🧠 Smart Approach: Combine Both
Professional traders don’t pick just one—they combine both.
💡 Examples:
Buy Call, Sell Far OTM Call = Bull Call Spread
Sell Both CE & PE at Key Levels = Strangle/Straddle
Buy Put, Sell Lower Put = Bear Put Spread
These reduce risk and improve probability while keeping reward potential intact.
🧘♂️ Final Advice (From Practical Traders)
Avoid random option buying. Don’t chase cheap options blindly.
Don’t sell naked options without risk control.
Use hedging or spreads to limit both loss and margin requirement.
Focus on discipline, not thrill.
Always respect position sizing, stop loss, and capital management.
Avoid trading during low volume or uncertain news zones.
📌 Conclusion
Option Buying is like buying a lottery ticket with logic. It’s risky, but the reward can be sweet. Option Selling is like being the insurance company—it’s slow, but steady and statistically in your favor.
Option Chain Analysis + Open Interest (OI)🧠 Let’s First Understand: What is Option Chain?
An Option Chain is a table that shows available strike prices for a particular stock/index along with their Call and Put option data—like premium, volume, open interest, change in OI, etc.
✅ Where can you find it?
NSE Website (most reliable)
Trading Platforms like Zerodha, AngelOne, etc.
Apps like Sensibull, Opstra, etc.
The option chain is divided into two parts:
Left side – Call Options (CE)
Right side – Put Options (PE)
Each row shows the strike price and various data like:
LTP (Last Traded Price) – the premium.
Open Interest (OI) – total contracts outstanding.
Change in OI – new positions added or removed.
Volume – how many contracts traded today.
🔍 What is Open Interest (OI)?
OI = Open Interest = Open positions in the market.
It shows how many contracts are live at a particular strike. It’s like a pulse of the market—it tells us where the action is happening.
If OI is going up → Traders are adding positions
If OI is going down → Traders are closing positions
🔑 Why Is OI Important?
Because institutions and smart money create large positions—and OI helps us identify where they’re betting.
OI gives an idea of:
Support and Resistance zones
Strength of a trend
Where market might reverse
Where volatility might increase
📘 Understanding Support & Resistance Using Option Chain
Support and resistance levels can be seen through the OI data in the option chain.
✅ How to Identify Support?
Look at Put OI:
The strike price with highest Put OI is considered strong support.
Why? Because put writers (who are mostly smart money) don’t expect the price to fall below this level.
Example:
If 22,500 PE has the highest OI, it acts as a support level.
✅ How to Identify Resistance?
Look at Call OI:
The strike price with highest Call OI is considered strong resistance.
Why? Because call writers are betting price won’t go above this level.
Example:
If 23,200 CE has the highest OI, it acts as a resistance level.
🔁 Change in OI – Fresh Positions vs Exits
Don't just look at total OI—look at the change in OI today.
Increase in OI = Fresh positions are being added
Decrease in OI = Traders are squaring off positions
It helps confirm if the current market move is genuine or fake.
Example:
If Nifty is going up and Call OI at 23,000 is increasing, it means fresh selling → possible resistance.
But if Call OI is decreasing, it means sellers are exiting → breakout possible.
🧩 How Option Chain + OI Help in Intraday Trading
Find Support & Resistance Zones
Use highest OI levels to set your boundaries.
Avoid buying near strong resistance; avoid selling near strong support.
Use OI to Validate Breakouts
Watch how OI changes near key strike prices.
If resistance strike sees short covering (OI falling), breakout is real.
Trend Confirmation
Long buildup (Price ↑, OI ↑) = Uptrend
Short buildup (Price ↓, OI ↑) = Downtrend
Expiry Day Strategy
Focus on where OI is building rapidly.
Use max pain and max OI to sell straddles/strangles safely.
🧠 Advanced Concepts
🔸 Max Pain Theory
Max Pain is the strike price where the most option buyers lose money on expiry. It is the level where option sellers are most profitable. It usually acts like a magnet near expiry.
Example:
If Max Pain for Nifty is 23,000, market may stay near this level on expiry day.
🔸 PCR (Put Call Ratio)
PCR = Total Put OI / Total Call OI
PCR > 1: More Puts than Calls → Bullish sentiment
PCR < 1: More Calls than Puts → Bearish sentiment
PCR near 1 = Neutral/Rangebound market
Use it with caution—extremely high or low PCR may signal reversal zones.
🛠️ Tools to Use (Free)
NSE India Website – Best for raw data
Sensibull, Opstra, Quantsapp – Visual OI charts
TradingView – Combine charts + option levels
Telegram OI Bots – For quick OI updates
📌 Do's & Don'ts in Option Chain + OI Analysis
✅ Do:
Use OI + Price + Volume together
Watch OI shifts during the day (especially 9:30–10:30 AM and 2–3 PM)
Combine with support/resistance zones from charts
❌ Don’t:
Trade blindly based only on highest OI
Ignore rapid changes in OI—it could signal smart money exit
Confuse high OI with direction—it just means “interest,” not bias
🎯 Final Words
Option Chain + OI analysis isn’t just a tool—it’s your insight into the mind of the market. It tells you what others are doing, especially the big players who move the markets.
To master it, keep practicing:
Observe how OI builds around events (like RBI policy, earnings)
Watch price + OI behavior on breakout and breakdown days
Pair OI with basic technical analysis for solid confidence
Institutional Order Flow / Smart Money Concepts🚀 What is Institutional Order Flow?
Institutional Order Flow simply means tracking how big players are placing their buy and sell orders, and using that data to trade alongside them — not against them.
Big players can’t enter or exit in one go. If they do, they’ll move the market too much. So they:
Split their orders
Use liquidity zones
Create traps and fakeouts to fill their orders
Your job as a retail trader is to spot these footprints.
💡 Why is it Important?
Most retail traders:
Follow indicators
Chase breakouts
React late
Institutions:
Create liquidity traps
Use retail mistakes to enter their positions
Push price into zones that force emotional trading
By understanding Institutional Order Flow or Smart Money Concepts, you’ll stop being the one getting trapped—and start trading with the whales.
🔍 Key Concepts of Smart Money / Institutional Order Flow
Let’s now break down the core principles and tools.
1. Liquidity Zones
Institutions need liquidity — meaning many buyers or sellers to fill their orders.
They create fake breakouts, stop hunts, or news spikes to force retail traders to enter or exit — and then they do the opposite.
Example:
Price breaks above resistance — retail buys breakout
Institutions sell into that liquidity
Price reverses sharply = retail gets trapped
Your job: Identify where liquidity is sitting (above highs, below lows).
2. Breaker Blocks
A breaker block is an OB that failed, but now acts as the opposite side’s zone.
Example:
Price breaks bullish OB and comes back → now it acts as support.
Same with bearish OB → becomes resistance.
These show who is now in control — buyers or sellers.
3. Market Structure Shifts (MSS)
Smart money tracks structure, not indicators.
A Market Structure Shift happens when:
The trend breaks (HH → LL or LL → HH)
A new direction is confirmed
Institutions often wait for MSS before executing large orders.
Your job: Don’t jump in early. Wait for structure change to confirm smart money is switching sides.
4. Fair Value Gap (FVG)
An FVG is a price imbalance between candles — where price moved too fast, leaving a “gap” in liquidity.
FVG means:
A zone where institutions might revisit
Often gets “filled” later
Use for entries, targets, or rejections
How to spot: In a strong move, look between the first candle’s high and the third candle’s low (or vice versa) – this is your FVG.
5. Internal vs External Liquidity
Institutions use both:
External Liquidity = above highs / below lows (stop-loss areas of retail traders)
Internal Liquidity = inside the range (consolidation, breaker retests)
They:
Grab external liquidity
Fill internal orders
Then move price in their actual direction
This explains why breakouts fail — they were designed to!
🔁 Typical Smart Money Price Flow (Simple)
Accumulate (Sideways range)
Manipulate (Fake breakout or stop hunt)
Distribute (Strong move in real direction)
If you know this sequence, you can start trading the traps, not falling for them.
🛠 How to Trade Smart Money Concepts – Step by Step
Let’s bring it all together in a logical workflow:
✅ Step 1: Analyze Market Structure
On higher timeframes (1H, 4H, Daily), check:
Trend (bullish/bearish)
Breaks in structure (HH/LL change)
Are we in consolidation?
✅ Step 2: Identify Key Zones
Mark:
Order blocks (the last opposite candle before big move)
FVGs (imbalances)
Equal highs/lows (liquidity)
Swing points (for stop hunts)
✅ Step 3: Wait for Liquidity Grab
Watch for:
Wicks above highs or below lows
Aggressive moves into zones
Quick rejections
These are signs smart money is active.
✅ Step 4: Confirmation
MSS: Wait for structure to shift
Candle Confirmation: Engulfing, Break of structure candle
FVG Fill or OB tap
Only enter when confluence builds — not just one clue.
✅ Step 5: Risk-Managed Entry
Entry: After confirmation near OB or FVG
SL: Just outside OB/FVG
TP: Next liquidity zone or opposite OB
Always maintain minimum 1:2 RR.
😱 Common Mistakes Retail Traders Make
Trading breakouts blindly
Entering before confirmation (no MSS or candle clue)
Ignoring structure for indicators
Thinking OB is one candle – it's a zone
No patience – chasing price instead of letting price come to you
🎯 Why Institutions Need You to Lose
Yes — if you lose, they win.
Your stop-loss is their entry liquidity
Your breakout buy is their exit plan
Your emotional trading funds their smart entries
That's why they manipulate, trap, and fake moves to create liquidity.
But with knowledge of Institutional Order Flow — you flip the script.
💬 Final Thoughts
Institutional Order Flow / Smart Money Concepts aren’t a secret strategy — they’re simply a deeper understanding of how the market actually works.
Instead of being manipulated, you become the one who reads the manipulation.
It’s not about predicting the market — it’s about reacting to what smart money is doing, with patience, precision, and process.
Master Institutional Trading🎯 Introduction
Master Institutional Trading is the advanced art and science of trading the financial markets the way big institutions do — with deep capital, strategic precision, and unmatched risk management.
Unlike retail trading, which often relies on basic indicators and emotions, institutional trading follows a rule-based, data-driven, and psychology-controlled framework. Mastering this approach means stepping into the mindset and strategy of hedge funds, mutual funds, proprietary desks, and investment banks.
If you want to trade with consistency, clarity, and capital preservation, mastering institutional trading is the next step.
💡 What is Institutional Trading?
Institutional trading refers to the activities of large financial entities that control significant capital and influence market movement through their trades.
Examples include:
Hedge Funds
Mutual Funds
FIIs (Foreign Institutional Investors)
DIIs (Domestic Institutional Investors)
Pension Funds
Proprietary (Prop) Trading Desks
These institutions operate based on in-depth research, order flow analysis, macroeconomic models, and advanced risk frameworks.
🧠 What Does “Master Institutional Trading” Mean?
It means gaining the skills, tools, mindset, and techniques to:
Analyze market movements through institutional logic
Identify smart money footprints
Build trades based on volume, order flow, and positioning
Manage risk with capital preservation like pros
Avoid retail traps and fakeouts set by institutions
You’re not just reacting to the market—you’re reading what the big players are doing and aligning with them.
🧩 Core Concepts in Master Institutional Trading
1. Market Structure Analysis
Understand liquidity zones, order blocks, and institutional S/R
Learn why institutions build positions over time, not all at once
2. Volume & Open Interest Analytics
Spot unusual volume spikes
Understand Open Interest traps in options
Decode what institutions are betting on
3. Smart Money Concepts
Accumulation and Distribution phases
Wyckoff Theory in modern application
Spotting manipulation and liquidity grabs
4. Advanced Risk Management
Never risk more than 1–2% per trade
Use position sizing based on volatility
Focus on capital efficiency, not revenge trading
5. Price Action + Institutional Candle Patterns
Recognize imbalance zones, breaker blocks, and engulfing traps
Use tools like VWAP, Delta Volume, and Footprint Charts
6. Trade Execution Techniques
Partial entries
Scaling in/out like funds
Managing trade lifecycle like a desk trader
🛠 Key Strategies in Master Institutional Trading
A. Liquidity Hunting
Institutions place orders where most retail SLs are placed
Then reverse price after triggering retail orders
B. Options Positioning & IV Play
Use of Straddles/Strangles for theta decay
Selling volatility pre-event, buying it post-event
C. Delta Neutral & Gamma Scalping
Market-neutral strategies hedged with futures or stocks
Designed to profit from volatility swings
D. Accumulation/Distribution Mapping
Long consolidation = institutional entry/exit
Price reacts to volume shifts more than indicator signals
🔥 Institutional Footprint Examples (Nifty/Bank Nifty)
ATM Straddle OI surge with no move in price
→ Market makers hedging aggressively = big move coming
Sudden OTM Put buying with high IV on a flat day
→ Institutions betting on downside volatility = potential crash setup
VWAP deviation rejection
→ Institutions use VWAP as a fair value; moves away from it often reverse
👨🏫 How to Master Institutional Trading?
✅ Step-by-step Learning Path:
Study Market Microstructure
Understand how orders get matched, what limit/market orders do.
Learn Option Greeks & Institutional Strategies
Especially delta, gamma, and IV crush.
Use Volume Profile, VWAP, OI data together
Build your view based on multi-layered confirmation.
Follow FIIs/DII Data Daily
Learn how they position in equities, derivatives, and sectors.
Backtest Institutional Setups
Focus on risk-reward, not just accuracy.
Use Trading Journals
Analyze what works, improve continuously.
⚠️ Common Mistakes Traders Make (That Institutions Don’t)
Chasing trades emotionally
Overtrading low-conviction setups
No journaling or review process
Relying on random indicators instead of structure
Ignoring risk-to-reward or capital management
🧘♂️ Mindset of Institutional Traders
"Protect capital first, profits will follow."
Trade like a sniper, not a machine gun.
Think in terms of probabilities, not guarantees.
Never marry your analysis; adapt to new information.
💼 Who Should Learn Master Institutional Trading?
Intermediate to advanced traders
Full-time traders or those planning to go full-time
Derivatives traders (Nifty, Bank Nifty, Options)
Students of technical analysis who want a deeper, real-world edge
🔚 Final Words
Master Institutional Trading is the next-level evolution of your trading journey. It’s about stepping away from noise and hype, and embracing how real money trades.
You don’t need a hedge fund job to trade like one—you just need the knowledge, tools, and discipline. When you think and act like an institution, you stop being prey and start playing the game with the big players.

Advance Option Trading💡 Why Advance Option Trading?
While beginner traders focus on price movement, advanced traders focus on:
Time decay (theta)
Volatility (vega)
Delta hedging
Neutral or range-bound markets
Income generation through spreads and option writing
This style of trading provides better capital efficiency, defined risk, and consistent performance across all market conditions (bullish, bearish, or sideways).
2. Implied Volatility (IV)
Higher IV = Expensive options
Lower IV = Cheap options
Key for strategies like IV Crush, Calendar Spreads, or Vega-neutral plays
3. Volatility Smile/Skew
Institutions track which strikes have higher IV. Advanced traders position accordingly.
🔧 Common Advanced Strategies
✅ 1. Straddle & Strangle (Neutral Volatility Strategy)
Straddle: Buy/Sell ATM Call + Put
Strangle: Buy/Sell OTM Call + Put
Use when expecting big movement or no movement (based on IV)
✅ 2. Iron Condor (Range-Bound Strategy)
Sell OTM Call and Put, Buy further OTM Call and Put (as hedge)
Best for sideways markets
Generates consistent income with limited risk
✅ 3. Calendar Spread (IV-Based Strategy)
Sell near-expiry option and buy same strike of a later expiry
Profits from increase in IV and time spread
✅ 4. Butterfly Spread (Limited Risk Strategy)
Example: Buy 1 OTM Call, Sell 2 ATM Calls, Buy 1 ITM Call
Small risk and good reward if price stays within expected range
✅ 5. Ratio Spread
Sell more options than you buy (e.g., sell 2 OTM Calls, buy 1 ITM Call)
Advanced version of directional bet with built-in hedge
✅ 6. Delta Neutral / Gamma Scalping
Balancing option position so that price movement doesn’t affect value
Common in institutions for high-frequency trading
📈 How to Select Right Strategy
✅ Identify Market Trend: Bullish, Bearish, Sideways
✅ Measure IV: Is it high or low?
✅ Track OI (Open Interest): Where are institutions positioning?
✅ Calculate Risk-to-Reward: Does your strategy offer good payoff?
✅ Time to Expiry: Shorter expiry = faster theta decay
⚠️ Risk Management in Advanced Option Trading
Professional traders always:
Set max loss per trade (usually <2% of capital)
Use hedged strategies (never naked short)
Adjust positions if the market breaks range
Keep an eye on Greeks changing with time
Track IV movement before entering trades
📊 Tools Used by Advanced Option Traders
Tool Purpose
Option Chain + OI Analysis Track smart money activity
Greeks Calculator (Sensibull, Opstra) Real-time risk data
IV Charts & Skew Analysis Measure volatility pricing
Backtesting Engines Validate strategies over past data
Algo Execution Tools Automate multi-leg strategies
🧠 Institutional Tactics in Advanced Option Trading
Institutions and prop firms often:
Build delta-neutral portfolios
Sell options with high IV and buy protection
Trade around key levels (VWAP, ATR ranges)
Use gamma scalping for directional bias
Exploit retail option traps near expiry
🔁 Adjustment Techniques (When Trade Goes Wrong)
Rolling the Position – Move strikes up/down or to next expiry
Convert into Ratio Spreads or Butterfly
Hedge with Futures
Close partially and rebalance
Switch to opposite bias if directional conviction is lost
💼 Who Should Learn Advanced Option Trading?
Traders already familiar with basic Calls & Puts
Intraday or swing traders wanting consistency
People managing 6- or 7-figure capital
Option sellers who want defined risk strategies
Anyone seeking market-neutral strategies for steady income
🔚 Final Thoughts
Advanced Option Trading is not about taking more trades — it's about trading smarter, with risk-managed, probability-based setups. When you learn how to use Greeks, volatility, and structure trades, you gain a huge edge over emotional retail trading.

Institutional Objectives in Options Trading1. ✅ Hedging Existing Positions
Primary use of options by institutions is to hedge large portfolios against downside risk.
Example:
A mutual fund holding ₹100 crore of Nifty 50 stocks may buy ATM or slightly OTM Put options to protect against market correction.
Protective puts and collars are commonly used to limit drawdowns while staying invested.
🧠 Why?
Institutions can’t exit positions quickly without affecting prices. Hedging gives them protection without selling.
2. 💸 Generating Consistent Premium Income
Institutions frequently sell options (especially OTM calls or puts) to generate passive income.
Strategies like:
Covered Call Writing
Iron Condors
Short Strangles
They profit from time decay (theta) and the fact that most options expire worthless.
🧠 Why?
Consistent income + statistical edge + capital utilization = institutional trading edge.
3. 📊 Volatility Trading
Institutions exploit differences between implied volatility (IV) and expected volatility (realized).
If IV is overpriced: they sell options (e.g., strangles, straddles)
If IV is underpriced: they buy options (vega-positive strategies)
They may also trade volatility directionally, using long vega positions before events, then closing post-event for IV crush profits.
🧠 Why?
Volatility is measurable, forecastable, and less random than price.
4. ⚖️ Market-Neutral Strategies (Delta-Neutral Trading)
Institutions construct delta-neutral portfolios using options + futures or stock positions.
Aim: To remain neutral to price movement and profit from volatility or theta decay.
Example: Sell ATM straddle, hedge delta with futures, adjust gamma regularly.
🧠 Why?
Neutral strategies reduce directional risk and offer better control over large portfolios.
5. 🧮 Arbitrage Opportunities
Institutions exploit pricing inefficiencies between:
Spot and Futures vs. Options
Call-Put Parity violations
Time spread (Calendar arbitrage)
Skew arbitrage (buy underpriced, sell overpriced)
These strategies are often automated and require fast execution & deep capital.
🧠 Why?
Low-risk opportunities with high-frequency trading models.
6. 🧱 Portfolio Construction & Rebalancing
Options help institutions structure complex multi-asset portfolios using derivatives to offset sectoral risk, beta exposure, and drawdowns.
Example:
Hedging a tech-heavy portfolio by buying sector puts or using index options to balance exposure.
🧠 Why?
Options allow flexible risk management without directly altering core holdings.
7. 🔍 Event-Based Positioning
Institutions position themselves before key events:
Central bank meetings
Earnings reports
Budgets & elections
Fed rate decisions
They use options to:
Capture volatility spikes
Benefit from large moves
Hedge against adverse outcomes
Common strategy: Buy straddles or strangles pre-event, close post-event.
🧠 Why?
Leverage big events for volatility profit, while limiting risk to premium paid.
8. 🔐 Capital Efficiency and Leverage
Options allow institutions to:
Take positions with lower capital
Control large amounts of underlying using premiums
Enhance portfolio yield without leveraging core assets
Example: Buying call options instead of holding stocks for limited upside exposure.
🧠 Why?
Use of derivatives increases return-on-capital with controlled downside.
9. 🧠 Strategic Positioning via Open Interest (OI)
Institutions often create positions in options to:
Build pressure zones
Influence price action at key strikes (especially on expiry)
Track and trap retail option buyers (via fake breakouts or max pain theory)
🧠 Why?
Control over OI levels gives them an edge over uninformed players.
10. 🔁 Rolling, Adjusting & Managing Large Positions
Institutions don’t just enter and exit. They:
Roll positions across strikes or expiries
Adjust delta/gamma exposure
React to market shifts quickly without liquidating core holdings
Example:
Rolling a short call up if market is bullish
Converting short put into put spread if volatility increases
🧠 How Can Retail Traders Learn from Institutional Objectives?
Avoid naked option buying unless IV is low
Learn to sell options in range-bound or high-IV markets
Use Greeks to manage risk and adjust positions
Start tracking OI shifts before expiry
Never trade based on emotions — trade based on structure
🔚 Conclusion
Institutional options trading is driven by clear objectives, probability-based decisions, and risk frameworks. They use options not to gamble, but to optimize performance, protect portfolios, and generate edge.
If retail traders start thinking like institutions — by focusing on risk, volatility, structure, and data, rather than emotions — they’ll not only survive in the market, but begin to thrive.

Advance Option Trading vs. Master Institutional Trading🎯 What is Advance Option Trading?
Advance Option Trading means using complex option strategies to manage risk, take advantage of volatility, or make consistent income from the market.
You’re not just buying a Call or a Put here. You’re using combinations of options like:
Spreads (Bull Spread, Bear Spread)
Iron Condors
Butterflies
Ratio Spreads
Calendar Spreads
You're also learning to understand and control variables like:
Delta (directional movement)
Theta (time decay)
Vega (impact of volatility)
Gamma (rate of Delta change)
In short, it’s like playing chess with the market using tools that have defined risk and reward. You can win even if the market moves sideways or only slightly moves in your direction.
🧠 What is Master Institutional Trading?
Master Institutional Trading is about thinking and trading like big institutions – the banks, hedge funds, and FIIs (Foreign Institutional Investors). These players don’t trade like retail traders.
They control large volumes, manage millions or billions in capital, and have the ability to move markets. But here's the secret: they don’t chase price… they create price movement.
In this trading style, your focus is on:
Volume Profile
Order Blocks
Liquidity Zones
Market Structure
Smart Money Concepts (SMC)
Wyckoff Theory
You're not predicting price – you're following the footprints of big money. You’re trying to enter when institutions are entering, and avoid traps they set for retail traders.
🔄 Core Difference at a Glance
Feature Advance Option Trading Master Institutional Trading
Asset Used Options (CE/PE) Stocks, Futures, Options
Main Tool Option Greeks, Option Chain Volume Profile, Order Flow
Style Strategy-based Flow-based
Mindset Structured, mathematical Contextual, dynamic
Learning Curve High (requires math + logic) High (requires market psychology + vol read)
🧰 Tools Used
Tool Option Trading Institutional Trading
Option Chain ✅ ❌
Greeks (Delta, Theta, Vega) ✅ ❌
Volume Profile ❌ ✅
Market Structure (HH/LL) ❌ ✅
Implied Volatility (IV) ✅ ❌
Order Flow/Tape ❌ ✅
Liquidity Zones ❌ ✅
Expiry Analysis ✅ Sometimes
VWAP & POC Optional Core tool
🎯 Goals of Each Trader
🧪 Advance Option Trader:
Earn from time decay (Theta)
Use spreads to protect capital
Trade with defined risk
Take advantage of volatility crush
Scalp on expiry days using option premiums
🎯 Institutional Trader:
Trade in alignment with Smart Money
Ride major directional moves
Avoid retail traps
Use volume as a leading indicator
Trade price action with deeper logic
💥 Example in NIFTY
Let’s say NIFTY is at 22000.
✅ Option Trader's View:
Market is range-bound
Build an Iron Condor:
Sell 21800 PE, Buy 21700 PE
Sell 22200 CE, Buy 22300 CE
Max profit if NIFTY stays in range for next 3 days
✅ Institutional Trader's View:
Market faked a breakout above 22100
Big volume appeared at top, then reversed
Enters short after liquidity sweep
Targets zone near 21850, which is a demand block
🤔 Which One Should You Learn?
Your Profile Go for Option Trading Go for Institutional Trading
You like rules, logic, math ✅ ❌
You enjoy price-action & market behavior ❌ ✅
Want passive income from theta decay ✅ ❌
Want to scalp or swing big moves ❌ ✅
Prefer fixed risk/reward trades ✅ ❌
Want to track where big money trades ❌ ✅
You hate fake breakouts ❌ ✅
🧩 Can You Combine Both?
Absolutely!
In fact, many successful traders today use Institutional Trading concepts (like SMC or Volume Profile) to identify zones and then execute trades using option strategies.
Example:
Use institutional zone to identify support/resistance
Then sell options near those zones
Or place a directional option spread trade
This is called "confluence trading" – where different systems come together to build a stronger edge.
⚠️ Common Mistakes
🚫 In Option Trading:
Ignoring Greeks
Blindly buying options without IV analysis
Trading low volume strikes
Not adjusting positions
🚫 In Institutional Trading:
Overusing Smart Money concepts without confirmation
Misreading fakeouts as real breakouts
Trading against volume
Being impatient and entering early
✅ Final Summary
🔹 Advance Option Trading
You’re a strategy player
Mastering time decay, volatility, and spreads
Goal: Defined profit, controlled loss, consistent income
🔹 Master Institutional Trading
You’re a market observer
Mastering order flow, liquidity, and manipulation
Goal: Ride big moves, avoid traps, think like smart money
Cryptocurrency Day Trading🧠 What is Cryptocurrency Day Trading?
Day trading means buying and selling crypto coins within the same day — sometimes within minutes or hours — to profit from small price movements.
You don’t hold positions overnight. The goal is to enter and exit quickly, catch a few percent in price movement, and repeat.
Examples of popular cryptos for day trading:
Bitcoin (BTC)
Ethereum (ETH)
Solana (SOL)
Ripple (XRP)
Pepe, Shiba Inu (Meme Coins)
New trending tokens (like AI or gaming-based tokens)
These coins can move 5% to 50% or more in a single day — that’s what makes day trading so attractive!
📊 Why People Love Crypto Day Trading
24/7 Market Access
Unlike stock markets, crypto never sleeps.
You can trade anytime, even late at night.
Volatility = Profit Potential
Crypto prices move wildly.
More movement = more chances to make money.
Low Barrier to Entry
You can start with $10 or $100.
No big capital or licenses required.
Leverage Options
Platforms like Binance, Bybit, and KuCoin offer leverage (e.g., 5x, 10x, 50x).
This can amplify profits (but also increase risk!).
Fast Results
Unlike long-term investing, day trading gives instant feedback.
You know within hours if you’re winning or losing.
⚙️ How Crypto Day Trading Works (Simple Explanation)
Let’s say you’re watching SOLANA (SOL) today.
Price is moving between $75 and $80.
You notice a pattern: Every time it touches $75, it bounces back up.
So you buy at $75, wait for a small move to $77, and sell.
You just made a 2.6% gain.
Now imagine doing that multiple times in a day, or with larger capital. That’s the basic idea.
🎯 Key Strategies Used in Day Trading
Let’s explore the most common (and effective) strategies in simple language:
1. Scalping
Fastest form of trading.
Holding a coin for seconds to a few minutes.
Goal: Catch tiny moves — 0.5% to 1% — many times a day.
🛠️ Tools: 1-minute or 5-minute chart, high volume coins, tight spreads.
2. Breakout Trading
Price builds up like pressure, then breaks out of a level.
Traders watch for resistance breakout or support breakdown.
After breakout, price usually moves quickly — giving fast trades.
🧠 Tip: Watch key levels and volume spike during breakout.
3. Range Trading (Buy Low, Sell High)
When price stays inside a box or zone.
Traders buy at the bottom of the range and sell at the top.
Simple but powerful when done right.
📌 Use on sideways markets. Works great with RSI (Relative Strength Index).
4. News-Based Trading
Crypto reacts quickly to news (good or bad).
For example: If Bitcoin ETF gets approved → Price jumps.
Traders jump in right after big news and ride the wave.
⚠️ Be careful — fake news can also move markets quickly.
🛠️ Must-Have Tools for Day Trading Crypto
TradingView – Best for charts and indicators.
Binance / Bybit / KuCoin – Major exchanges with good liquidity.
CoinMarketCap / CoinGecko – Track coins, market caps, news.
Twitter / Telegram / Discord – Stay updated on trending tokens.
Stop Loss & Take Profit Tools – Crucial for risk control.
📉 Risk Management – The Life Jacket of a Day Trader
Here’s the truth: Without good risk management, you will lose money — even if your strategy is good.
Here are golden rules:
✅ Never risk more than 1-2% per trade
✅ Always use a stop loss
✅ Don’t chase the market
✅ Don’t trade with emotions
✅ Keep a trading journal
Example: If you have $1000, don’t risk more than $20 on one trade.
😰 Common Mistakes (And How to Avoid Them)
❌ Overtrading
Trying to take too many trades in one day. Your brain burns out.
👉 Take only high-quality setups. Less is more.
❌ No Plan
Trading based on “gut feeling” is gambling.
👉 Always have an entry, stop loss, and target.
❌ Revenge Trading
You lost money — now you're trying to “win it back” emotionally.
👉 Take a break. Come back with a clear head.
❌ Ignoring Risk
Using 20x leverage on meme coins without a stop loss is financial suicide.
👉 Respect the risk or the market will humble you.
🤖 Can You Use Bots or AI?
Yes, many day traders use trading bots or AI assistants to:
Scan for signals
Enter/exit trades automatically
Apply indicators faster
But remember: Bots don’t guarantee profit. You still need logic and supervision.
🧘♂️ Mindset of a Successful Day Trader
The best traders treat trading like a business, not a game.
They are:
Disciplined
Patient
Data-driven
Emotionally stable
Focused on long-term performance, not just daily wins
They don’t chase hype — they follow the process.
💼 Can You Make a Living from Crypto Day Trading?
Yes, but not easily. It takes:
Skill
Discipline
Capital
Experience
Most beginners lose money in the first 3–6 months. That’s normal. But with proper learning, journaling, and strategy, it is possible to be consistently profitable.
📌 Final Thoughts: Is It for You?
Crypto day trading is exciting, fast-paced, and potentially very profitable — but also risky and demanding.
Pros:
High income potential
No 9–5 job
Remote, flexible lifestyle
Cons:
High risk
Mentally exhausting
Emotionally draining
Steep learning curve
If you love analyzing charts, making quick decisions, and have emotional control — this might be for you.
But if you’re not ready for the pressure, consider swing trading or investing instead.
✅ Bonus Tip:
Start with paper trading (demo mode) or trade small amounts before risking big money. Focus on mastering one strategy first before learning ten things at once.

Option TradingWhat Is an Option?
An option is a financial contract that gives the buyer the right, but not the obligation, to buy or sell an underlying asset at a specific price (called the strike price) on or before a specific date (called the expiry date).
There are two main types of options:
Call Option – Gives the right to BUY the underlying asset.
Put Option – Gives the right to SELL the underlying asset.
🔹 Example:
If you buy a Call Option on Reliance with a strike price of ₹2,500 and the stock goes to ₹2,600, you can buy it at ₹2,500 and sell it at market for ₹2,600 – making a profit.
Basic Terminologies in Option Trading
Strike Price: The fixed price at which the option holder can buy or sell the asset.
Premium: The price paid to buy the option contract.
Expiry Date: The last date on which the option can be exercised.
Lot Size: The fixed quantity of the underlying asset in one options contract.
ITM/ATM/OTM (Moneyness):
In the Money (ITM): Option has intrinsic value.
At the Money (ATM): Strike price = current market price.
Out of the Money (OTM): Option has no intrinsic value yet.
Core Concepts of Option Trading
1. Option Buying vs Option Selling
Option Buyers pay a premium and have limited risk but unlimited profit potential.
Option Sellers (Writers) receive the premium but take on potentially higher risk.
2. Time Decay (Theta)
Options lose value as they approach expiry. This is called time decay. It works against buyers and in favor of sellers. Therefore, option sellers benefit more from time decay.
3. Volatility (Vega)
Volatility affects the premium of options. Higher expected volatility leads to higher premiums. Traders often use Implied Volatility (IV) and Historical Volatility (HV) to make trading decisions.
4. Option Greeks
Advanced traders use Greeks to measure different risks in an option:
Delta: Sensitivity to price change.
Gamma: Change in Delta with price movement.
Theta: Impact of time decay.
Vega: Impact of volatility changes.
Rho: Impact of interest rate changes.
Understanding Greeks is crucial for adjusting and managing option positions.
Popular Option Strategies
Once a trader understands calls and puts, they can use strategies combining multiple options:
✅ Single-Leg Strategies (Basic)
Buying Call or Put: Speculative strategy to profit from movement in one direction.
Selling Call or Put: Used to earn premium with a view that the market will stay flat or move in the opposite direction.
✅ Multi-Leg Strategies (Advanced)
Bull Call Spread: Buy one call and sell another at a higher strike. Used in moderately bullish outlook.
Bear Put Spread: Buy one put and sell another at a lower strike. Used in moderately bearish outlook.
Straddle: Buy a call and a put at the same strike and expiry. Used when expecting a big move, but unsure of the direction.
Iron Condor: Four-option strategy used in sideways markets to earn limited profits with limited risk.
Risk Management in Option Trading
Because options involve leverage, managing risk is crucial. Key practices include:
Position sizing: Only use a small portion of capital per trade.
Stop-loss and Target levels: Always have a predefined exit plan.
Avoid overtrading: Overuse of leverage leads to quick losses.
Understand margin requirements: Especially important for sellers.
Tools Used in Option Trading
Traders use various tools to analyze the market:
Option Chain Analysis: Shows available strike prices, premiums, and Open Interest (OI).
OI Data: High OI at certain strikes indicates strong support/resistance.
IV Chart: Helps spot overbought or oversold options.
Payoff Diagrams: Visual representation of potential profit or loss.
Why Trade Options?
Advantages:
Lower capital requirement
Multiple strategies in all market conditions
Potential for high returns
Useful for hedging equity positions
Disadvantages:
Complex for beginners
Time decay works against buyers
Can incur large losses if misused (especially in option selling)
Conclusion
Option trading offers a dynamic and powerful way to engage with the stock market. It provides flexibility, leverage, and a range of strategies to suit any market condition — bullish, bearish, or neutral. However, it's not a shortcut to riches. Success in option trading demands proper knowledge, discipline, and strategy. Whether you're a beginner or an advanced trader, continuously learning and practicing is key. Start small, understand the risk, and build a system that suits your trading psychology and capital.
If you master the fundamentals — Calls, Puts, Greeks, Time Decay, Volatility, and Risk Management — you can take your trading to the next level and even venture into the world of institutional-style trading strategies.

Advance Option TradingKey Concepts in Advanced Options Trading
Multi-Leg Strategies:
Advanced options trading heavily involves multi-leg strategies — using two or more options contracts in a single trade. Popular ones include:
Iron Condor: A neutral strategy involving four different options contracts to profit from low volatility. It generates a limited profit if the stock remains within a specific range.
Straddles and Strangles: Used when expecting a large price move, but unsure of the direction. Traders buy both a call and a put option.
Butterfly Spreads: These limit both risk and reward and are ideal when the trader believes the stock will stay near a specific price.
Adjustments and Rolling:
Unlike basic options traders who may let contracts expire, advanced traders constantly adjust positions. For example, if a trade moves against them, they may "roll" the position — closing it and reopening another at a different strike or expiry.
Understanding Option Greeks:
Advanced traders don’t just bet on direction; they manage exposure to:
Delta (Direction)
Gamma (Rate of change of delta)
Theta (Time decay)
Vega (Volatility sensitivity)
Rho (Interest rate impact)
This helps in building more calculated, data-driven trades.
Volatility Trading:
Volatility is key in advanced options. Some traders look to exploit Implied Volatility (IV) — pricing of future volatility — by trading IV crush around earnings or economic events. For instance, an Iron Condor may be used when IV is high, aiming to profit from the IV drop.
Directional vs. Non-Directional Trading:
Advanced traders often prefer non-directional strategies. These are setups where you can make money even if the market goes sideways, such as with Iron Condors or Calendar Spreads.
Risks in Advanced Options Trading
While the rewards can be higher, so are the risks. Complex strategies can lead to significant losses if misunderstood. Margin requirements can be high, and some trades may have unlimited loss potential (e.g., uncovered calls). Hence, strict risk management, stop-loss rules, and position sizing are essential.
Final Thoughts
Advanced options trading is not for beginners, but for those who want to move beyond simply guessing market direction. It’s about constructing trades that work in various market conditions — bullish, bearish, or sideways — and using volatility and time as weapons. With the right knowledge and discipline, advanced options can become a powerful tool in any trader’s arsenal. However, success requires education, continuous learning, and a clear understanding of risk and reward

Reliance, HDFC Bank, PSU Banks Special Focus📌 Why These Stocks Are in the Spotlight
The Indian stock market in 2025 has been witnessing a powerful bull run, and three segments are consistently making headlines:
Reliance Industries – Due to digital, energy, and demerger buzz
HDFC Bank – Despite recent underperformance, it's at a crucial turning point
PSU Banks – The comeback kings, leading the financial sector with strong balance sheets and credit growth
These aren't just stocks—they are pillars of the Indian economy and barometers for sentiment, both for domestic and foreign investors. Let’s dive into each of them in depth.
🛢️ 1. Reliance Industries – The Giant with Multiple Growth Engines
📈 Market Cap & Relevance
Reliance is India’s largest company by market cap. It’s not just a conglomerate—it’s a full-blown economic ecosystem spanning:
Oil & Petrochemicals
Telecom (Jio)
Retail
Digital services (Jio Platforms)
Green Energy
⚙️ Key Drivers in 2025:
🔹 1. Jio Financial Demerger (JFS)
Post-demerger, Reliance has unlocked significant shareholder value.
JFS is slowly becoming a digital finance powerhouse with lending, insurance, and asset management plans.
Investors see JFS as a potential fintech disruptor.
🔹 2. Green Energy & Hydrogen
Ambani’s ₹75,000 crore green push is gaining traction.
New announcements around solar panel manufacturing, battery storage, and hydrogen fuel cells are bullish triggers.
India’s energy transition policies support this narrative.
🔹 3. Retail & E-commerce Expansion
Reliance Retail is aggressively expanding into Tier 2/3 towns.
Synergies with WhatsApp and JioMart are boosting the omni-channel model.
IPO expectations for Retail arm in 2025–2026.
🔹 4. Petrochemicals Recovery
With global crude stabilizing and demand picking up, O2C margins are improving.
This helps Reliance's traditional cash cow business.
💡 Technical View:
Stock recently gave a breakout above ₹3,000.
Strong institutional buying seen.
Analysts setting targets between ₹3,200–3,500 in short-medium term.
🧠 Trader Takeaway:
Ideal for long-term portfolio and sector rotation strategy.
Short-term trades possible on earnings announcements, subsidiary IPO news, or divestments.
🏦 2. HDFC Bank – Sleeping Giant at Turning Point
📉 What Happened?
HDFC Bank, post-merger with HDFC Ltd, became India’s largest private bank by balance sheet size. But ironically, the stock underperformed for much of 2023–2024.
🧾 Reasons for Underperformance:
Confusion and uncertainty post-merger
Weak deposit growth vs. credit growth
Net Interest Margins (NIMs) under pressure
Weak earnings in multiple quarters
But 2025 tells a different story.
📈 Fresh Catalysts for Re-rating:
🔹 1. Integration Settling
The merger is now largely complete from an operational standpoint.
Synergies in housing finance and cross-sell are beginning to show.
🔹 2. Deposit Base Stabilizing
Aggressive branch expansion and new digital products have improved CASA ratio.
Focus is on rural/semi-urban penetration.
🔹 3. Tech & AI Focus
New investment in digital infrastructure, robo-advisory, and AI-based lending systems.
Competing directly with fintechs rather than fearing them.
🔹 4. Valuation Comfort
Price-to-book (P/B) of ~2.1x vs historic avg of 3.2x
Institutions are seeing value accumulation zone
💡 Technical View:
After bottoming around ₹1,350–1,400, strong bounce seen.
Next key resistances: ₹1,700 and ₹1,800.
Many traders are positioning for mean reversion plays.
🧠 Trader Takeaway:
Best suited for positional trades or long-term SIP-style entries
Watch for upcoming quarterly earnings as turning point confirmation
🏛️ 3. PSU Banks – From Forgotten to Frontline
🧭 What’s Driving the PSU Bank Rally?
After years of being ignored due to NPAs, corporate defaults, and government inefficiency stigma, PSU banks are now the stars of the financial sector.
Key reasons behind this dramatic shift:
🔹 1. Asset Quality Improvement
GNPA ratios have fallen to multi-year lows
Most PSU banks are now net NPA below 1%
🔹 2. Credit Growth Resurgence
Double-digit loan growth across retail, MSME, and infrastructure
Focus on digital banking and mobile-first services have helped increase customer base
🔹 3. Government Push
Massive infra push (railways, roads, housing) is fueling credit demand
Capex-linked lending growth is largely happening via PSU banks
🔹 4. Strong Financials
BoB, Canara Bank, Union Bank, and SBI have posted record profits
Net Interest Income (NII) and Operating Profit are at all-time highs
Dividend yields of 4–6% make them attractive to income investors
🔹 5. Re-Rating by FIIs and DIIs
PSU Banks were under-owned; that’s now reversing.
With global macro uncertain, foreign funds are betting on domestic demand-driven banks.
📈 Stocks in Focus:
State Bank of India (SBI): India’s largest lender, breaking out of long-term ranges
Bank of Baroda: Strongest PSU performer in 2024, tech-heavy
Canara Bank & Union Bank: Solid earnings, undervalued
💡 Technical View:
PSU Bank index hitting new all-time highs
BoB, Canara, Union, PNB giving weekly/monthly breakouts
🧠 Trader Takeaway:
Best for momentum trading, swing trades, and F&O strategies
Investors focusing on value + dividend + PSU story
🧠 Final Thoughts
In the 2025 trading and investment landscape, Reliance, HDFC Bank, and PSU Banks offer three distinct opportunities:
Reliance is a structural long-term compounder with growth in multiple verticals.
HDFC Bank is a value + recovery bet, especially appealing to contrarian investors.
PSU Banks are momentum machines backed by real earnings and strong policy tailwinds.
They are each being watched closely by FIIs, DIIs, retail traders, and even global strategists due to India’s growing weight in global indices like MSCI and FTSE.
Bank Nifty and Nifty50 Scalping TechniquesWhat is Scalping in Index Trading?
Scalping is a high-frequency intraday trading style where a trader looks to capture small price movements multiple times throughout the day. In indices like Nifty50 and Bank Nifty, where price movement is fast and often sharp, scalping is a preferred strategy for many traders.
Scalpers don't aim to catch a ₹100 move. Even ₹20–₹30 on a Bank Nifty option, done 3–4 times a day with volume and discipline, can generate consistent returns.
Why Nifty50 & Bank Nifty for Scalping?
High Liquidity: Tight bid-ask spreads make it easier to enter and exit quickly.
Option Volatility: Options on these indices give quick 5–10% moves in minutes.
Trend & Momentum Friendly: These indices often move in clean intraday trends, giving plenty of scalping chances.
Institutional Interest: Nifty and Bank Nifty are tracked by institutions, so technical levels work well.
Tools Every Scalper Must Use
Before we dive into strategies, make sure you have these ready:
5-Minute / 3-Minute Candlestick Chart
VWAP (Volume Weighted Average Price)
CPR (Central Pivot Range)
Price Action Levels (Previous Day High/Low, Opening Range)
Option Chain Analysis (for OI build-up)
Volume & Momentum Indicators (e.g., RSI, MACD)
Top Scalping Techniques for Nifty & Bank Nifty
1. VWAP Bounce Strategy
Best Time: 9:30 AM to 11:00 AM or 1:30 PM to 3:00 PM
How it works:
Wait for price to test the VWAP line.
If trend is up, and price bounces from VWAP with a bullish candle → enter Call Option.
If trend is down, and price rejects VWAP with bearish candle → enter Put Option.
Entry: On confirmation candle after touching VWAP
Target: 15–25 points on option premium
Stop Loss: 5-minute candle close above/below VWAP
Why it works: Institutions use VWAP for entries; many intraday algos are VWAP-based.
2. CPR Breakout Scalping
Best Time: Opening hour or post-lunch (2:00 PM onwards)
How it works:
If the day’s CPR is narrow, expect trending moves.
Wait for a breakout above CPR high (for long) or below CPR low (for short).
Entry only after a strong 5-minute candle closes outside CPR.
Bonus Tip: Narrow CPR + gap-up = trend day; very scalper-friendly.
Targets: 1:1.5 or trailing stop loss
Risk: High if you trade before confirmation—wait for candle close.
3. Opening Range Breakout (ORB)
Best Time: 9:15 AM – 9:45 AM
How it works:
Mark high and low of first 15 minutes (Opening Range).
Wait for price to break above high or below low with volume.
Ride the momentum for a quick 20–30 point move.
Ideal with: Volume spike + option chain confirmation (OI buildup)
Setup Example:
Bank Nifty breaks above 15-min high, with strong buying in 44,000 CE option → go long.
4. Momentum Scalping with RSI + Candles
How it works:
Use 3-minute chart.
If RSI crosses 60 and a strong green candle forms → go long.
If RSI drops below 40 and red candle forms → go short.
Why this works: Combines price momentum with volume conviction.
Targets: Small, quick moves (10–20 points in Nifty, 20–40 in Bank Nifty options)
Stop Loss: Fixed SL or previous candle high/low
5. Option Chain Scalping – "Smart Money Footprint"
How it works:
Track OI build-up in real-time (especially at ATM or 1-step OTM strikes).
If you see heavy OI build-up + volume spike at 44,000 CE → momentum may build.
Enter on confirmation from price chart (ideally with VWAP or CPR confluence).
Bonus: Combine this with Live Change in OI (many brokers offer this now).
Tools to watch:
Strike Price OI Build-up
IV Rise (Implied Volatility)
Volume on Option Contracts
Important Scalping Do’s & Don'ts
Do’s:
Trade only when price structure + indicator + volume align.
Use limit orders to reduce slippage.
Cut losses fast. Scalping is risk-first.
Have fixed daily targets (e.g., ₹1,500/day)
Trade less when market is choppy
Don’ts:
Don’t chase after big moves already gone.
Don’t increase lot size without system consistency.
Don’t scalp in low volatility phases (e.g., between 12–1:30 PM).
Mindset of a Nifty/Bank Nifty Scalper
You are not a trend trader – you’re a sniper.
Profits come from repetition, not jackpot moves.
You must read the pulse of the market within the first 30 minutes.
No trade > bad trade.
Scalping is about control, discipline, and micro-decisions. Even 3–5 successful trades in a session can result in high accuracy days.
Example Live Scenario (Bank Nifty)
Date: Suppose Bank Nifty opens at 44,000
CPR Range: 43,940–44,060 (tight)
VWAP: At 44,020
Option Chain: 44,000 CE OI increasing rapidly, price trading above VWAP
Setup: CPR breakout + VWAP hold + OI build-up at CE
Trade: Buy 44,000 CE @ ₹120
Target: ₹140–₹160
SL: ₹110
Exit: Within 10–15 mins
Avoid trading just on gut feeling. Use structure.
Conclusion
Scalping in Nifty and Bank Nifty is not gambling—it's calculated, quick decision-making with small but consistent profits. Whether you’re using VWAP, CPR, or live option data, your edge comes from preparation and discipline, not prediction.
If you're just starting, begin with paper trading or small lots, and gradually scale up once your win-rate improves. With time, you'll find the setup that fits your personality best—whether it’s breakout-based, pullback scalping, or OI-driven.