SBICARD Technical Analysis | Double Bottom Breakout Explained📊 SBICARD Trade Analysis
🔎 Price Action
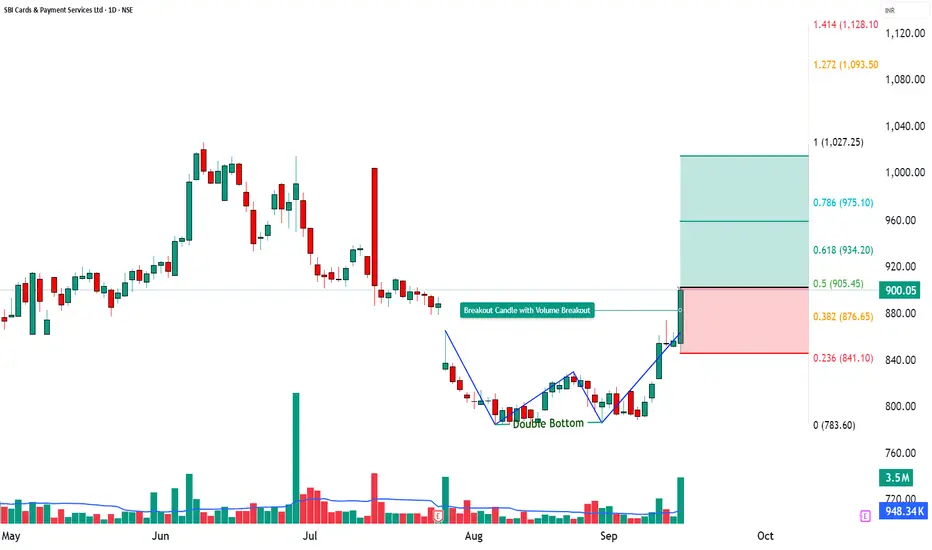
SBICARD closed at ₹900.05 with a sharp +5.13% gain, backed by a volume of 35.03 lakh, far higher than its 20-day average of 9.48 lakh (VolX = 3.67x).
This massive surge in activity highlights aggressive buying and momentum revival after a consolidation phase.
________________________________________
📉 Chart Signals – Double Bottom Pattern Breakout
Strong bullish candle with heavy volumes.
RSI breakout + CCI strength confirming trend.
Bollinger Band breakout → signals upside continuation.
________________________________________
📍 Key Levels
Resistance: 919 – 938 – 974
Support: 863 – 827 – 808
________________________________________
📈 Investment Outlook
📈 Bullish Case – Why the stock could go up
High-volume breakout (VolX = 3.67x) signals strong participation.
Momentum indicators (RSI 74, CCI 238, Stochastic 98) confirm overbought strength.
Upside potential toward ₹959 – ₹1015 if buying sustains.
📉 Bearish Case – Potential downside risks
Failure to hold above ₹902 could lead to profit booking.
High RSI suggests short-term overbought → risk of pullback.
A break below ₹863 may drag toward ₹827 – ₹808.
⚡ Momentum Case – Short-term Trading Edge
Volume breakout + RSI strength highlight bullish edge.
Bollinger Band breakout points to strong near-term volatility.
Holding above ₹902–919 may fuel rally toward ₹958–₹1015.
📅 Short-term vs Long-term Perspective
Short-term (1–2 weeks): Likely to test resistances 919–974; supports 863–827 remain key.
Long-term (1–3 months): Stock in recovery phase; sustained volumes and trend strength could establish higher base above ₹900.
________________________________________
📝 STWP Trade Analysis
Outlook: Momentum: Moderate, Trend: Neutral
Entry: 902 | Stop-loss: 845.32
Target-1: 958.68 | Target-2: 1015.36
Risk/Reward: 1:6.08 | Risk: High | Volume: High
Demand Zone: 874 – 850.05 | SL: 848.95(Pullback Zone)
Learning Note: SBICARD is showing momentum revival with strong volumes; watch for sustainability above ₹900 to confirm trend continuation.
________________________________________
⚠️ Disclaimer – Please Read Carefully
The information shared here is meant purely for learning and awareness. It is not a buy or sell recommendation and should not be taken as investment advice. I am not a SEBI-registered investment advisor, and all views expressed are based on personal study, chart patterns, and publicly available market data.
Trading — whether in stocks or options — carries risk. Markets can move unexpectedly, and losses can sometimes exceed the money you have invested. Past performance or past setups do not guarantee future results.
If you are a beginner, treat this as a guide to understand how the market works — practice on paper trades before risking real money. If you are experienced, always assess your own risk, position sizing, and strategy suitability before entering trades.
Consult a SEBI-registered financial advisor before making any real trading decision. By engaging with this content, you acknowledge full responsibility for your trades and investments.
💬 Found this useful?
🔼 Give this post a Boost to help more traders discover clean, structured learning.
✍️ Drop your thoughts, questions, or setups in the comments — let’s grow together!
🔁 Share with fellow traders and beginners to spread awareness.
👉 “If you liked this breakdown, follow for more clean, structured setups with discipline at the core.”
🚀 Stay Calm. Stay Clean. Trade With Patience.
Trade Smart | Learn Zones | Be Self-Reliant 📊
Sbicardlong
SBICARD Looks good...SBICARD looks good for reversal in weekly chart.
Can Accumulate between 700-750 zone. Might reach channel upper line in coming years. Targets are given.
Stoploss for longtermInvestors is given.
Note : No idea about fundamentals. View is completely based on technical view of chart.

SBI CARDS & PAY SER LTD looks at bottom, Ready to change trendHello, Everyone I hope you all will be doing well in your life and your investing as well. Here I have brought a stock that looks at bottom and ready to change trend. SBI Cards & Payment Services Ltd is the name of the stock. CMP is 712. Its all time low is 495 and all time high is 1160. Strong support at 680. It made low 655 in June 22, low of 678 in march 24, low of 647 in June 24, low 659 in Oct 24 and 670 in Nov 24. But not closing below that. Upside target as per Fibbo 790, 850, 900, 950, 1040, 1150. Just an assumption. Please do you research. Not a suggestion of buying.
Source: Screener.in
SBI Cards & Payment Services Ltd
About
SBI Cards and Payment Services Limited is a non-deposit accepting systemically important nonbanking financial company registered with the RBI. The Company is engaged in issuing credit cards to consumers in India. It is headquartered in Gurgaon, Haryana. It is a subsidiary of India’s largest commercial bank, the State Bank of India.
Key Points
History
SBI Card was launched in 1998 by the State Bank of India and GE Capital. In December 2017, State Bank of India and The Carlyle Group acquired GE Capital`s stake in SBI Card.In March 2020, SBI Card became the first pure play credit card company to list on the stock exchanges in India.
Largest Credit Card Company
SBI Card, a subsidiary of the State Bank of India, is the largest pure-play credit card issuer in India.
Products
The company offers 3 types of cards: Super Premium (1 card), Core Cards ( 8 cards), and Co-Brand Cards (15 Cards in association with banks, retail and travel partners).
Market Share
Card in Force- 18.9% till Dec 23 compared to 19.1% in FY21
Spends- 18.3% till Dec 23 compared to 19.4% in FY21
Transaction- 17.1% till Dec 23 compared to 19.7% in FY21
Cards in forces stood at 1.85 Cr as on Dec 23 compared to 1.59 Cr as on Dec 22.
Revenue breakup Q3 FY24
Interest Income: 45% (vs 44% Q4 FY22)
Spend based: 29% (vs 26% Q4 FY22)
Subscription-based: 6% (vs 8% Q4 FY22)
Instance-based and others: 20% (vs 22% Q4 FY22)
NPA
Gross NPA: 2.64% in Q3FY24 (Increase 43 bps YoY)
Net NPA: 0.96% in Q3FY24 (Increase 16 bps YoY)
Borrowing Mix
The Co’s funds have diversified sources including Working Capital Demand Loan (69%), Debentures (12%), and Term loan (19%). The share of term loan has increased from 3% while share of NCD dropped from 30% since Dec 23.
New Cards Launches
SBI Cards recently partnered with Reliance Retail to launch Reliance SBI Card focused on lifestyle.
During FY23, the company launched Cashback SBI Card for cashback on all online spend, Aditya Birla SBI Card in partnership with Aditya Birla Finance Ltd for brands under Aditya Birla Group and PSB SBI Card partnered with Punjab & Sind Bank for premium segment.
Changes in KMP
Ahijit Chakravorty took charge as MD & CEO as Mr. Rama Mohan Rao Amara former MD & CEO resigned due to his transfer back to the State Bank of India on August 11, 2023.
Focus
Company will focus on acquiring cards across the diversified sourcing channels which includes open market and SBI customer base across both traditional point of sale as well as digital channels. It aims to increase its digital sourcing and has launched SBI Card SPRINT, an end-to-end digital application process for customers.
This is just to boost my confidence. No Suggestions for buying.
Disclosure: I am not SEBI registered. The information provided here is for educational purposes only. I will not be responsible for any of your profit/loss with these suggestions. Consult your financial advisor before making any decisions.

SBI CARD#SBICARD
stock holds abv the resistance
looking good for buying
weak below 690
upside targets 715-730

SBICARDS#SBICARD (1 Hour Time Frame)
SBICARD is currently at a
major support level and forming an inverse head
and shoulders pattern,
suggesting a potential bullish setup above 703.15.
Please note,
follow strict SL

SBICARD: Preparing for a breakoutSBICARD: LONG TERM INVESTMENT IDEA: Stock listed during corona-crisis and bottomed out in May-2020. After that stock gave a decent return in next one year and made a high of 1165 in Sep'21 when Nifty peaked. From there stock corrected lower and again reached to the listing price range and started showing some early signs of reversal. The current prices action suggests that stock is looking good for new all time high. Buy and hold for long term perspective keeping SL of 600 (Clbs).

sbi cards now open his cards to reached life time high soon Sbin cards i follow last several years something is cooking inside the candle and chart pattern
what is key
1-First he follow fab. point
2- hold 2 down rising channel parallel way which is sign on reversal
3- there is flag on 2021 at the price of 1060 that will reached that price as early as possible
supply zone and resistance at the 820 and 840
FLY zone above 1000
ONLY for the long term holding position
Strong support at 650 and 620
SBI cards jackpot delivery trade taken from my last previous charts like ITI and Voltas which almost double and three times return in really quick time same I expect from the sbi cards charts
now price is 702
TRG 1 - 820
TRG 2 - 920
TRG 3- 1000
above 1000 that will reached to 1220/1420/1620/2000 trg for next 2 year
For shor term share holder SL 620 for long term and medium risk taker 500 is final SL
that all research and parameter those want to learn can contact me on my number [/

SBI CARD BULLISH
SBI CARD is now available to us at very low price.
It broke a major support line and broke out failure.
A channel pattern is farmed as it descends.
This is a very strong demand zone where institutional players and big players are likely to enter.
If a daily candle closes above 710 we can look bullish from here.
First target@770
Second target@880
Stop loss@678
So please keep SBI CARDS in your watchlist for long term investment.
If yoy like my view, do support it with a boost whitch is valuable inspiration for me to post ideas like this in future. thank you friends!
Disclaimer:
I am not a SEBI Registered Analyst. Anything posted here is my own analysis and views. This is created for educational purposes only. Always consult your Financial Advisor before taking any decision or trade.
Happy trading.

GoV sector stock ready for launch 1:10Buy SBI Card Between 750-760
SL 710 (50Rs)
Target 1: 835
Target 2: 875
Target 3: 915
Target 4: 995
Target 5: 1160
Duration 6moths to 1 Year
Closed above 50 SMA with volume, possible reversal .
Trade as per you risk rewards.

SBI CardSupport trendline breakdown in SBI Card on weekly chart. But this looks like a fake breakdown. Confirmation will come around 890.
Disclaimer: Not SEBI registered. Showing analysis for educational purpose only. Consult a SEBI registered research analyst before taking any buy or sell decision.

Small Rounding Bottom More UpsideHii all...
Greetings!
Today sharing with you SBICARDS daily basis charts, a small rounding bottom pattern can been seen around 822 to 865 levels, pattern shows a bullish view from current levels.
Thanking You
Important Things
1. This is only for educational purposes only.
2. Never over trade.
3. Always keep Stop Loss.
4. Trade in limited quantity.
5. Taking a small loss is better than wiping up your whole capital.
I hope you found this idea helpful.
Please like and comment.
Share with Your Friends.
Keep Learning,
Happy & Safe Trading
Disclaimer – These ideas shared by me to all are my personal analysis / views. Im not a SEBI registered technical analysis.

#Nifty #USDINR DoubleBottom needs to breakout?SBI Cards is forming a double bottom . But requires breakout
The could take it to the swing top

SBI Card On Weekly Demand Zone New Study For Paper Trade
Buy SBI Card Near 770-780 (add more at 755-765)
StopLoss :740
Target : 840-900-970
Currently Sbi card is consolidated in one range and also box Pattern applied when box Pattern Break then perfect entry caught.
You can Also buy futures and call option after trend reversal confirmation.
Study Logic
👉 Weekly Demand Zone
Only For Paper Trade And Education Purpose
Don't Real Trade
I am not sebi Registered Here Post is only for Education purpose i am not responsible for any profit and loss.


SBI Card - Looks good for new All Time Highs soon... SBI Card is looking good for very attractive upmove at CMP in days coming which may take it to 1400+
SL 740/-

SBI Card: A good portfolio betSBI Cards is trading at 49PE. A good portfolio bet for 1300+ TGTs in a yearly time frame.

SBICARD- Swing Trade#SBICARD
Buy-Above 750
Sl-700
T-825 890 1100+
A double bottom formed in daily TF.

#sbicard support level NSE:SBICARD
📌 To Trade on This Chart, You Should Have Reversal Trading Knowledge. As Harmonic is One Of The Best Reversal Trading Strategy, But Always Remember That Harmonic Patterns Also Can Fail (there is no holly grail In Stock Market). That's Why One Should Must Have Knowledge Of Reversal Trading To Trade On Harmonic Patterns.
📌 That Dash Line Is Called PRZ, From That Dash Line To that Horizontal Simple Line Area Is Whole PRZ(Price Reversal Zone).


Breakout level after 8 monthsSBICARDS is in a mood to go big after 8 months. Take it as positional for complete november and target till 1400

SBI Cardsgood asending triangle formation on daily chart daily closing abobe 1140-50 levels is good for long position also from 29th oct it is included in fno segment. after closing n sustaining above 1150 it can move 200 points with sl of 1080 on closing basis. equity buy is good for this week.
