Scalping Techniques – A Detailed ExplanationScalping is one of the most intense and fast‑paced trading styles in financial markets. The primary objective of scalping is to capture very small price movements multiple times during a trading session. Instead of aiming for big targets, a scalper focuses on high probability, quick trades, often holding positions for seconds to a few minutes.
Scalping is commonly used in stocks, futures, forex, and options, and it requires discipline, speed, and precision.
Core Concept of Scalping
The philosophy behind scalping is simple:
“Small profits, repeated many times, can build substantial returns.”
A scalper may take 10–50 trades per day, with each trade aiming for a small gain. Losses are cut quickly, and emotional attachment to trades is avoided.
Key characteristics:
Very short holding period
High trade frequency
Tight stop losses
Quick decision‑making
Timeframes Used in Scalping
Scalping relies on lower timeframes, where price moves frequently.
Commonly used timeframes:
1‑minute chart
2‑minute chart
3‑minute chart
5‑minute chart
Higher timeframes (15‑minute or daily) are often used only to identify trend direction, not for entries.
Market Conditions Best for Scalping
Scalping works best when:
The market has high liquidity
There is good volatility
Spreads are tight (important in forex and options)
Best sessions:
Market opening hours
News or event‑driven volatility
Strong trending days
Avoid scalping during:
Very low volume periods
Extremely choppy, random markets
Popular Scalping Techniques
1. Price Action Scalping
Price action scalping relies purely on candlestick behavior, without heavy indicators.
Key tools:
Support and resistance
Trendlines
Candlestick patterns
Common setups:
Breakout from consolidation
Pullback to support in an uptrend
Rejection candles at resistance
This technique requires strong chart reading skills and fast execution.
2. Moving Average Scalping
Moving averages help scalpers identify short‑term trend direction.
Common combinations:
9 EMA and 21 EMA
20 EMA and 50 EMA
Technique:
Buy when price pulls back to EMA in an uptrend
Sell when price pulls back to EMA in a downtrend
Exit quickly near recent highs or lows
This is one of the most beginner‑friendly scalping methods.
3. VWAP Scalping
VWAP (Volume Weighted Average Price) is extremely popular among professional scalpers.
Concept:
Price above VWAP = bullish bias
Price below VWAP = bearish bias
Setups:
Buy near VWAP in an uptrend
Sell near VWAP in a downtrend
Reversal trades when price is stretched far from VWAP
VWAP works best in intraday trading and is widely used in Indian and US markets.
4. Breakout Scalping
Breakout scalping focuses on sudden price expansion.
Key levels:
Pre‑market high/low
Previous day high/low
Range highs and lows
Rules:
Enter only after volume confirmation
Avoid false breakouts
Keep stop loss very tight
This technique can deliver quick profits but also demands discipline.
5. Range Scalping
When the market moves sideways, scalpers trade inside a range.
Approach:
Buy near support
Sell near resistance
Exit quickly at mid‑range or opposite level
Indicators like RSI or Stochastic help confirm overbought or oversold conditions.
6. Indicator‑Based Scalping
Many scalpers use indicators for confirmation.
Common indicators:
RSI (14 or 7 period)
MACD (fast settings)
Bollinger Bands
Stochastic Oscillator
Example:
Buy when RSI pulls back to 40–50 in an uptrend
Sell when RSI moves to 60–70 in a downtrend
Indicators should support price action, not replace it.
Risk Management in Scalping
Risk management is the backbone of successful scalping.
Golden rules:
Risk 0.25% to 1% of capital per trade
Always use a stop loss
Never average losses
Maintain a favorable risk‑reward (even 1:1 is acceptable in scalping)
Because of high trade frequency, small losses can add up quickly if not controlled.
Psychology of Scalping
Scalping is mentally demanding.
Key psychological traits:
Patience to wait for setups
Discipline to follow rules
Ability to accept small losses
No revenge trading
Emotional control is often more important than strategy itself.
Advantages of Scalping
Frequent trading opportunities
Less exposure to overnight risk
Faster feedback on performance
Suitable for traders who enjoy active markets
Disadvantages of Scalping
High stress and screen time
Requires fast execution and low brokerage
Overtrading risk
Not suitable for all personalities
Scalping in the Indian Market
In India, scalping is popular in:
NIFTY & BANK NIFTY
High‑liquidity stocks
Index futures and options
Important considerations:
Brokerage and taxes
Slippage during fast moves
Liquidity at specific strike prices
Final Thoughts
Scalping is not about predicting big market moves; it is about reacting efficiently to small price movements. Success in scalping comes from consistency, discipline, and risk control, not from aggressive targets.
A trader should first practice scalping in simulation or paper trading, then slowly move to real capital with strict rules. Scalping rewards preparation and punishes emotional decisions.
If done correctly, scalping can be a powerful and sustainable trading style.
Scalping

Gold at Make-or-Break Zone | Channel Support Under TestGold is currently trading inside a rising channel and has pulled back toward the lower side of the structure. This move looks more like a healthy correction rather than a breakdown, as long as price continues to hold the marked support area.
If buyers step in near channel support, upside continuation remains possible toward the higher zone. A clear break below support, however, would weaken the structure and shift the bias to the downside. For now, this is a wait-and-react zone, not a chase.
⚠️ Disclaimer
This analysis is for educational purposes only and should not be considered financial advice. Trading involves risk. Please do your own research and use proper risk management.

Gold Price Action Update-Clean Breakout with Clear Targets AheadGold has finally broken above the falling trendline, confirming a short-term shift in momentum. The breakout is clean, and price is now holding above the breakout area, which keeps the bullish continuation scenario active.
As long as price respects the highlighted support zone, pullbacks can be used for long opportunities toward the marked upside targets. A break below the invalidation level would cancel this setup, so risk management remains key.
This is a structure-based trade, not a chase.
KEY LEVELS
Entry Zone: 4671 – 4668
1st Target: 4678
2nd Target: 4684
Final Target: 4690
Stop Loss: 4660
Disclaimer
This analysis is for educational purposes only and should not be considered financial advice. Trading involves risk. Please do your own research and use proper risk management.

Gold Rewards Timing, Not Activity🟡 Gold Rewards Timing, Not Activity ⏳✨
Gold is not a market that rewards constant action.
It rewards waiting, observation, and precise timing.
Many traders believe that trading more means earning more. In Gold, this mindset often leads to overtrading, emotional decisions, and unnecessary losses.
⏱️ 1. Gold Moves in Phases, Not Constant Trends
Gold spends a large amount of time in:
consolidation 🔄
slow accumulation 🧩
controlled ranges 📦
During these phases, price appears “boring,” but the market is actually preparing.
Trading aggressively in these conditions usually means trading noise, not opportunity.
🧠 2. Activity Feeds Emotions, Timing Controls Risk
High activity leads to:
impatience 😤
forced entries 🎯
emotional exits ❌
Good timing, on the other hand, comes from:
understanding context 🧭
waiting for price to show intent 📊
acting only when conditions align ✅
Gold punishes impatience faster than most markets.
🏦 3. Institutions Trade Less, But Trade Better
Large players do not chase every candle.
They wait for:
liquidity to build 💧
weak hands to exit 🧹
price to reach meaningful zones 📍
When timing is right, Gold often moves fast and decisively — leaving overactive traders behind.
⚡ 4. Big Gold Moves Come After Quiet Periods
Some of the strongest Gold expansions begin after:
low volatility 😴
reduced participation 📉
trader boredom 💤
This is why patience is not passive — it is strategic.
🧩 Key Insight
In Gold, doing less at the right time often outperforms doing more at the wrong time.
🎯 Final Takeaway
❌ More trades ≠ more profits
✅ Better timing = cleaner execution
🟡 Gold rewards discipline, context, and patience
Master timing, and activity will take care of itself.

Gold Update: Watching Channel Support for ContinuationGuys last trade of the year haha, let's see if we got something in this trade. Gold is trading inside a rising channel, and the overall structure remains positive. After the recent move up, price has pulled back toward the lower side of the channel, which is a normal and healthy behavior in an uptrend.
This pullback is bringing price closer to a key support area, where buyers have previously stepped in. As long as price holds above this support, the probability favors upside continuation rather than a breakdown.
This is not a breakout trade. It is a buy-on-pullback setup, where patience matters more than speed. A clear hold near support is what keeps this setup valid.
Disclaimer: This analysis is for educational purposes only and should not be taken as financial advice. Please do your own research or consult your financial advisor before investing.
Analysis By @TraderRahulPal | More analysis & educational content on my profile.
If this update helped, like and follow for regular updates.

Gold 15-Min Chart: Previous Support should act as Resistance nowHello everyone, Guy's Gold has made a sharp recovery after the recent drop, but i am expecting gold should take resistance in this area. This level has already shown rejection in the past, making it a critical decision area for the market.
The rejection near this zone suggests that sellers are still active. If Gold fails to sustain above this resistance, a pullback toward the lower support areas is likely. Such pullbacks are normal after strong impulsive moves and often provide better clarity for the next direction.
As long as price stays below this resistance, upside looks limited in the short term. A clean breakout and hold above this level is required to shift the bias back to bullish.
Disclaimer: This analysis is for educational purposes only and should not be taken as financial advice. Please do your own research or consult your financial advisor before investing.

Gold After Liquidity Grab: Short side intraday move, R you readyHello Everyone, let's analyse Gold as this once again tested a major resistance zone, but instead of giving a clean breakout, price briefly moved above the level and then quickly reversed. This move was not strength, it was a liquidity grab.
In simple words, smart money pushed price above resistance to trap breakout buyers, collect their stop-loss liquidity, and then bring price back into the range. This is why price failed to hold above the highs and started showing weakness soon after.
Right now, Gold is trading back below resistance, which keeps the short term bias cautious to bearish. If selling pressure continues, price may slowly rotate toward the lower support / demand zone, where buyers could appear again.
This chart is a good reminder that not every breakout is real. Waiting for confirmation always matters more than speed.
Disclaimer: This analysis is for educational purposes only and should not be taken as financial advice. Please do your own research or consult your financial advisor before investing.
Analysis By @TraderRahulPal | More analysis & educational content on my profile.
If this helped you understand price behavior better, like, follow, and share your view in comments.

Scalping Bank Nifty: Strategies, Techniques, and Risk Management1. Understanding Bank Nifty
Bank Nifty is the Nifty Bank Index, representing the 12 most liquid and large-cap banking stocks listed on the NSE. Its movements are heavily influenced by:
RBI monetary policies
Inflation data
Interest rate changes
Banking sector earnings and news
Global financial market movements
Because of its volatility, Bank Nifty is ideal for intraday trading strategies like scalping. It typically moves in a wide price range within a trading day, offering multiple opportunities for profit if trades are executed correctly.
2. Basics of Scalping
Scalping focuses on small, frequent gains rather than holding positions for long-term appreciation. Key elements of scalping include:
Timeframe: Usually 1-minute, 3-minute, or 5-minute charts.
Trade duration: Seconds to a few minutes.
Target profit per trade: Often between 10–50 points in Bank Nifty.
Stop loss: Tight stops, often 5–20 points.
The goal is consistency rather than large single-trade profits. Scalping thrives on high liquidity and minimal spreads, both characteristics of Bank Nifty.
3. Key Tools and Indicators for Scalping Bank Nifty
Successful scalpers rely on a combination of technical indicators, market analysis tools, and chart patterns:
a. Moving Averages (MA):
5 EMA and 20 EMA are commonly used.
Buy signals occur when the short-term EMA crosses above the long-term EMA, and sell signals occur on the reverse.
b. Bollinger Bands:
Identify overbought and oversold conditions.
Scalpers can enter trades when price touches the lower or upper band and exits when it reverts to the mean.
c. Relative Strength Index (RSI):
Measures momentum; scalpers often use 14-period RSI on 1-minute charts.
Overbought >70, Oversold <30 signals help time entry and exit.
d. MACD (Moving Average Convergence Divergence):
Detects trend direction and momentum.
Quick crossovers of MACD line over signal line provide short-term trade opportunities.
e. Market Depth & Order Flow:
Scalpers monitor the live bid-ask spread to anticipate price moves.
Large orders or imbalances can indicate short-term reversals or breakouts.
4. Scalping Strategies for Bank Nifty
Several popular strategies exist for intraday scalping:
a. Trend-Following Scalping:
Enter trades in the direction of the short-term trend.
Use EMAs or moving averages to confirm trend.
b. Range-Bound Scalping:
Works during low volatility sessions.
Identify support and resistance levels and trade bounces between them.
c. Breakout Scalping:
Exploit sudden price moves when Bank Nifty breaks key intraday levels.
Confirm breakout with volume and momentum indicators.
d. News-Based Scalping:
Intraday trades triggered by economic news or RBI announcements.
Requires rapid execution and awareness of market-moving events.
5. Risk Management in Scalping
Because scalping involves frequent trades with tight stops, risk management is critical:
Capital Allocation: Never risk more than 1–2% of capital per trade.
Stop Loss: Always predefine and strictly follow.
Trade Frequency: Avoid overtrading; quality over quantity.
Exit Strategy: Know your target points and exit at predefined levels.
Psychological Discipline: Avoid emotional trading, as rapid losses can compound quickly.
6. Choosing the Right Brokerage and Platform
Scalping demands low-latency platforms with fast order execution. Key features include:
Real-time market data
Minimal lag and downtime
Advanced charting tools
Direct market access (DMA) for speed
Popular brokers for Bank Nifty scalping include Zerodha Kite, Upstox Pro, Angel Broking, and ICICI Direct.
7. Common Mistakes in Bank Nifty Scalping
Overleveraging positions
Ignoring market news
Trading against the trend
Holding losing trades for too long
Lack of predefined entry and exit rules
Learning from mistakes is essential for long-term profitability. Scalping requires a combination of skill, discipline, and constant market awareness.
8. Psychological and Emotional Aspects
Scalping is mentally demanding:
Constant attention to charts
Quick decision-making under pressure
Managing stress from rapid wins and losses
Successful scalpers often take breaks between sessions and maintain a trading journal to analyze performance.
9. Backtesting and Practice
Before trading live, scalpers should:
Backtest strategies on historical Bank Nifty data
Use paper trading or demo accounts
Track performance metrics such as win rate, average profit/loss, and drawdown
10. Conclusion
Scalping Bank Nifty can be highly profitable, but it demands skill, discipline, and the right tools. By combining technical analysis, market awareness, and strict risk management, traders can capitalize on short-term price movements while minimizing losses. Scalping is not suitable for everyone—it requires dedication, focus, and the mental fortitude to handle rapid market changes.
When executed correctly, Bank Nifty scalping can become a consistent source of intraday profits, leveraging India’s most liquid index for high-frequency trading opportunities.
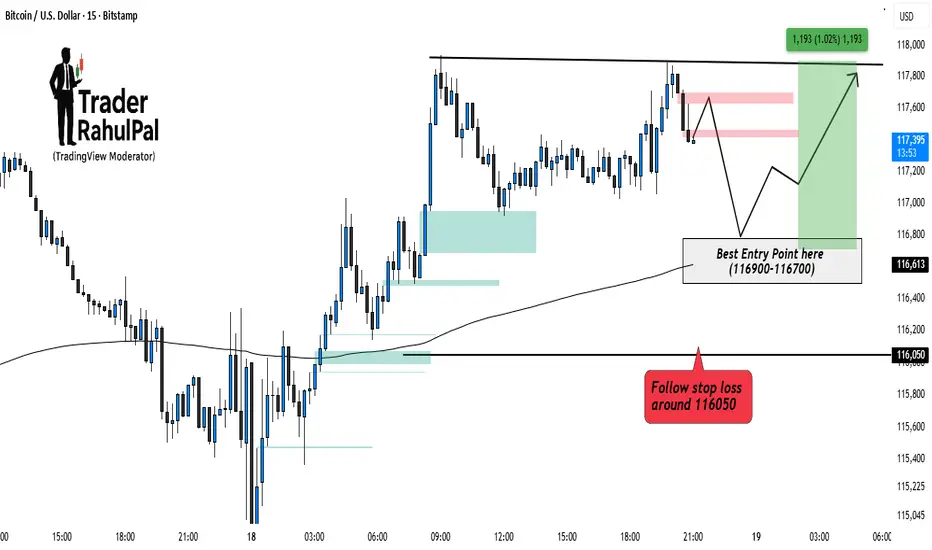
Bitcoin Bullish side Entry Setup Intraday – Key Levels to Watch!Bitcoin is consolidating near its upper resistance zone after a recent bounce. Price action suggests that a pullback into the 116900–116700 range can offer a high-probability entry for buyers. Maintaining a stop loss around 116050 helps to protect against deeper downside risk. As long as this zone holds, the bias remains bullish, with potential upside toward 117800–118000 . Intraday traders should closely watch how price reacts around the entry zone before positioning.
Disclaimer: This analysis is for educational purposes only and should not be taken as financial advice. Please do your own research or consult your financial advisor before investing.
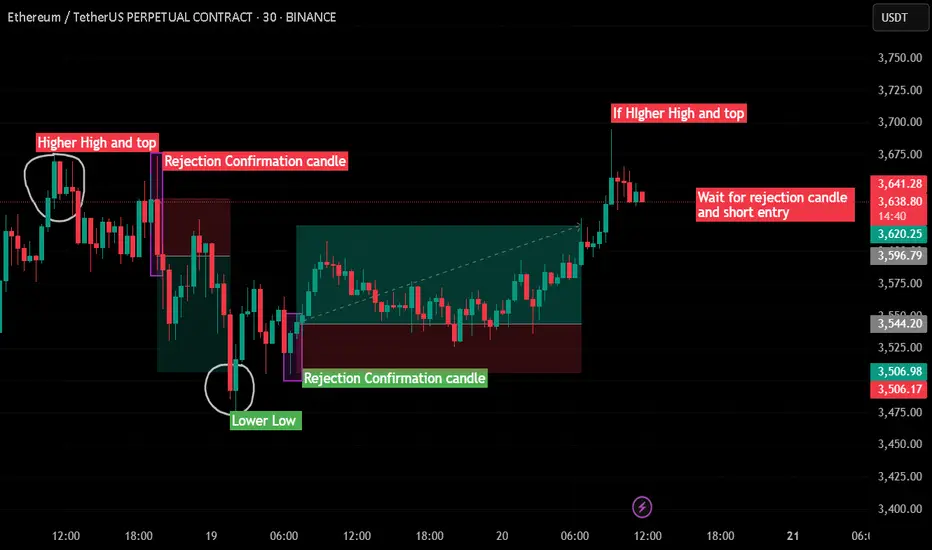
Trend Reversal Rejection Strategy | Higher High + Candle Confirm🔍 Idea Summary:
This strategy focuses on identifying trend reversal zones using classic Higher High (HH) and Lower Low (LL) structures followed by rejection confirmation candles.
🔻 Short Setup:
Price forms a Higher High.
Wait for a rejection candle (long wick, body closes inside previous range).
Confirm structure break and take short entry on confirmation.
✅ Example: On the left side of the chart, price printed a HH, followed by a strong rejection candle. That led to a clean move downward.
🔺 Long Setup:
Price forms a Lower Low.
Watch for a rejection candle near key support.
Enter long trade after confirmation.
✅ Example: Mid-chart shows price breaking to LL, then instantly rejecting with a strong bullish candle. Followed by a sustained move up.
🔴 Current Price Action:
Price is testing a potential new Higher High.
📌 Strategy suggests: Wait for a bearish rejection candle before shorting!
📈 Strategy Benefits:
Avoids impulsive entries
Combines structure with candle logic
Great for reversal traders and range scalpers
🔥 Like & follow for more real-time trading ideas!
💬 Drop your thoughts or questions below – let’s grow together, traders! 💪
#ETHUSDT #PriceAction #RejectionCandle #TrendReversal #SupportResistance #Scalping #TradingStrategy #Crypto #ChartPatterns #TechnicalAnalysis
BREAK OUT GOLD On H1 frame, gold has signs of breakout, so pay attention to the support area 3342
XAUUSD BUY Zone: 3341 - 3343
Stoploss: 3337 (60pips)
Takeprofit: 3346 - 3350 - 3354

Gold XAUUSD Trading Strategy on July 17, 2025:
Yesterday's trading session was as we expected when the gold price adjusted from the 334x area, however, the gold price did not approach 3300 as we expected for a long-term trading point.
Basic news: News that President Trump considered firing FED Chairman Jerome Powell caused the USD to plummet, gold prices to skyrocket and stocks to fall. The US PPI and core PPI last month both recorded a 0% increase, lower than the forecast of 0.2% and the previous period's level of 0.1%. Data showed that inflationary pressure from the manufacturing side continued to cool down.
Technical analysis: After adjusting from the 334x area and approaching the nearest bottom of 3320, the gold price immediately increased sharply. RSI on the H1, H4 and D1 time frames crossed the average line, showing a renewed uptrend. Currently, the higher bottom pattern is compressing at the 3320 - 3357 border. If the price breaks this compression zone, it will fluctuate very strongly.
Important price zones today: 3325 - 3330, 3352 - 3357 and 3300 - 3305.
Today's trading trend: BUY.
Recommended orders:
Plan 1: BUY XAUUSD zone 3325 - 3327
SL 3322
TP 3330 - 3340 - 3360 - 3380.
Plan 2: BUY XAUUSD zone 3300 - 3302
SL 3297
TP 3305 - 3315 - 3335 - 3360.
Plan 3: SELL XAUUSD zone 3355 - 3357
SL 3360
TP 3352 - 3342 - 3332 - 3322.
Wish you a safe, successful and profitable trading day.🌟🌟🌟🌟🌟

XAUUSD – Gold Sideways, Awaiting Key Economic DataXAUUSD – Gold Sideways, Awaiting Key Economic Data: Will We See a Correction or Continued Uptrend?
🌍 Macro Overview – Waiting for Key CPI Data from the US
Currently, Gold is moving sideways in a wide price range (from the 3x price levels to 4x), awaiting important economic data this week from USD, GBP, AUD, and EUR.
📊 Key Economic Data Today:
The US CPI report will be released during the US session, one of the most crucial reports of the month.
CPI forecast is positive at 0.3%, which is considered a good sign for the US economy.
This data is expected to align with the recent Nonfarm results and could lead to a strong price movement at the time of the announcement, potentially helping to sweep liquidity.
🔍 Technical Analysis – Uptrend with Key Resistance
The current trend is still upward, but the movement on larger timeframes is not as strong.
Key resistance lies between 337x and 339x, where SELL orders are currently dominant.
If price breaks through these levels, Gold may find support to move towards 3400.
📈 Short-Term Forecast:
A pullback to around 333x is expected, providing a good BUY opportunity.
Looking further, 331x could be a possible target as the price range remains wide.
🎯 Trading Strategy for Today
🟢 BUY ZONE: 3331 – 3329
SL: 3325
TP: 3335 → 3340 → 3345 → 3350 → 3360 → 3370 → ????
🔴 SELL ZONE: 3392 – 3394
SL: 3398
TP: 3388 → 3384 → 3380 → 3376 → 3370
⚠️ Important Notes:
Watch for support and resistance levels to set up suitable Scalping trades according to the trend.
Follow the TP and SL to protect your account, and avoid FOMO when there's no confirmation.
The 3350 – 3347 range is a key zone for entering BUY trades early.
💬 What do you think about Gold’s movement today? Do you believe it will break above the resistance, or will we see further correction? Drop your thoughts in the comments below and join the discussion with fellow traders!
👉 If you’re looking for more daily updates and live discussions, don’t forget to follow and be part of our community! Let’s make the most of these market opportunities together.

Nifty 23rd directionExpecting Nifty to draw to 24735
tomorrow
The gap lower at 24402 could
serve as a place for very good longs
My eyes are on 24725 to be traded to
tomorrow preferably at open

Nifty 22nd Draw Although long term view is bullish
I will be looking for 24667 and 24600
The gap at 24404 may also be filled before
the long term view... Expecting
T1 T2 tomorrow
Induslnd bank will tank due to poor results
which will cause pressure on banks

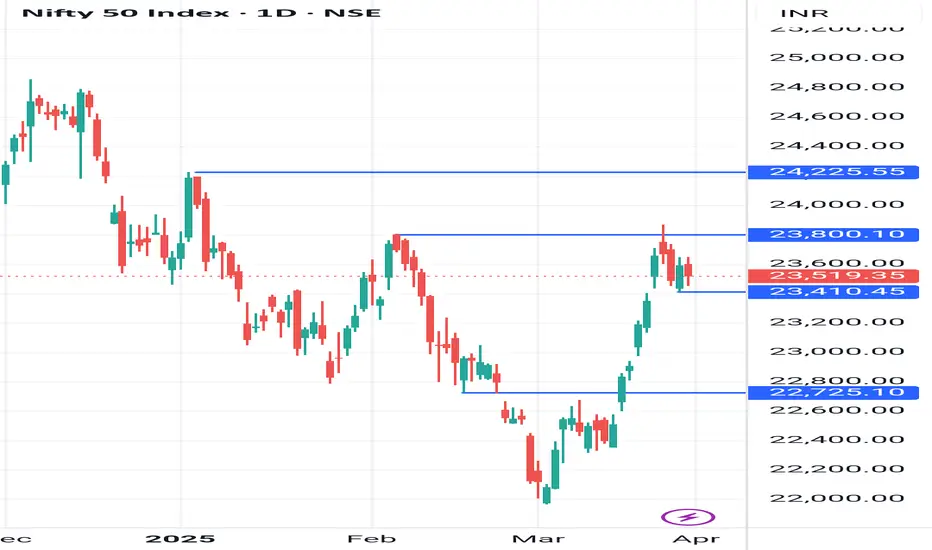
Bullish or Further crash! What next after March? Now here it will be a little confusing for many people 🤔 that is this recovery real that the market can go up again or not. 📉📈
See, if the market has to go up, according to me, the best case scenario is if the market goes above 23800, then only I will be a little more bullish in the market. 🚀 The reason being is such a small pullback that I will not look to buy heavily in longs.
No doubt a good bullish candle has been made in the market today 🔥, but there is also resistance here ⚡. In fact, when the momentum will come, you just think, when this double top kind of break will happen, then how good momentum will come in the market. 💥
So here maybe the market can spend a little more time or maybe it can go down more, you can say to give more pullback. ⏳ This can go to the whole region, ie. pullback can extend up to 23800. But it is not necessary that it comes in a day or two. ⏱️ You never know. But if the market spends time here, then it becomes a little easy for us because the market can try to break out from here. 🌟
And once 23800 breaks out, that is your best level to add longs. 📈 Then the trend of the market will also change to bullish, I am saying major trend. 🏹 So we will wait for the market.
For now, I am not trusting today's candle 🔥 because today was quarter end 📅, month end 📆, plus financial year end 🏦, so there will be a lot of buying in the market. So today's candle is not trustworthy according to me. ❌
So tomorrow or at least the next two trading sessions, because Monday is a holiday 🕌, because it is Eid. 🕋 So we will see the candles of the next two trading sessions, we will observe what is happening. After that, we will make a good view. 👀
For now, it is a cautious approach, both sides, long side ⬆️ short side ⬇️, start with a cautious approach, do not trade in heavy quantities ⚖️, until 23410 or 23800 does not break.
Word of caution ⚠️, whenever we get clarity on what the market will try to do, then only we will trade. We will let the move of 1-2 days go or trade in less quantity. Nothing is going to happen. Remember this. 📊✈️
Scalping vs. Swing Trading: Which One is Better for You?Hello Traders!
Today’s topic is one that often sparks debate in the trading community: Scalping vs. Swing Trading. Both strategies have their unique strengths and challenges, and the choice between them largely depends on your trading style, time availability, and risk tolerance. Let’s break down the key differences to help you decide which approach may be better suited for you!
Scalping: The Fast-Paced Trading Strategy
Scalping is a trading strategy that focuses on making small profits from small price movements throughout the day. Traders who engage in scalping, also known as scalpers , typically execute multiple trades in a short period, often holding positions for just a few minutes or even seconds.
Key Characteristics of Scalping:
Short Holding Period: Scalpers hold positions for seconds to minutes, looking to capitalize on small price fluctuations.
High Frequency of Trades: A scalper executes many trades in a day, potentially dozens or hundreds, depending on market conditions.
Low Profit per Trade: While scalping, the profit per trade is small, but the cumulative returns can be substantial if executed consistently.
Requires Fast Decision-Making: Scalpers need to make quick decisions, as they operate in fast-moving markets.
Low Time Commitment per Trade: The time spent on each individual trade is short, but scalping requires constant attention to the markets throughout the trading session.
Swing Trading: The Mid-Term Strategy
Swing trading involves holding positions for a few days to weeks to capture larger price movements. Swing traders aim to take advantage of market “swings” or trends, rather than focusing on small fluctuations like scalpers.
Key Characteristics of Swing Trading:
Medium Holding Period: Positions are typically held for a few days or weeks to capitalize on medium-term price swings.
Fewer Trades per Day: Swing traders typically make fewer trades compared to scalpers, often only executing trades a few times per week.
Larger Profit per Trade: While the profit per trade is larger, swing traders can also face greater risk as positions are held for longer periods.
Trend-Following Approach: Swing traders often look to trade in the direction of the prevailing trend, using technical indicators to identify potential entries and exits.
More Time Between Trades: Swing traders don’t need to monitor the markets constantly like scalpers; they can afford to check their positions less frequently.
Which One is Better?
There is no clear-cut answer to which strategy is better—it depends on your personal preferences, lifestyle, and risk tolerance. Let’s compare them:
Scalping
Best for Active Traders: If you enjoy being constantly engaged with the market and have the time to dedicate to making quick decisions, scalping might be ideal for you .
Requires Quick Reflexes and a High Level of Focus: Scalping can be intense, as you need to react quickly to price movements.
Lower Risk per Trade, But High Frequency of Trades: While the risk per trade is small, the frequent trades can accumulate fees or slippage that impact overall profitability.
Swing Trading
Best for Less Active Traders: Swing trading is ideal if you don’t have time for constant monitoring but still want to take advantage of market movements.
Better for Those Who Can Handle Larger Price Moves: Swing traders need to be more patient and prepared for larger price swings.
More Time Between Trades, More Time for Analysis: Swing traders can dedicate more time to research and analysis before entering positions.
Conclusion:
Ultimately, scalping and swing trading are two effective strategies with their own strengths and weaknesses. Scalping suits fast-paced traders who thrive on constant action, while swing trading is better for those looking for a more relaxed, mid-term approach . Your choice should depend on your trading personality, time commitment, and comfort with risk.
What’s your preferred strategy? Scalping or Swing Trading?
Let me know your thoughts in the comments below! Happy trading!

NIFTY Pattern (POLE and Flag Pattern) 24900/243501. If Nifty successfully crosses the 24680/690 level then the coming targets will be 24855 and 24980 as per Pole and Flag pattern
2. But if it fails (POLE and Flag pattern Failed) and the Nifty breaks below 24590/570, then the coming targets will be 24370 and 24280.
Advice:
1. If you are doing future then take the option as hedge.
2. If you are doing Option selling, take option buying as hedge.
3. Naked option buyers please take both CALL and PUT for safer side.(So, your total will be more then buying price)
Imp. Note: This analysis is provided for informational purposes only and does not constitute a direct recommendation to buy or sell stocks. Investors should conduct their own research and consult with financial advisors before making any investment decisions, as market conditions and individual circumstances may vary.
Market Risk: However, it's important to acknowledge the inherent risks associated with investing in the stock market, including but not limited to volatility, economic downturns, regulatory changes, and unforeseen events that can impact stock prices. It's crucial for investors to remain vigilant and diversify their portfolios to mitigate potential losses

Nifty on Radar - 10 JuneThe price has formed a Gravestone Doji candlestick pattern on the top of an uptrend.
If the low of 23,227 is broken then the probability of a next red candle is high.
Disclaimer : This is my pre market analysis and my trading journal. Not a suggestion to buy or sell.

PNB, Intraday View for 7-JuneThe price is rejected by the LTMA band.
The probability of a red candle is high, more than 60% on the probability scale.
The level of 120.75 is important to consider for tomorrow's intraday trade.
Disclaimer : This is my pre market analysis and my trading journal. Not a suggestion to buy or sell.

Nifty Institutional levels | Intraday 6-JUNE-2024 | 9:15 IST#Optionbuyers
#Niftyoptionscalping
1) Zones you always Like:-
Green zone- institutional support
Red zone - institutional resistance
Gap between institutional zones is always of 100 points
Zone making is helped by pivot points and Fibonacci
Advance version of price action
2) Trade Execution:-
Trade based on order flow data
Timeframe - 1 min
Risk Reward Ratio always 1:2
Strike price always ATM & slightly ITM
Position sizing
3) House Rules in trading:-
Sharp at 9;15 AM
Priority to risk management
Fast execution (morning breakfast)
Stop-loss 10 points (strictly)
#ThankU For Checking Out Our Content , We Hope U Liked IT 📌
🙏FOLLOW for more !
👍LIKE if think is useful !
✍️COMMENT Below your view !

BANK NIFTY MARCH MONTH EXPIRY ANALYSISBankNifty Important Levels for March Month Expiry:
=> Naked Buyer Strategy:
CALL Side:
Buy Above: 47040.
Put Stop Loss: 46950.
Targets: 47130, 47203, 47288, 47368 and 47423.
PUT Side:
Sell below: 46800.
Stop Loss: 46880.
Targets : 46720 ,46650, 46570 and 46474.
=> Hedging Strategy:
UP SIDE:
Sell 47300/47400 PUT (Premium price 500-570) & Hedge with 46400 PUT (Premium price 100).
DOWB SIDE:
Sell 46400/46300 CALL (Premium price 550-630) & Hedge with 46430 PUT (Premium price 130).
=> Sell Strangle Strategy:
Sell 46400 CALL and Parallelly Sell 47400 Put.
Note: Do Trading after the Level break and use Strict Stoploss.

My thoughts on GBPUSD 15th Jan 24I think it will emulate the same movement as NZDUSD and GBPUSD that I shared a while ago. Setup risk:reward: 3.3
