Search in ideas for "AMAZON"


AMAZON BEARISH VIEWAmazon is anticipated to be in wave 5 of primary degree, nearing its conclusion. A potential decline from the current market price to the range of 115 - 100 is expected.

AMAZON BEARISH VIEWAmazon is near the end of a major rally cycle. We're currently in wave 5 of cycle degree, within wave 5 of primary degree. Anticipating a decline to a range of 90 - 70 once wave 5 of cycle degree is complete.

Amazon (AMZN) Stage AnalysisAmazon weekly TF chart.. Stage Analysis.
Only for educational purposes, not a recommendation.

Amazon Stock Consolidating for 300+ days. Huge breakout expectedAmazon Stock Consolidating for 300+ days. Huge breakout expected

Amazon AMZN Analysis :- 04-12-2020Amazon AMZN Looking Bullish Go For Buy Trade.
NOTE :- Nasdaq Composite Looking Bearish. on 04-12-2020


AMAZONCMP 1874.97
Bullish above 1903 Amazon (My recommended Point).
Till 1854 accumulation level for Early birds with CMP.
SL 1830 Close Base
Target : 1974, 2036, 2122+
Risk is yours and Reward is too yours.

AMAZON Long Buy 1600-1620 and take Profit 2000As You Know AMZN Falling very fast and trying to reached on support level Around 1600.
then we have a great opportunity for long Buy Position Between 1600-1620 and take profit 2000.
Becoz As You know AMAZON is a Biggest and Fastest Growing Company in the World..
Let c .....
Stay Tuned.....!!
Learn Here , Earn EveryWhere

AMAZON ON SELL SIDESELL AMAZON AT CMP 1545-50 RANGE SL 1570 ABOVE ON CLOSE WITH AND TGT AT THE LOWER END OF THE BOX I.E 1280 NEAR

AMAZON Chart analysis on Monthly time frameDescription posted in chart amazon on critical monthly trendline support

Amazon on shot high selling pressureThe chart depicts the weekly price movement of Amazon (AMZN) stock from 2022 to mid-2025, with a focus on a recent period around June 2025. Here’s an analysis based on the provided chart:
Historical Trend: The stock experienced a significant upward trend from 2022 to mid-2024, showing consistent growth with periodic corrections. This suggests strong bullish momentum over the long term.
Major Support Level: A key support zone is identified around the $916.18 to $919.18 range (highlighted in red). The price recently approached this level and appears to have found support, as indicated by the stabilization and slight upward movement after testing this zone.
Recent Price Action: After reaching a peak near $1,000, the stock experienced a sharp decline, entering a consolidation phase within a descending triangle pattern (highlighted in light blue). The price recently broke below the lower trendline of this pattern, suggesting potential bearish momentum.
Projected Movement: The chart includes a downward projection (blue arrow) indicating a possible further decline toward the $616.74 to $650.00 range if the bearish trend continues. This could represent a deeper correction or a test of a lower support level.
Volume and Indicators: The chart shows Bollinger Bands (BVC 880,260 H90,000 L85,200) and a closing price of $852,740 with a -29,380 (-3.33%) change, indicating increased volatility and a recent downward shift. However, specific volume or momentum indicators are not detailed enough for a precise assessment.
Outlook: The stock is currently at a critical juncture. If the $916.18 support holds, it may signal a reversal or consolidation. A break below this level could lead to a more significant decline toward the projected $616.74-$650.00 range. Monitoring price action around the support zone will be key.


AMAZON.COM Daily Candle AnalysisAMAZON.COM Daily Candle Analysis
daily candle looks that there is a good buying around 95 stop loss 90 for the target of 103 and 108
--------------------------------------------
in a long term chart its trading in a Down Trend so around 108 according to price action
we can take short position

Investment_ AmazonNamaste!
Amazon has corrected enough to look attractive to value investors. VI basically mean they will look for:
1. Low P/E ratio,
2. An long term up-trending stock (Amazon is that),
3. Fear in the markets, Etc.
Investors like Warren Buffet doesn't buy when the market is at all time high and people think it will keep going up in a straight line.
He and other value investors wait for an opportunity, when there is fear and it results in considerable fall in the stock prices. It's when they come in.
For Amazon, I can say with 100% confidence, value investors must be jumping in. This opportunity (because of correction) is rare and happens in 4-5 years approx. They are smart people and following them is a smarter decision. Amazon is definitely a buy, at current prices or at break of 118.
The most important rule in Investing is, never ever sell at a loss. There are only two possibilities in my opinion, either the company goes bankrupt, or you make money.
Disclaimer: Investment carries an element of financial risk. Investment does not guarantee a fixed return due to volatile nature of markets. Please do your due-diligence before investing. You are solely responsible for your decisions.

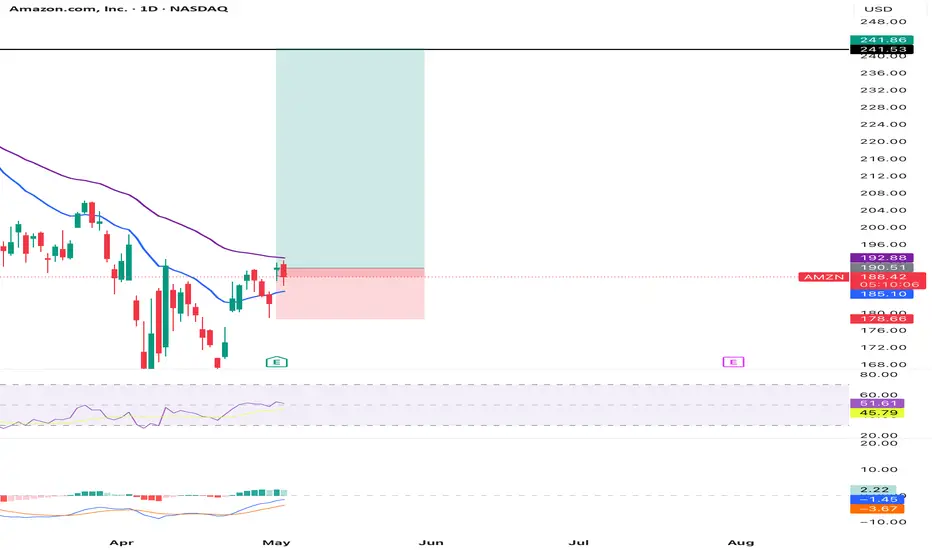
Amazon (AMZN) Swing Trade Analysis## Amazon (AMZN) Swing Trade Analysis
**Timeframe: 4H Chart (as per your screenshot, May 2, 2025)**
---
### **Technical Overview**
#### **1. Price Structure**
- **Trend:** The chart shows a recent reversal from a downtrend, with price making higher lows and attempting to break resistance around $190–$192.
- **Support:** Strong support is visible near $178.66 and a major support at $162.49.
- **Resistance/Target:** The green zone targets the $241.53–$241.86 area, which is a previous supply/resistance zone.
#### **2. Indicators**
- **RSI (Relative Strength Index):**
- Currently around 57–58, which is neutral-bullish and not overbought.
- Indicates there’s still room for upside before becoming overbought (>70).
- **MACD:**
- Bullish crossover recently, with the MACD line above the signal line and positive histogram.
- Suggests momentum is shifting to the upside.
#### **3. Risk/Reward**
- **Entry:** Around $189.67 (current price).
- **Stop Loss:** Below $178.66 (recent swing low/support).
- **Target:** $241.53–$241.86 (previous resistance).
- **Risk/Reward Ratio:**
- Risk: ~$11 (from $189.67 to $178.66)
- Reward: ~$52 (from $189.67 to $241.53)
- **R:R ≈ 1:4.7** - Excellent for swing trading.
#### **4. Volume & Volatility**
- Amazon is highly liquid, ensuring good fills and manageable slippage.
- The volatility is suitable for swing trading, with clear price swings and defined levels.
---
### **Why AMZN is Suitable for Swing Trading Now**
- **Clear Reversal Structure:** The downtrend has paused, and higher lows are forming-a classic swing setup.
- **Defined Support/Resistance:** Well-established levels allow for precise stop and target placement.
- **Strong Risk/Reward:** The setup offers a high R:R ratio, which is ideal for swing trades.
- **Momentum Confirmation:** Both RSI and MACD support a potential bullish move.
- **No Immediate Overbought Signal:** RSI is not yet overbought, so there’s room for the trade to develop.
- **Earnings Passed:** The last earnings event is behind, reducing the risk of surprise volatility.
---
### **Potential Risks**
- **If price fails to break $192–$195 resistance, a pullback to support ($178.66) is possible.**
- **Broader market weakness or negative news could invalidate the setup.**
- **Always use a stop loss as planned.**
---
## **Conclusion & Recommendation**
**Yes, AMZN is a strong candidate for a swing trade at this moment.**
- The technicals, risk/reward, and liquidity all align for a textbook swing setup.
- Enter above $190 with a stop below $178.66 and target $241+.
- Monitor for confirmation of breakout above $192–$195 for added conviction.
**(As always, manage your position size and risk according to your prop firm’s rules!)**
---
**Would you like a similar analysis for any other stock?**
Sources
image.jpg pplx-res.cloudinary.com


AMAZON : ASCENDING CHANNEL TRENDAMAZON : ASCENDING CHANNEL TREND
As Per Chart Pattern Price Can Hit 3900 Level soon and Stoploss 3250

AMAZON Break and retest the trendlineAmazon has broken the trendline in 1D time frame. It has retested the levels and now is continuing the downtrend.

Amazon on bullish side .amazon was in consolidation period but right now it is in bullish side. u can buy this stock right now for positional trade
