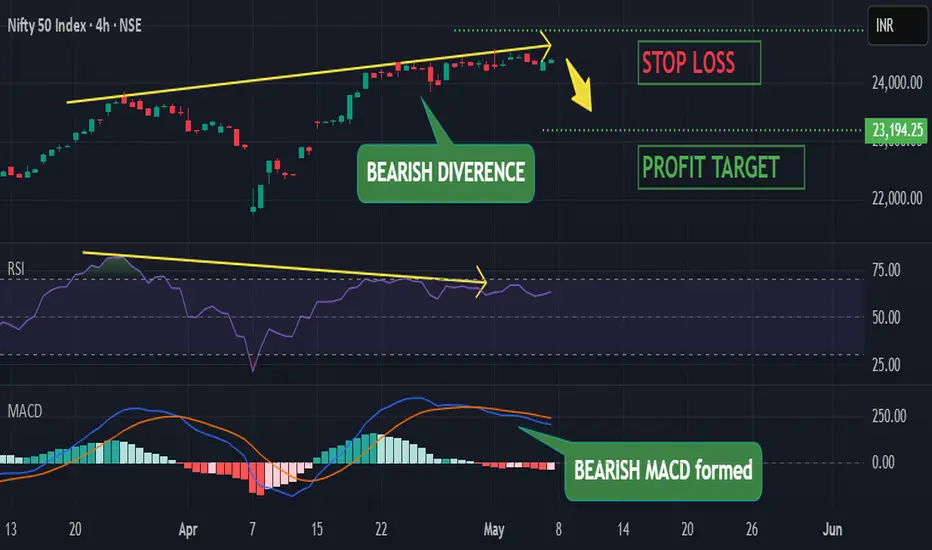
NIFTY : Very bearish due to forming Bearish Divergence pattern
BEARISH DIVERGENCE -
Market has formed a higher high on the chart whereas rsi has formed a lower high which indicates a bearish divergence pattern. This indicates upcoming market fall
Bearish Divergence forms when market forms higher high & rsi forms lower high
BEARISH MACD -
The macd line recently crossed below the signal line inside the macd indicator forming bearish macd crossover. Market is likely to fall in the upcoming days due to this bearish signal
MACD indicator is the combination of 2 lines - macd line is the difference between 26-period & 12-peroid EMA & signal line is the 9-period EMA of macd line
INVERTED HAMMER CANDLESTICK -
On daily timeframe NSE:NIFTY has formed a bearish candlestick pattern called "Inverted Hammer". it indicates reversal of the ongoing trend and beginning of the opposite trend ie bearish trend here.
Inverted Hammer candlestick is formed when a candlestick has long upper shadow & smaller body at the bottom
PROFIT TARGET -
target is 23194.25
STOP LOSS -
24908.05
Search in ideas for "CANDLESTICK"
GOLD FUTURE - BULLISH PRICE ACTIONBullish price action refers to a series of price movements and candlestick patterns in a financial market that indicate an upward or bullish trend is likely to continue or emerge. Here are some common signs of bullish price action:
1. Higher Highs : In an uptrend, each successive high should be higher than the previous one, demonstrating an upward momentum in prices.
2. Higher Lows : Similarly, each low in an uptrend should be higher than the preceding low, indicating that buyers are willing to step in at higher price levels.
3. Bullish Candlestick Patterns : Look for bullish candlestick patterns like bullish engulfing patterns, hammer, morning star, or doji reversals, which can suggest a potential shift in momentum to the upside.
4. Support and Resistance : When price breaks above a significant resistance level or a moving average, it can be a strong bullish signal.
5. Volume Increase : Increasing trading volume as prices rise is often a confirmation of a bullish trend.
6. Trendlines : Drawing an upward-sloping trendline connecting the lows can help visualize the bullish trend.

AXIS BANK: Three Black CrowsStock has witnessed selling pressure from the previous swing resistance on the daily chart and formed a Bearish reversal candlestick pattern which is know as Three Black Crows. Prices have also broken the rising trend line established from Jun'22 low of INR 618.25 which suggest that prices may face more weakness in the coming days.Hence any retracement from the current level should be taken as selling opportunity for the downside objective of 700 zone which is fibonacci 61.8% retracement level of the previous rally.
In the Three Black Crows Candlestick Pattern, all the three candles have bearish close consecutively.
Each candle opens and closes progressively lower than the first.
Each candlestick should have big real bodies and very small or no shadow.
Trading strategy: Sell on rise near 760-770 keeping SL of 794 and look for the target of 720/694

Why I choose Heikin Ashi Over Regular candlestick Part 2
1. The first interpretation is the color of Heikin Ashi candle. If the candle is showing Red color then it means that bears are taking control. As told earlier Heikin Ashi is Averaged candlestick if Heikin Ashi candle showing Red candle means it’s clearly indicating Selling Pressure. Same in case of Green Heikin Ashi candle its showing Bulls are in control and indicating Buying Pressure.
2. Second interpretation is about Wick/Shadow/Tail. If the candle is red and does not have UPPER wick then it's indicating huge Selling Pressure. Same is for Green Heikin Ashi candle if candle does not have a wick on LOWER side then it's indicating huge Buying Pressure. And if there is wick on both sides its indicating confusion between Bulls and Bears and we have to wait for completion of Next candle.
3. Third and most important interpretation in my view is Heikin Ashi candlestick pattern. Heikin Ashi only has two candlestick patterns first is DOJI and second one is Spinning Tops/Spinning Bottoms. If Doji or Spinning top or both appears at top one should be cautious it may be indicating Trend Reversal it may be short or long. Same in case of Doji or Spinning Bottom or both at the low indicating Trend Reversal.
Now one of the most important question arises does Heikin Ashi supports Trend Lines, Indicators, Breakouts. The Answer is Yes it supports all things Trendlines, Indicators, Breakouts. One of the most interesting thing about Heikin Ashi is that as the closing price is average price and maximum indicators value calculated using closing price as a result, the chances of giving false Signal reduced. That’s it for this article I hope you will get some idea Heikin Ashi from this article.
Note - > I forgot to mention one important thing next Heikin Ashi candle is always starting from the middle of the previous candle.
One thing you should always keep in mind you have to Flexible while reading or analyzing chart and applying your studies. Thank You
Note - This article is only for study purpose. The information is for educational purposes only and does not constitute an offer to sell nor a solicitation of an offer to buy any security which may be referenced by me. The information provided through my charts is for personal, non-commercial, educational use and display.

GSFC- Magical Turn below 122 & Evening Star Candlestick Pattern!From previous update- "knocked 118.80 what next?" - Any move above 122 on a sustained basis can be looked as wave-iii or warning bell- warning bell rings just below 122.
Wow!- It turns just below 122 from recent high@121.50
What Next?
In current scenario you have Evening Star Candlestick Pattern- 3 candlestick pattern- which indicates a bearish or sell setup & could be an early sign of reversal & likely a dip below the previous high of 107 could be expected.
What is an Evening Star Candlestick Pattern?
An evening star is a bearish candlestick pattern consisting of three candles that have demonstrated the following characteristics: the first bar is a large white candlestick located within an uptrend; the middle bar is a small-bodied candle, red or white, that closes above the first white bar; and, the last bar is a large red candle that opens below the middle candle and closes near the center of the first bar's body. This pattern is used by traders as an early indication the uptrend is about to reverse.
Knocked 118.80- What Next?
GSFC- Rocket Move Started from 107
GSFC 2016 Diary- How we moved in year 2016

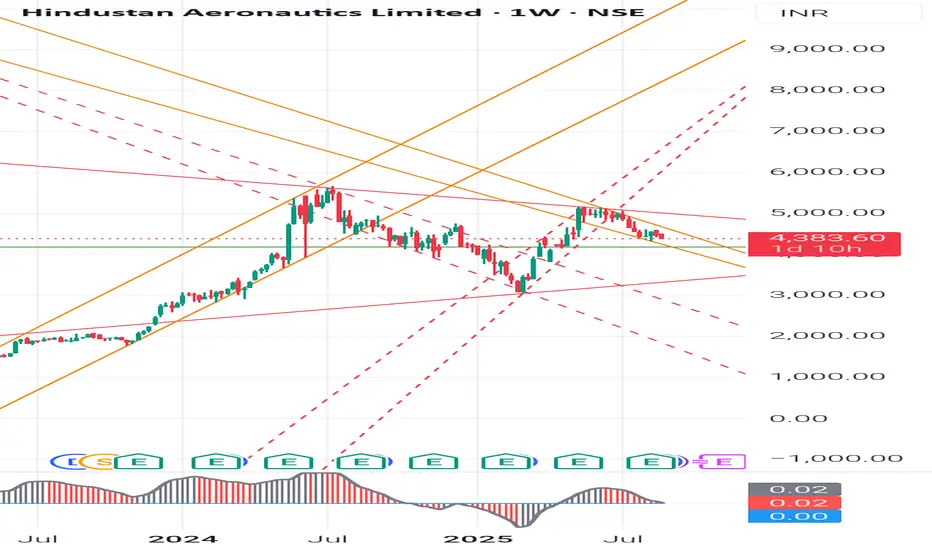
Hindustan Aeronautics Ltd. (HAL) based on chart + candlestickA comprehensive breakdown of Hindustan Aeronautics Ltd. (HAL) based on chart + candlestick + technical + fundamental + industry-level analysis.
- Hindustan Aeronautics Ltd. (HAL) Stock Analysis
1- Candlestick Pattern Analysis (Weekly Chart)
Current Price: 4,383.6
Recent candles are showing long wicks with narrow bodies - sign of indecision between bulls and bears.
Last 4- 5 weeks - mostly lower highs and lower lows = short-term bearish bias.
No strong reversal candle yet (like hammer/bullish engulfing) - trend continuation possible unless support holds.
2- Chart Pattern Analysis
The stock is moving inside a falling channel (descending channel) from the peak of - 5,200.
This may develop into a Bullish Falling Wedge (pattern in progress).
If breakout above 4,550- 4,600 zone happens - strong rally possible.
If breakdown below 4,200 - risk of correction towards 3,800.
3- Swing Analysis
Swing High: 5,250
Swing Low: 3,400 (recent bottom in 2024)
Current swing = pullback after rejection near 4,800- 4,900 zone.
Risk-reward is favorable for long-term investors around support zones (4,200- 4,000).
4- Key Levels
Immediate Support: 4,200 - 4,000 - 3,800
Immediate Resistance: 4,550 - 4,900 - 5,250
Perfect Entry for Long (Investors): Between 4,000- 4,200 with stop loss below 3,800.
Perfect Entry for Short (Traders): Near 4,500- 4,600 zone with target 4,200.
5- Industry Analysis (Defence & Aerospace Sector)
India’s Defence sector is getting strong govt. support (Atmanirbhar Bharat, Defence production push).
HAL is a PSU monopoly in aerospace & defence manufacturing (fighter jets, helicopters, engines).
Order Book: Robust pipeline with 80,000+ crore confirmed + new export opportunities.
Primary Market: Defence PSUs (HAL, BEL, BDL, Mazagon Dock) have outperformed broader market since 2020.
Secondary Market: HAL is relatively less volatile compared to private defence companies, due to stable govt. contracts.
6- Peer Comparison (Fundamentals)
Company P/E Ratio ROE Order Book Debt-Equity EPS Growth
HAL - 33x 28% 80,000+ Cr 0.01 (Debt-Free) Strong
BEL - 41x 23% 75,000+ Cr 0.05 Good
BDL - 48x 19% 20,000+ Cr 0.03 Moderate
Mazagon Dock - 32x 26% 65,000+ Cr 0.02 High
👉 HAL has-
Stronger ROE than peers
Debt-Free balance sheet
Slightly lower P/E than BEL & BDL - fair valuation
7- Learnings for Students (Investment Perspective)
- Chart patterns matter: HAL is showing a falling wedge, which is often bullish if breakout happens.
- Fundamentals matter: A stock with strong order book, high ROE, and debt-free status is usually safer.
-Valuation check: P/E ratio must be compared with industry average before investing.
- Patience needed: Weekly charts show long-term view. Don’t panic on short-term volatility.
- Sectoral push: Govt. policy & industry growth can override short-term technical weakness.
Summary:
HAL is currently in a consolidation/correction phase, testing strong support near 4,200.
Investors: Good zone to accumulate in dips for long-term (target 5,500+ if breakout sustains).
Traders: Short-term bearish bias until weekly close above 4,550.
👉Disclaimer-
This analysis is for educational purposes only. Not a SEBI-registered advisory. Please do your own research or consult a financial advisor before investing.
#HAL #StockMarketIndia #DefenceStocks #Investing #SwingTrading #PSUStocks #StockMarketEducation #ChartAnalysis #ValueInvesting #AtmanirbharBharat
JSB - Trend changing ?JSB - CURRENT PRICE : RM0.485
After finished its downtrend phase, the stock moves in sideways for 3 months (from OCTOBER 2024 until JANUARY 2025). Recently the share price starts to climbing up indicating some bullish scenario. However after a bad news related to the company published, the stock made a falling window (GAP DOWN) on 23 JANUARY 2025. Last Friday the stock managed to recover from the recent sell off and closed as a BULLISH PIERCING LINE. This shows that there is still buying interest in this stock.
Based on JAPANESE CANDLESTICK CHARTING TECHNIQUES, falling window may acts as strong resistance level. In this case, RM0.500 may considered as a critical resistance level for this stock. As such, a breakout above RM0.500 , technically will trigger a buy signal at RM0.505 for CANDLESTICK traders. In conclusion, it is a pending breakout stock.
ENTRY PRICE : RM0.505
TARGET : RM0.550 , RM0.595
STOP LOSS : RM0.465 (the low of BULLISH PIERCING LINE)

Lupin: Triple Top Signals Breakout Potential Topic Statement: Lupin has a bullish breakout potential, forming a triple top candlestick pattern with resistance at 2300, but may correct to 2000 if the breakout fails.
Key Points:
1. The stock is forming a triple top candlestick pattern, which is a strong breakout signal.
2. Resistance is established at the 2300 level, if the breakout does not occur, the price may correct to the support level of 2000.

Tata Motors Swing Idea (Long)Tata motors has been consolidating in range for last two weeks. Expecting a breakout next week due t following technical reason:
1) Swing Low range are shifting upward
2) Inside bar candlestick pattern on weekly
3)Trading above 20 & 50 EMA On HOURLY chart
4) Break away gaps are pending to be covered
5) Bullish Spinning bottom candlestick on weekly chart
(Note: I am neither responsible for anyone's profit or loss nor I am a sebi registered RA, this only for educational purpose. Please do your own due diligence before taking any trades.)

Larsen & Turbo Sept Monthly Expiry Expecting some momentum due to September month expiry closing in larsen & tourbo due to following reason
1) Long wicks currently indicating sellers are in control
2) Shooting star candlestick
3) Inside bar Candlestick pattern (Whichever side it breaks this
will be directional)
4) Since monthly expiry expecting some momentum
(Note: Author is neither responsible for anyone's profit or loss, nor a sebi registered RA, this only for educational purpose. Please do your own due diligence before taking any trades.)

BankNifty has formed a bearish candlestick on daily timeframeGood Morning Traders.
Yes you heard it right, Banknifty has formed a bearish candlestick pattern on daily time frame. But i am doing this analysis now in 30 mints. Because this is Intraday purpose analysis. Anyways let's talk what had happened yesterday..and what is going to happen today??
Yesterday again we have seen Banknifty maintained higher highs and higher lows formation for yet another session, though the index lost the gains from the day's high to close flat and formed a bearish candlestick pattern on the daily time frame. Bank Nifty again tried to get back above 44500, but failed to sustain the same. It has given closing at 44495.25 . It was proper consolidation day yesterday.
We might can see more consolidation between 44000-45000. As of now 44500 looks strong support zone for near term, if today again banknifty able to hold this level then we might can see Banknifty towards 44750+..Let's see what is going to happen. We will act according to price action.
Important levels for Banknifty:-
Support zone 44500-44300
Resistance zone 44650-44750
Buy Above 44583, if levels sustains at least for 30 Mints.
Targets we can see in upside 44721/44952+
Keep stop loss at 44442
Sale below 44300, if levels sustains at least for 30 Mints.
Targets we can see in downside 44153/43941
keep stop loss at 44442
Note:- Always wait for the best entry or levels to execute trades. And always follow strict stop loss to save your capital from unexpected market direction.
Disclaimer:- Please always do your own analysis or consult with your financial advisor before taking any kind of trades.
Dear traders, If you like my work then do not forget to hit like and follow me, and guy's let me know what do you think about this idea in comment box, i would be love to reply all of you guy's.
Thankyou

{Educational} ... Fight in INFY.......! Hello Everyone ... I m going to share one of my observation , may it will help all of you for understanding one of the way in which price flows ...........
Stomach Pattern Definition and Action.
1) Above Stomach Pattern
•What is Above Stomach Pattern ?
The above stomach pattern is a two candlestick pattern which evolves over a period of two sessions. It requires a existing downtrend and usually appears at the bottom of a downtrend.
• Psychology Behind Above Stomach Pattern.
The first day of the pattern, bears are still in control as we have a confirmed downtrend. Second day, price opens higher above the mid of point of previous filled candle and also closes above the mid point .This clearly indicates that sentiments have changed completely and further buying will happen in coming sessions.
• How to Trade Below Stomach Pattern ?
- Decision :
In case of Above stomach pattern,traders should start looking for buying opportunities, buy price should be around the close price of hollow candle after the filled candle.
- Stop loss :
What if the market reverse its direction after printing the above stomach pattern? The lowest low of the two candles making above stomach pattern will act as stop-loss in case that happen.
2) Below Stomach Pattern
• What Below Stomach Pattern ?
The below stomach pattern is a two candlestick pattern which evolves over a period of two sessions. It requires a existing uptrend and usually appears at the top of a uptrend.
• Psychology Behind Below Stomach Pattern
The first day of the pattern, bulls are still in control as we have a confirmed uptrend. Second day, price opens lower, below the mid of point of previous hollow candle and also closes below the midpoint .This clearly indicates that sentiments have changed completely and further selling will happen in coming sessions.
• How to Trade Below Stomach Pattern.
- Decision :
In case of Below stomach pattern,traders should start looking for selling opportunities, sell price should be around the close price of filled candle after the hollow candle.
- Stop loss :
What if the market reverse its direction after printing the below stomach pattern? The highest high of the two candles making below stomach pattern will act as stop-loss in case that happen.
• Main Points to Consider
• If it appears at support/resistance , it will make for high probability setup.
• Pattern with large body works better compared to the pattern with short bodies.

Tata Motors - Hammer CandlestickWe have seen rounding bottom breakout in Tata Motors and then pullback and test the resistance line. The resistance line now become support line (Change of Polarity). On weekly basis we found Hammer Candlestick and if go on daily basis its Bullish Piercing. Both candlestick are good enough to indicate that price will rise from the given support level.
Buy above 310
Stop Loss 273 below
Target 1 355 (Shooting Star high will act as resistance)
Target 2 375 (Previous Resistance)
Target 3 400 (Resistance and Round Number)
Final Target 480

Bullish Harami After big fall and retracement in nifty there's a bullish harami candlestick pattern on previous resistance level which can be act as support for nifty this candlestick pattern is formed in weekly time frame this make or break situation for nifty 50 ....

RUNE/USDT time to short?RUNE/USDT has formed bearish flag pattern + It also broke support of (≈)3.274.
BTC also looks bearish now, so it might be time to short RUNE/USDT after it successfully breaks support with conformations(Bearish candlestick patterns).
BTC has broken its support and formed bearish engulfing candlestick pattern in daily chart(still the candle hasn't closed, so wait for it to close in 9 hours and 19 minutes), so it might break its support of (approx)29700.
RUNE/USDT short entry-------->
Entry price - current price (around 3.180) or upon retest (if it retests) (around 3 or 3.2)
Stop loss - 3.4
Target price - 1.521, 1.300, 1.000
price might consolidate(or retest or take pullback) before crashing
(Don't open any position on wick)
(Don't take trades based on this idea, even I don't trade according to my idea)
(Do your own analysis)
(NOT A financial advice)
(High chances of loss if you follow my idea)

Positional or Longterm Opportunity in Dr Reddys LabsGo Long above 4703.4 for Targets of 4944.8, 5186.2, and 5427.6 with SL 4462
Reasons to go Long :
1. On a Weekly timeframe if we draw the Fibonacci retracement tool from recent swing low (point A) to recent swing high (point B) then we see stock took support from 0.318 Fibonacci level.
2. Also a bullish candlestick pattern Bullish Engulfing (marked with orange color) is formed around 0.318 Fibonacci level.
3. In addition to this the stock gave Trendline breakout.
4. On a Daily timeframe if we draw the Fibonacci retracement tool from the recent swing low to the recent swing high then we see stock took support from 0.618 Fibonacci level and a bullish candlestick pattern Bullish Hammer is formed around 0.618 Fibonacci level.

Positional or Longterm Opportunity in CeatGo Long above 1161.1 for Targets of 1262.2, 1363.3, 1464.4, and 1565.5 with SL 1060
Reasons to go Long :
1. On a Monthly timeframe if we draw the Fibonacci retracement tool from recent swing low (point A) to recent swing high (point B) then we see stock took support from 0.618 Fibonacci level.
2. Also a bullish candlestick pattern Bullish Hammer (marked with orange color) is formed around 0.618 Fibonacci level.
3. In addition to this there is a strong demand zone (marked with purple color), from which the stock initially faced resistance but now is taking support and moving up.
4. On a Daily timeframe if we draw the Fibonacci retracement tool from recent swing low to recent swing high then we see stock took support from 0.618 Fibonacci level & a bullish candlestick pattern Bullish Inverted Hammer is formed around 0.618 Fibonacci level.
5. There is a trendline (marked with red color), which is providing resistance to the stock so we have placed our final target just below it.

Positional or Longterm Opportunity in GodrejCPGo Long above 926.1 for Targets of 981, 1035.9, and 1090.8 with SL 871.2
Reasons to go Long :
1. On a Weekly timeframe if we draw the Fibonacci retracement tool from recent swing low (point A) to recent swing high (point B) then we see stock took support from 0.5 Fibonacci level.
2. Also a bullish candlestick pattern Bullish Engulfing (marked with orange color) is formed around 0.5 Fibonacci level.
3. In addition to this the stock gave Trendline breakout.
4. On a Daily timeframe if we draw the Fibonacci retracement tool from the recent swing low to the recent swing high then we see stock took support from 0.618 Fibonacci level and a bullish candlestick pattern Bullish Hammer is formed around 0.618 Fibonacci level.

Morning Doji Star in TCS.After the result date TCS has fallen with a gap down, since a downtrending market is in place. With a long bearish candlestick, which is followed by a Doji Star shows an indecision and gives a sign of possible trend reversal. Just like the regular Morning Star, confirmation on the third day fully supports the reversal of trend. This type of Morning Star can represent a significant reversal. Therefore it can be considered as more significant than the regular Morning Star pattern. Aggressive traders take entry above the current bullish candle and many traders enter the trade above the bearish candle of this candlestick pattern with a stoploss below the doji candle formed. My suggestion of entry is to wait for the price to give a closing above 10 EMA and RSI value above 40.

Swing Opportunity in M&M FinanceGo Long above 154.6 for Targets of 160.45, 166.3, and 172.15 with SL 148.75
Reasons to go Long :
1. If we draw Fibonacci Retracement from swing low (Point A) to swing high (Point B) on a 1-day chart we see the stock took support around 0.5 Fibonacci level and moved up.
2. On 0.5 Fibonacci level the stock has made a bullish candlestick pattern (Bullish Harami) and another bullish candlestick pattern (Bullish Engulfing) around 0.5 Fibonacci level.
3. Also we can see that the stock is forming double bottom (W pattern) which is a bullish chart pattern.
4. In addition to this there is a strong demand zone (marked with a purple color ) around 0.5 Fibonacci level from which the stock is moving up.
5. Also there is a high possibility that the stock will give a trendline breakout.

How to trade Dragonfly Candlestick ?Hello Everyone,
I have tried my best to explain, How to trade Dragonfly Candlestick pattern ?
Here, most imp point to consider is the Confirmation Candle ... why?
1. Market opened Gap down and was in the down trend, which broke the major Support level of 35000.
2. Now, this broken Support level would act as Resistance Level when market tries to reverse taking support of Trend Line .
3. At the same time, there was a formation of Dragonfly Candlestick indicating a Bullish move, so we should not immediately enter into trade as soon as formation of Dragonfly or Bullish Candle ...Why ?
a. We have an immediate Resistance Level of 35000.
b. If we enter as soon after completion of Bullish candle (Dragonfly), then our Stop Loss would be too big ... which is not good.
c. Also, the Bullish movement is not confirmed yet, so we should wait for confirmation candle.
4. Here, we see Confirmation candle breaking the immediate Resistance level and closing at the 35000 level.
5. Now, if we take trade after Closing of confirmation candle then Most Imp is Stop becomes very small compared to previous entry and we can see our target is achieved.
I hope you all like my teaching.
Please do share your thoughts/queries into comment section.
Please give a like, it motivates me to do more and do share with your friends as well.

Ultracement - Triangle Breakout - LongHi Guys,
Welcome to Thenali Views, Technical Analysis of Ultratech Cements
Trading Checklist:
Script Name: ULTRACEMENT
Trend : Uptrend
EMA: Bullish
ATR Volatility: Down
Time Frame Analysis: Daily
Candlestick Pattern:
Whether any Trend Reversal Pattern? NO
Candlestick Pattern was support with good volume? Not Applicable
Chart Pattern: Triangle
Breakout Happened with good volume? – Yes
Before Breakout Buildup (Consolidation) was happened? Resistance
Retest Happened? No
Support: 6703
Resistance: 6969
Buy Price: 6840
SL: 6506.40 (Daily Closing Basis)
Target: 7507.20
Risk: 333.60
Reward: 667.20
Ratio: 1:2
Whether Trade is Favorable or Not? Favorable
Regards
Thenali Views
Disclaimer: Kindly do your own analysis before executing the trade.

A Perfect example of "Bearish Engulfing" (Dixon)Dixon has seen a massive uptrend and also in the upper band of RSi (80) and also formed bearish engulfing, so in short term, we can see a good correction.
What is bearish engulfing?
- A is a technical chart pattern that signals lower prices to come. The pattern consists of an up (white or green) candlestick followed by a large down (black or red) candlestick that eclipses or "engulfs" the smaller up candle.
This analysis is done only for educational & intelligence purposes, invest or trade at your own risk.
