Apollotyre | Sandwich Candlestick Pattern spotted 🎯 EDUCATIONAL POST
⭕ Positional Trading opportunity ! Weekly Chart Alert !!!⭕
--Buy above =244.20 or CMP
--Target = 293
--Stop-loss = 225
--R:R =2.65
--Expected Profit = (20% )
--Expected Holding = 1 Months only
#ThankU For Checking Out Our Content , We Hope U Liked IT 📌
======================================================
⭕Technical Reasons to trade or Strategy applied :- ⭕
1) stock has formed sandwich candlestick pattern
2) Volume is very high
3) stock has just crossed 200 ema
4) Target is based on resistance zone at all time high
5) there is a trendline support as well
Guys check out the related ideas as well, it will work really well GUARANTEED !
🙏FOLLOW for more !
👍LIKE if think is useful !
✍COMMENT Below your view !
Search in ideas for "CANDLESTICK"

Nifty: Bullish Harami Candlestick pattern Nifty
CMP 13438
- On charts we observe a Bullish Harami candlestick pattern
- On previous 2 occasion Nifty pulled back to at least previous highs
- Will we be 3rd time lucky???
- Pattern gets invalidated if Nifty closes below 13131
Data analysis reveal Retail participants were mostly Put buyers yesterday... Market seldom obliges herd mentality of Retail traders. So be cautious...
One may consider selling Nifty 13300 Put option CMP 35
For a detailed F&O data analysis report you can message me your email address in comment section below or in Private message...
Take care & safe trading...!!!
Disclaimer:
- The view expressed here is my personal view
- Past performance is not a guarantee for future predictions
- Use this for educational purpose
- Any decision you take, you need to take responsibility for the same
- It's your hard earned money. Treat it wisely
- Trade / Invest keeping in mind your trading style, goals and objectives, time horizon & risk tolerance
- if trading in F&O, understand that F&O trading involves risk
- Do take proper risk management measures
- Do your own analysis and consult your financial adviser if need be

Nifty: Bullish Harami Candlestick patternNifty Closing price 8879
- we observe bullish harami candlestick pattern
- Hence shorting this structure might not be a good idea.
- It might be buying on dips or no trade
- ideally 8806 should not be breached but given the current volatility, will be keeping some flexibility for levels of 8758-8766 levels.
We might consider selling Put options as our strategy to trade
Take care & safe trading...!!!

Reliance - Price action channel + Candlestick + RSIKey Observations from the Chart
Channel Structure -
Both resistance and support lines have been tested multiple times with precise reactions
The most recent price action shows a strong rejection at the lower channel boundary
Candlestick Formation-
This month printed a textbook strong lower wick rejection candle:
Long lower wick indicates buyers aggressively stepping in at support
RSI Confluence-
The RSI tells a compelling complementary story:
Recently retested COVID-era levels (historic oversold territory)
Has since established higher highs and higher lows (bullish structure)
Shows positive divergence with price (RSI making HHs while price tests support)

Engulfing Bearish Candlestick in DLFThe daily chart of DLF has formed an Engulfing Bearish Candlestick showing signs of negativity coming into the stock.
One can go short only below a valid Break Down of support marked.
An upside channel can also be seen.
If the stock manages to close above the channel then it would generate buy.
Trade as per priceaction.

[Short Term] Morning Doji Star Bullish Candlestick Pattern Morning Doji Star bullish candlestick pattern formed near support level in BHEL. Go long after breakout of downtrend resistance for the target of 29.50 and 32.30+.


Short RIL based on candlestick patternsToday you can short RIL based on candlestick pattern of RIL, stock has given gravestone doji like structure and stock may become bearish to cover the gap which it has given days earlier. Stock may take support at 1150 or below that and you can place Stoploss at 1146

DLF Forming Bullish Candlesticks Pattern The price action is been trading between trendlines and forming bullish candlesticks pattern at the bottom of trendline or resistance line. For past three days, it is been falling and formed a Three black crows bullish pattern. Now, it can move up tomorrow as shown in the chart to confirm the pattern as it is also previously done. Buying pressure at resistance trendline is high enough to take prices up. In case it fails to do it then I expect there is higher selling pressure than buying of it at current levels.
Lets look forward to tomorrow to unfold this mistry, any opinions are welcome. Regards

NTPC Confirmed Bearish Pin-Bar CandlesticksThe Pin Bar Candlesticks formation indicates change in trend. If it is found near important resistance level then it signals selling pressure and rejection of prices on high level as indicated the above chart.
Therefore, it is an important formation to measure market sentiments and as per above chart it indicates high selling pressure or profit taking signals short.
Target: 154
Stoploss: 160

Reliable Abandoned Baby Reversal Candlestick Formation Bearish Abandoned Baby pattern after the uptrend is indicating the potential reversal at this level. The pattern is quite reliable and candlesticks offer good early entry with affordable SL so my mates can use it for their trading. RSI is also coming out of overbought region confirming the weakness.
Disclaimer : All ideas are my personnel view. Please take financial consultancy for trading decision.

TATA POWER - BEARISH PIN BAR CANDLESTICKSIt is been observed on daily chart that the price action forms a Bearish Pin Bar Candlestick formation indicating Buyers exhaution and Sellers taking over the price action. It shall further put the price action down to previous support levels at around 74.
Target: 74
Stoploss: 79

Coal India - Dark Cloud Cover Candlesticks Pattern (Educational)In the above chart, I have marked two candlestick patterns, Dark Cloud Cover and Piercing Pattern and describe their fundamentals. It is been drafted for educational purpose.

DIVIS LABS - PINBAR CANDLESTICK STRATEGYThe pinbar candlesticks indicates rejection of prices on high levels and also indicates selling pressure at resistance levels. In the above chart, 1380 -1350 acting as resistance zone where we can see rejection of prices due to high selling pressure. The prices may go down to the previous 52 Week high levels to regain buyers in the momentum and also confirmed it as a new support levels.
It is also worth to note that the previous high levels where our target is placed is at 61.8 retracement levels that also indicates the importance of the said levels.

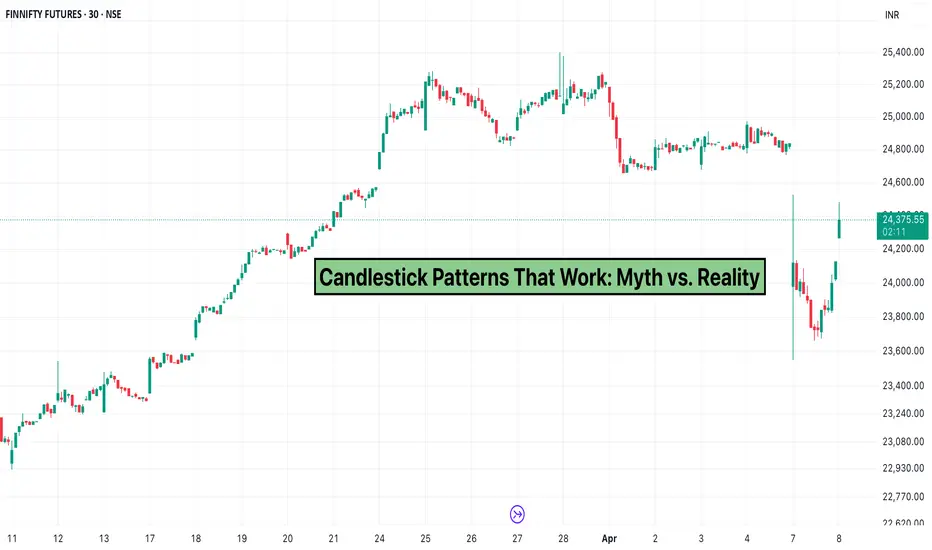
Candlestick Patterns That Work: Myth vs. RealityCandlestick patterns have long been a favorite among technical traders.
From engulfing candles to dojis and hammers, these formations aim to predict market direction based on price action.
But with so many patterns and interpretations floating around, it’s important to ask: which candlestick patterns truly work—and which are overhyped?
The Promise of Candlestick Patterns
Candlestick patterns are used to spot potential reversals, continuations, and indecision in the market. Traders often rely on them for entry and exit points, assuming that price behaves in recognizable, repeatable ways.
Popular patterns include:
Bullish Engulfing : Signals a potential upward reversal.
Bearish Engulfing : Suggests a possible trend shift downward.
Hammer & Hanging Man : Appear at the end of trends and hint at reversals.
Doji : Represents indecision; can signal a turning point when confirmed by other factors.
The Reality Check
While some patterns can be reliable in specific contexts, candlestick signals alone aren’t foolproof. Here's why:
Lack of Context : A hammer in a strong downtrend doesn’t always mean a reversal is coming.
False Signals : Markets are driven by volume, news, and macro conditions—candles can be misleading without confirmation.
Overfitting : Traders often cherry-pick successful patterns in hindsight, ignoring the ones that failed.
What Actually Works?
Confirmation is key : Pair candlestick patterns with volume, support/resistance, or indicators like RSI or MACD.
Backtesting helps : Use TradingView’s tools to test the performance of patterns over time.
Context matters : Patterns work better at key levels—like after a breakout, near trendlines, or at major support zones.
Conclusion
Candlestick patterns are helpful, but they’re not magic. To truly make them work, you need confirmation, context, and a strong understanding of market behavior. Use them as part of your toolkit—not the entire strategy.
Have you found success with candlestick patterns?
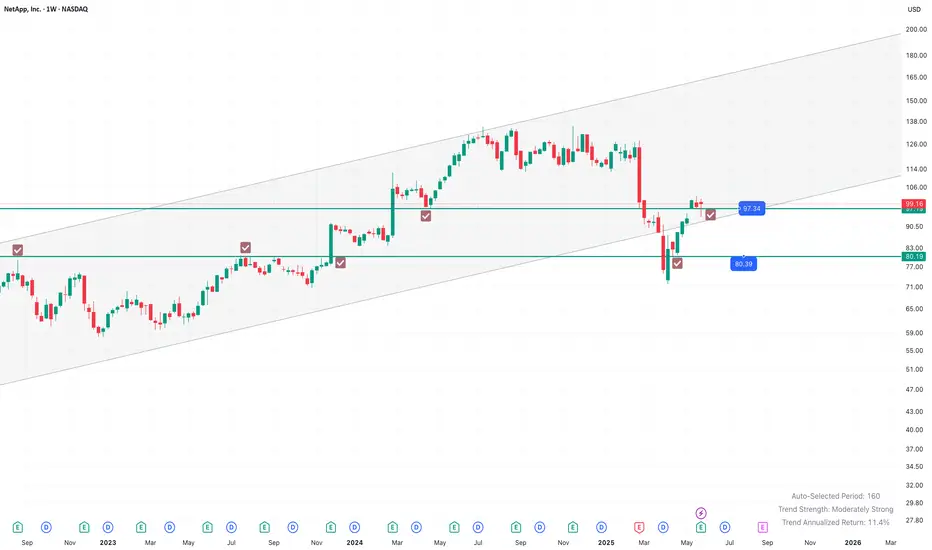
NetApp Inc shows bullish candlestick in larger timeframeNASDAQ:NTAP price action shows bullish candlestick pattern in the Monthly Chart. As well as in Weekly chart, it shows steady rejection and showing a sideways consolidating trend.
Lets analyze first weekly timeframe:
We can see during April'25 (Tariff Trauma weeks) the price made a low of $74, breaching down the $80 mark.
But within one week it again regains back the strong, historical demand zone of $80 and continue it's upsurge towards $100. It made a recent weekly high of $102.
Last 3 weeks was a consolidating around $97 to $100 level, keep on honouring the support of $97.
Last week, during timid FY24-25 Q4 earnings, we can see it falls back to $94. And seen a rejection there during last trading session of Friday, 05/30 and close the week with a Dragronfly dozi candlestick pattern (albeit the body color is red). Still the bottom rejection wick and holding back $97 is a sign of 'don't give up so easily'.
Whereas in monthly timeframe, it shows absolute bullishness:
The April month candle was a book-perfect Dragronfly doji.
This May month candle is a super bullish (sort of) Marubozu candle, even the low is above the last monthly close.
It's indicates a confirmative bullishness in monthly
Verdict:
This NASDAQ:NTAP counter is expected to be sideways-to-bullish in coming weeks.
Immediate Support levels are: $97, $89 (200 WSMA), $80.
There is no reason of it getting close below $80. That's becomes the new normal Low of the counter.
It's going through a typical consolidation and distribution phase for gathering new energy to resume it's upmoving in coming medium terms.
Stay Invested or Keep on accumulating , specially on every dips.
Candlestick Patterns to become a Successful TraderCandlestick patterns, which are technical trading tools, have been used for centuries to predict price direction.
There are various candlestick patterns used to determine price direction and momentum, including three line strike, two black gapping, three black crows, evening star, and abandoned baby.
However, it’s worth noting that many signals emitted by these candlestick patterns might not work reliably in the modern electronic environment.
It's the BASICS... sometimes as traders its best to stick to the basics , your trade run better when you go with the trend o the market.
Bull market buys, Bear market sells....
You will see a huge difference in your results when this is done. Scalping is great but overall trend is key.
The saying is set true "TREND IS YOUR FRIEND"

Hanging man with bearish engulfing - Candlestick
17 April 2020: Hanging man candlestick formation.
20 April 2020: Bearish engulfing Candlestick formation.
21 April 2020: Gap down opening - signifies strong sellers
Probable support @ 8500 & 9100 has strong resistance (Refer option chain)
Fibonacci Retracement : A:B:C
Note: There will be some retracement but the overall trend looks negative for short term.

Long - Short Intraday Signals With Candlestick and VolumeLong - Short for intraday signals with candlestick and volume

Spinning top candlestick pattern on LIC Housing financeLIC Housing Finance faces the selling from the previously formed supply zone and forms a spinning top candlestick pattern on a daily time frame.
apart from this, a blue line shows the weekly time frame support trendline and red line shows daily support.

BSOFT Cmp 267 Reversal @ Support & Three White Crows CandlestickBSOFT Cmp 266.70 dated 3-4-2023
1. Reversed from Support Line @250
2. Three White crows CandleStick made
2. RSI reversal & on verge of BO
Buy above 268 for target 275-285-295-305 SL 255
It is just a view, please trade at your own risk.

Dollar Index - candlestick analysisTVC:DXY
Dollar Index candlestick analysis :
1) overwhelming weakness in dollar as equity markets rallied
2) First signs of some buying emerge, some range expansion on upside
3) but all of buying quickly gets absorbed, by strong bearish engulfing candles, immediately after each attempt by buyers to drive prices up
4) clear range expansion also visible on downside as sellers again drive prices lower with momentum
5) this is a first proper sign of accumulation, long tail candles, range of candles on downside is getting narrow, and range expansion happening on upside, sellers are loosing momentum
6) mid point of previous wide range candle is where supply starts coming in, but range of bearish candles getting formed now is lower than candles that formed previously in the same zone at 4
7) as price reaches the same level of accumulation zone at 5, we again get long tail candles, further absorption of supply
8) widest range candle we have seen on upside in the entire base region, clear demand emerging now as buyers gain strength over sellers
9) each time a bearish candle forms, it gets countered by a bullish engulfing candle right on the very next week, some tails forming in the lower region. this is clear accumulation at higher levels now, in start contrast to price action at region 2 and 3
10) Dollar is now in a HH-Hl structure, supply is getting absorbed, and we will most likely get a breakout on the upside
11) this can lead to short term correction in equity indices
