PFC : ShortScrip can go for bearish reversal owing to formation of abandoned baby on top (day chart) and %william showing downtrend after sudden surge of uptrend
INTRA-DAY
Short (if formation of bearish engulfing appears next to reinforce the trend)
at 127 towards TP = 125,122 (end of body of prior bullish candlestick)
Search in ideas for "CANDLESTICK"

Tech Mahindra : Double bottom and morning star bullish reversalScrip can rebound back due to :
1) %william showing uptrend from oversold situation
2) Morning star pattern in the formation (Green engulfing candlestick required to complete the formation)
Trade can be started after it crosses 383 aiming towards resistance and neckline levels. Beyond neckline bullish surge and breakout could take it to target price = 431
Support level mentioned in chart

Bearish Engulfing Pattern on Exide.Bearish Engulfing is a popular candlestick pattern used in technical analysis to identify potential trend reversals in the stock market. When applied to Exide Industries share, which is currently facing resistance, the Bearish Engulfing pattern suggests a potential downturn in the stock's price.
The Bearish Engulfing pattern consists of two candlesticks: the first is a bullish candlestick, followed by a larger bearish candlestick. The bearish candle completely engulfs the previous bullish candle, signaling a shift in market sentiment from bullish to bearish.
In the case of Exide Industries share, the presence of the Bearish Engulfing pattern implies that the stock is currently facing resistance, indicating a level at which selling pressure outweighs buying pressure. This resistance level has prevented the stock's price from moving higher, suggesting a potential reversal in the prevailing uptrend.
The Bearish Engulfing pattern, coupled with resistance, suggests that traders and investors should exercise caution when considering bullish positions or holding onto existing long positions. It signifies a change in market dynamics, where bears may gain control, leading to a potential decline in the stock's price.
As with any technical pattern, it is important to consider other factors such as volume, overall market conditions, and fundamental analysis before making trading or investment decisions. Traders and investors should monitor the price action and volume closely to confirm the validity of the Bearish Engulfing pattern and the resistance level to determine the future direction of Exide Industries share. NSE:EXIDEIND

Can Ideal AB = CD & Bullish HARAMI CROSS Combo Lift PVR ? Perfect AB II CD & AC II BD. also in length AB = CD (Approx)
Pattern description with drawing on the chart.
Due to -VE behavior of market, pattern may be extended to other forwarding pattern.
Scnario #1 (bear side): Ext D = 1281.9 (plotted on Chart)
Scnario #2 (bear side):Ext D = 1241.8 (plotted on Chart)
Though my view in favor of LONG.
WHY ? Look Candle Pattern :
BULLISH HARAMI CROSS (Reversal pattern):
Definition
This is a Major BULLISH REVERSAL pattern , which is even more significant than a regular Bullish Harami . (Mentioned in ICICIPRULI CHART) The outline again looks like a pregnant woman, as with the Bullish Harami Pattern. However, now the baby is a DOJI . Basically, the pattern is characterized by a black body followed by a DOJI that is completely inside the range of the prior black body.
* " DOJI " : Also known to us as "PIN"
Recognition Criteria:
1. The market is characterized by a prevailing downtrend .
2. A Blue body is observed on the first day.
3. The "DOJI" or "Bullish PIN" that is formed on the second day is completely engulfed by the body of the first day.
Pattern Requirements and Flexibility:
The Bullish Harami Cross consists of two candlesticks, in which the body of the first blue candlestick engulfs the body of the following DOJI. The body of the first candlestick may be short.
Trader’s Behavior:
A bearish mood prevails in the market, and a downtrend is in progress. The first day’s candlestick is a blue body, which further supports bearishness. However the next day, prices open higher than the close, or at the close of the preceding day. The short traders are alarmed which leads to the covering of many short positions, causing the price to rise further. Moreover, the day closes at the opening price, showing lack of decision among traders. The increasing level of indecision and uncertainty amplifies the likelihood of a trend change and cause a Reversal .
Buy/Stop Loss Levels:
In the Bullish Harami Cross pattern the first candlestick can be short. This causes the confirmation level to change with respect to the body length of the first candlestick:
1. If the first blue body is short, then the confirmation level will be defined as the body top of the first candlestick.
2. If the first blue body is not short, then the confirmation level will the last close or the midpoint of the blue body of the first candlestick, whichever is higher.
Prices should cross above these levels for confirmation.
The stop loss level is defined as the lower of the last two lows. Following the BUY, if prices go down instead of going up, and close or make two consecutive daily lows below the stop loss level, while no bearish pattern is detected, then the stop loss is triggered.
ALL Short / Medium Term LEVELS PLOTTED ON CHART.
Intraday Chart as Snapshot will be Updated later, watch time-line regularly for new updates.
If enriched your knowledge,
Click on LIKE , to motivate me
Comment appreciated.
Disclaimer: Only For STUDY. For Taking Trade Decision Consult Financial Advisor.

Buying TrendWhen two consecutive candlesticks are bearish such that the first one has a greater fall and the second as a comparatively less one in a way stabilizing the fall, then the third one will be a bullish candlestick.

Time to Insured PortfolioIn ULIP & Mutual Fund there is an OPTION to change fund status
Like "GROWTH" -> "BOND" & Vice-versa.
In Equity there is no such Option.
better to identify stocks shows reverse action.
i.e act like "GROWTH" -> "BOND"
Technical front: Good combination seen in "RSI" & "W%R"
Candle Pattern: "BULLISH HARAMI", A bit of Study
Definition
This pattern consists of a black body and a small white body that is completely inside the range of the black body. If an outline is drawn for the pattern, it looks like a pregnant woman. This is not a coincidence. “Harami” is an old Japanese word for “ pregnant ” . The black candlestick is “the mother” and the small candlestick is “the baby” .
Recognition Criteria:
1. The market is characterized by a prevailing downtrend.
2. A black body (in this chart "Blue Candle") is observed on the first day. (Here Candle formed on 27th July, 2007)
3. The white body (in this chart "Green Candle") that is formed on the second day (on Last Trading day) is completely engulfed by the body of the first day.
Pattern Requirements and Flexibility
The pattern consists of two candlesticks, in which the first day’s black candlestick engulfs the following day’s white candlestick. The first one has to be a normal or long black candlestick. Either the body tops or the body bottoms of the two candlesticks may be at the same level, but whatever the case, the white body should be smaller than the previous black body.
Trader’s Behavior:
The Bullish Harami is a sign of disparity in the market’s health . The market is characterized by a downtrend and a bearish mood, and there is heavy selling reflected by a black body, which further supports the bearishness. However, the next day prices open higher or at the close of the preceding day and the short traders are alarmed. This leads to the covering of many short positions, causing the price to rise further. The latecomers short the trend they missed the first time, and slow down the rise. Thus, a small white body is formed. This may signal a trend reversal since the second day’s small real body shows that the bearish power is diminishing.
Buy/Stop Loss Levels:
The confirmation level is defined as the last close or the midpoint of the first black body, whichever is higher. Prices should cross above this level for confirmation.
The stop loss level is defined as the lower of the last two lows. Following the BUY, if prices go down instead of going up, and close or make two consecutive daily lows below the stop loss level, while no bearish pattern is detected, then the stop loss is triggered.
Rest plotted on Chart.
Intraday Chart as Snapshot will be Updated later, watch time-line regularly for new updates.
If enriched your knowledge,
Please don't forget to LIKE, SHARE.
Comment appreciated.
Disclaimer: Only For STUDY. For Taking Trade Decision Consult Financial Advisor.

TATA Steel The frypan bottom occurs when small real body candlesticks slowly move downward and then move in a neutral to upward direction. The frypan bottom pattern is complete when a bullish candlestick gaps up from the rest of the candlesticks.
Tata Steel Going sideways for few Days and now ready to give BO Trade only if stock is giving Gap up or gap Down Opening Targets can 1358 to 1400 for short term with Sl Below the candel Low.
If share Gaps Down can sell the share with SL 1249 On closing basis.

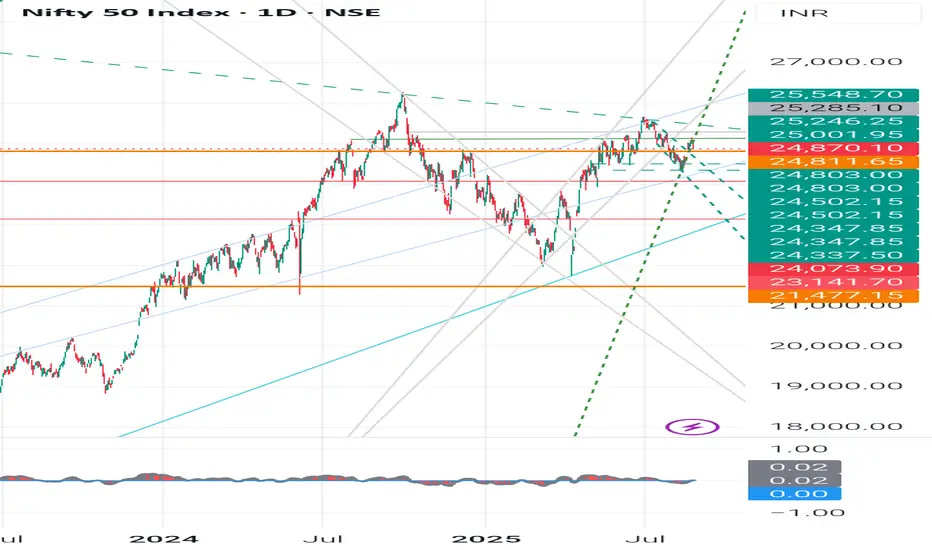
Nifty 50 - Technical Chart Pattern Analysis, With LevelsNifty 50 - Technical Chart Analysis (as per Daily chart)
Current Price (CMP): 25,070
Trend: Sideways consolidation between 24,500 - 25,500 levels.
Chart Pattern:
Multiple tests of 25,500 - strong resistance.
Multiple supports around 24,500 - 24,800 - strong demand zone.
The broad pattern looks like a Rectangle / Range-bound movement.
Swing Analysis:
Higher swing lows visible after 24,000 - bullish undertone.
Lower swing highs at 25,500 - supply pressure.
Key Levels
- Immediate Resistance: 25,250 - 25,550 - 26,000
- Immediate Support: 24,800 - 24,500 - 24,073
Major Support: 23,141 - 21,477 (long-term trend support)
👉Candlestick Learnings (Recent Pattern)
Recent candles show long wicks both sides - market indecision (buyers & sellers fighting).
A strong green bullish engulfing candle near 24,500 support - sign of buyers stepping in.
Current candles forming inside bars - breakout move expected soon (either above 25,500 or below 24,500).
✍️Student Learning Point:
When candles show long wicks near support - it signals accumulation.
When candles cluster near resistance - expect breakout/reversal.
Always confirm with volume before taking position.
Fundamental Comparison - Nifty Competitors (Index Peers)
Since Nifty 50 is an index, let’s compare with other global indices (macro investing perspective):
Index P/E Ratio Dividend Yield 5Y CAGR Returns Volatility
Nifty 50 -22-23 -1.2% -13% Moderate
Sensex -24 -1.1% -12% Moderate
Dow Jones -21 -1.7% -9% Lower
Nasdaq 100 -28 -0.9% -15% High
Shanghai Comp -17 -2.0% -5% Moderate
Learnings:
Nifty has a healthy P/E (not cheap, not too expensive).
Growth rate is higher than global averages - India is attractive long-term.
Volatility is moderate, making Nifty good for SIP investors & long-term compounding.
Investment Learnings for Students
1. Candlestick Patterns: Learn basics like Doji, Engulfing, Hammer, Shooting Star - they often show reversal/continuation.
2. Swing Analysis: Markets move in swings (higher highs/lows in uptrend, lower highs/lows in downtrend). Recognizing them helps in entry/exit.
3. Support & Resistance: Always mark key levels before trading/investing.
4. Fundamentals: Don’t just look at charts - check P/E, dividend yield, EPS growth, sector weightage.
5. Risk Management: Use stop-loss in trading. For investing, use SIP & diversify.
⚠️ Disclaimer
This analysis is for educational purposes only. Not a SEBI-registered advisory. Students & investors should do their own research or consult a financial advisor before making decisions.
#Nifty50 #StockMarketIndia #TechnicalAnalysis #InvestingForBeginners #CandlestickPatterns #SwingTrading #SupportAndResistance #StockMarketEducation #MarketLearning
Descending Triangle Formation & Neutral CandlesticksDescending Triangle formation on Bank of Baroda Chart.
Descending Triangle is a consolidation pattern .
According to the pattern, a possible downside breakout is expected.
Watch the last 3 Candlesticks:-
16 April 2020 - Dragonfly Doji
17 April 2020 - Spinning Top
20 April 2020 - Long Legged Doji
All these candlesticks are neutral candlesticks .

Triangle pattern breakout in GODREJ PROPERTIESGODREJ PROPERTIES
Key highlights: 💡⚡
✅On 1Hour Time Frame Stock Showing Breakout of triangle Pattern .
✅ Strong Bullish Candlestick Form on this timeframe.
✅It can give movement up to the Breakout target of 1635+.
✅Can Go short in this stock by placing a stop loss below 1525-.

Why I choose Heikin Ashi Over Regular candlestick Part 1Did you get confused in candlestick charts because of Gap Ups/Gap Downs, Single candlestick pattern, Multiple candlestick pattern Noise in candlestick. So here is the solution for these problems Heikin Ashi Candlestick. As regular candlestick, it is also from Japan. Japanese meaning for Heikin = Average and Ashi = Speed Its showing market direction. Heikin Ashi is candlestick but it is Averaged candlestick or Modified candlestick and it's does not have absolute value.
Sometimes it is difficult to read/analysis chart because of Gap Up/Gap Down and as a result of the indicators also give a false signal for buy and sell. False signal because maximum indicator calculations based on closing price. But in Heikin Ashi closing price in an average of current price of Close, High, Low and Open. Now let’s concentrate on how Heikin Ashi formed.
Heikin Ashi Formation –
First, we will see how to find the closing price of Heikin Ashi.
1. Heikin Ashi close is an average of Open, High Low and Close of the current period.
Heikin Ashi Close = / 4
2. Heikin Ashi Open is Midpoint of Open and Close of the prior Heikin Ashi candle
3. Heikin Ashi High is the Maximum value of current normal candles High.
4. Heikin Ashi Low is the current lowest value of current normal candles Low.
Now one of the most important thing which will be a little bit confusing how to calculate the value of close before we calculate next candle. Here the first calculation of close is done by using the current price of high, low, open and close. Now there are few interpretation we have to understand, if we understand this interpretation it will be very easy to identify the trend and how to take a position.

FEDERALBNK,4HrAs per trend and the candlestick pattern analysis buy signal is very strong but if market open above the minor resistance go for buy otherwise wait for breakout of resistance at this situation market is at resistance level

10 Most Powerful Candlestick Patterns for Intraday10 Most Powerful Candlestick Patterns for Intraday
In intraday trading, where time is money, candlestick charts are highly useful for traders. These patterns, formed by the open, high, low, and close prices within a specific time frame, offer insights into market sentiment and potential price movements.
Recognizing patterns like bullish engulfing or doji candles can help traders predict short-term trends with better accuracy.
When traders understand these patterns it enables them to make informed choices on when they should enter or leave positions so that they can maximize profitability and still manage risk.
This article seeks to highlight 10 very powerful candlestick patterns that all intraday traders should be familiar with in order to trade effectively.
10 Powerful Candlestick Patterns for Intraday
Intraday trading depends heavily on technical analysis and candlestick patterns. Here, we present 10 potent candlestick patterns that are especially effective for intraday trading:
1. Tweezer Tops and Bottoms
Tweezer Tops and Bottoms are candlestick patterns where two consecutive candles have nearly identical highs (Tops) or lows (Bottoms).
For Tweezer Tops, the first candle shows an uptrend, followed by a second candle with a similar high, suggesting potential resistance.
Tweezer Bottoms start with a downtrend candle followed by another with a matching low, indicating possible support.
These patterns signal reversal possibilities, especially when seen at market highs (Tops) or lows (Bottoms), though confirmation from subsequent price action is recommended.
2. Hammer and Hanging Man
A hammer is formed at the bottom of a downtrend, having a small body and long lower wick which shows that there is a possible bullish reversal.
Conversely, a Hanging Man appears at the top of an uptrend with a similar shape, suggesting a bearish reversal.
Both patterns indicate that despite significant price drops during the session, buyers managed to push prices back up (Hammer) or sellers dominated despite a price rise (Hanging Man), signaling a possible shift in market sentiment.
3. Shooting Star and Inverted Hammer
These candlestick patterns indicate potential reversals. The Shooting Star appears during uptrends, showing a small body and a long upper wick, suggesting a weakening upward momentum.
It signals a bearish reversal if confirmed by a red candle following it.
In contrast, the Inverted Hammer forms at downtrend bottoms, featuring a small body and a long lower wick, indicating a potential bullish reversal.
Confirmation with a green candle afterward strengthens its signal, making it crucial to watch for trend changes near these patterns.
4. Engulfing Pattern (Bullish and Bearish)
In a Bullish Engulfing Pattern, a large bullish candle fully engulfs the previous smaller bearish candle, indicating a likely upward reversal.
Conversely, a Bearish Engulfing Pattern features a large bearish candle that engulfs the previous smaller bullish candle, suggesting a probable downward reversal.
Traders watch for these patterns near support or resistance levels for confirmation before making trading decisions.
5. Morning Star and Evening Star
The Morning Star forms with a bearish candle, followed by a small-bodied candle (indicating uncertainty), and then a bullish candle. It signifies a change in market sentiment from bullish to bearish.
The Evening Star starts with a bullish candle, followed by an uncertainty candle, and ends with a bearish candle, indicating a shift from bullish to bearish sentiment.
These patterns are reliable in indicating trend reversals.
6. Three White Soldiers and Three Black Crows
Both these patterns are powerful signals of potential trend reversals, especially when they occur after an extended move in one direction.
Three White Soldiers pattern shows three consecutive bullish candles with each opening higher and closing higher than the previous one, signaling a strong uptrend reversal.
Whereas, the Three Black Crows pattern features three consecutive bearish candles where each opens higher and closes lower than the previous one, indicating a strong downtrend reversal.
7. Doji
A Doji candlestick has nearly identical open and close prices, creating a cross or plus sign. It reflects market indecision, where neither buyers nor sellers dominate.
Dojis often appear in a consolidation phase and can signal potential reversals or continuation of trends, depending on the surrounding candlesticks.
For intraday trading, they are particularly insightful when found near support or resistance levels, as they can hint at an upcoming price movement direction.
8. Inside Bar (Harami)
An Inside Bar, also known as Harami, where a smaller candle is completely within the range of the previous larger candle. It suggests indecision in the market and can signal potential reversals or continuations.
Traders often watch for a breakout of the smaller candle's range as a signal of future price direction. This pattern is commonly seen during periods of consolidation, offering a clear visual cue of market uncertainty before a potential breakout or continuation of the trend.
9. Piercing Line
The Piercing Line candlestick pattern forms when a bullish candle follows a bearish one. It opens below the previous day's low but closes more than halfway up the prior day's bearish candle. This suggests a potential bullish reversal, especially if accompanied by strong trading volume.
Traders often interpret this pattern as a signal to consider buying positions, anticipating a shift from bearish to bullish momentum.
10. Dark Cloud Cover
Finally, this pattern is a bearish pattern formed by two candles. The first candle is bullish, closing near its high. The second candle opens higher than the first candle's close but closes below the midpoint of the first candle's body.
This pattern indicates a potential shift from upward momentum to downward momentum. Traders often look for this pattern near resistance levels for stronger signals.
It's important to confirm the pattern with higher trading volume to validate its potential impact on price direction.
Conclusion
Knowing candlestick patterns can help you trade efficiently and enter the market with precision. Whether for day trading or momentum trading.
These candlestick Patterns show when to buy or sell an asset to maximize the profit and mitigate the risks by placing a stop loss.
Dhan is the first broker in the world to offer Options Trading from TradingView.com. Know more about this here !

Nifty View 30 May 2019Nifty Daily chart finds a confluence of 2 different bearish candlestick pattern. First the Hanging Man which formed one day prior to last, low of which was breached. This implies that there is potential in this Hanging Man pattern to work and maybe drag prices on the downside. Second, if we consider the last three candles, then an Evening Star shapes up, and its a pretty clean setup. So essentially, we are looking at two bearing pattern confluences together which can lead to some profit taking. Trigger of fresh selling will come only below yesterday's low of 11,835.

NIFTY Possibilities Compared With India VIXEven though the chart is self explanatory, I have tried to compare NSE:NIFTY with NSE:INDIAVIX
Blue line is NSE:INDIAVIX
Brown line is NSE:NIFTY
Dashed red line is trendline support and NF breaking above that
Light yellow line is support line for NSE:INDIAVIX
2 possibilities exist -
1) India Vix continues to trade below or near the support line, and we may see some price stability for NF. Before embarking on the next journey, we may inch higher or consolidate around these levels.
2) The India Vix rises again, and the price begins to fall from its current levels.
Another thing I noticed unfolding on both indices charts is this -
1) NF & BNF on DTF are almost at the upper end of Bollinger Band
2) Trading above 20/50 EMA
3) Both indices have a rising window candlestick gap on DTF ( July 6th and July 7th ) -
a) It is a bullish continuation candlestick pattern
b) A Rising Window candlestick pattern is a 2 candlestick pattern
1) There must be an empty space between the two candlesticks in the pattern where the prices do not overlap
2) Pattern is characterised by a price gap appearing between the first candle's high and the second candle's low
c) It is possible for the first of the two candlestick patterns to have a red coloured real body, however the most likely scenario is two green coloured candlesticks that
make up the pattern ( this has been established with the candles formed on both indices on July 6th and July 7th )
For July 8th, from my limited knowledge, 2 possibilities exist -
1) We fill the gap on the downside and close below the high of July 6th candle. This would nullify the pattern and price may head down again as bears have taken the control during this upmove
2) We go down and close just above the high of July 6th candle without completely filling the gap. If this happens, bullish momentum for the time being should continue
Let's see which way the story unfolds. Happy Trading!
Disclaimer -
- The view expressed here are my personal views. I am publishing this for my own records and what I see on charts.
- If you're referring to this, please consider this ONLY FOR educational & research purposes.
- Past performance is not a guarantee for future predictions
- Any decision you take, you need to take responsibility for the same. DO NOT consider this as an investment suggestion.
- It's your hard earned money. Treat it wisely
- Trade / Invest keeping in mind your trading style, goals and objectives, time horizon & risk tolerance
- Do your own analysis and consult your financial advisor before investing.
TIA!

ALBK - Lawyer back in courtroom-Trendline-Bottoms-Candlestick@67Lawyer is back with the bank in current case as client
Previous Analysis ( Act like Lawyer)
Trendline passing through 39.40--57--67.30
Basic Application of Technical Analysis - 2 points to draw a trendline & 3 points makes a valid trendline- the more bottoms you see on this line which is coming from 39.40 lows -holding this line line supports in future as well -then you conclude it is a stronger trendline unless in future t his trendline gets broken.
Double Bottoms
Lows in the zone 66.75 -67.30 has holded & can be a possible double bottom which is confirmed only if 92.40 highs is taken out on top but it has supported in the zone 66.75-67.30.
Bullish Candlestick Pattern
3 candlestick pattern know as Morning Star can be a good sign of reversal shown in oval shape at 67.30 lows.
What is a 'Morning Star'
A morning star is a bullish candlestick pattern that consists of three candles. The first bar is a large red candlestick located within a defined downtrend, the second bar is a small-bodied candle (either red or green) that closes below the first red bar, and the last bar is a large green candle that opens above the middle candle and closes near the center of the first bar's body or closes above the high of 1st red candle- Extreme bullish case. We have extreme bullish case.
Trading Strategy
Holding 65 on downside (Below 65 as stoploss) below expected double bottom zone of 66.75-67.30 if it starts moving above 74 then buy call can be initiated by Safe Traders. Risky Traders can buy in the zone 68-70 keeping stops below 65 because going below 65 -Downside selling pressure can be seen.
Bullish Pieces from the Lawyer to make a strong case. Let My Lord (Market) decide the result.
Trendline
Double Bottom
Bullish Candlestick Pattern
Target Zone
Can be 92 -previous high -above 92 can be 104 & above 105 can be 115.

#Silver Alert: Double Top Breakdown Incoming?🚨 Double Top on XAGUSD daily chart:
1️⃣ First Top: Bearish Engulfing
2️⃣ Second Top: Dark Cloud Cover
Pattern confirms DCB 🔻 below $45.55 , 🎯 targeting $36.71 .
🚧 Resistance: $52.32 - $54.49
🛡 Support: $50.62, $49.38 - $48.91, $47.17 - $46.90
⚠️ Major sell-off potential. Longs only above Double Top high after 2 consecutive closes.
#Silver #XAGUSD #DoubleTop #TechnicalAnalysis #BearishReversal #ChartPatterns #CandlestickPatterns #PriceAction
📌 #Disclaimer: This analysis is shared for educational purposes only. It is not a buy/sell recommendation. Please do your own research before making any trading decisions.

Must-Know Candlestick Patterns for Every TraderMust-Know Candlestick Patterns for Every Trader
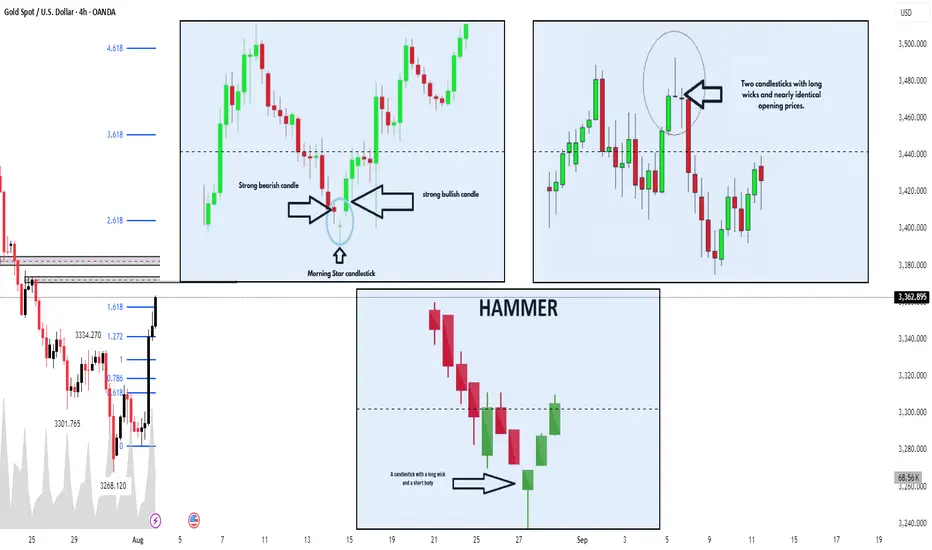
📍 Morning Star
This is a three-candle pattern. The first is a strong bearish candle following a downtrend. The second candle opens below the previous close, with a small body and long wicks — showing indecision in the market. The third is a strong bullish candle, equal to or longer than the first one, indicating the start of a new uptrend.
📍 Doji Candle
The Doji represents a possible reversal, either upward or downward. It has long wicks and almost equal open and close prices. While not a very strong signal alone, it reflects market uncertainty and can suggest an upcoming change in trend.
📍 Hammer Candle
A simple yet powerful bullish reversal pattern that appears at the end of a downtrend. It has a small body and a long lower wick like a hammer, showing price rejection and signalling a potential upward move. It can also appear in uptrends, though with less reliability.
If you want to trade better and grow into a confident, professional trader, understanding these patterns can really help. When they show up, the market could be ready to reverse — so keep an eye out to manage your trades or enter at better levels.
Hope you find this knowledge useful!
#ForexIndia #CandlestickPatterns #TechnicalAnalysisIndia #PriceActionTrading #MorningStarPattern #DojiCandle #HammerCandle #IndianTraders #LearnTrading #NiftyTraders #SmartTradingMoves
Using Price action & candlesticks to decode what Nifty is doingIn our last post on Nifty, we had mentioned that Nifty now seems to be forming an X wave with expected target around 24,350 to 24,450.
Nifty made a high of around 24,419 on Friday, August 9, 2024.
So, where do we go from here?
Nifty has been moving up, and a break above 24,420 should act as a break-out to take it further upside.
However, look at the price action and candlesticks and ask yourself, “Can we call this a breakout?” “Does this breakout mean Nifty has changed its trend?”
The candlesticks seem to be saying that although Nifty is going up, there is nothing in it for the buyers.
In this 1-hour chart, from August 6th to 9th (red Circle), can you figure out how many candlesticks seem to show that buyers have made an impact? From 23,960, Nifty moved to 24,419, a rally of almost 450 points, yet can’t see even one big green candle.
Decoding the candlestick pattern seems to tell us that this upside move is not a result of buying. It is happening for Nifty to go up and grab liquidity at the top, post which we should again see a downtrend.
So, where can Nifty grab liquidity?
If Nifty breaches the 0.5% mark , there is a high probability that it will reach between the Fibonacci 0.618% and 0.786% level. This is the area from where we can see a downward move again.
Disclaimer : We are not SEBI registered. The content presented here is based on personal opinions. Conduct your own research and consult with a qualified financial advisor before making any investment decisions.

Morning StarA morning star is a visual pattern made up of a tall black candlestick, a smaller black or white candlestick with a short body and long wicks, and a third tall white candlestick.
The middle candle of the morning star captures a moment of market indecision where the bears begin to give way to bulls. The third candle confirms the reversal and can mark a new uptrend.
Script = ABFRL
Time Frame = 1 Day

Hammer PatternHammer candlesticks typically occur after a price decline. They have a small real body and a long lower shadow.
The hammer candlestick occurs when sellers enter the market during a price decline. By the time of market close, buyers absorb selling pressure and push the market price near the opening price.
The close can be above or below the opening price, although the close should be near the open for the real body of the candlestick to remain small.
The lower shadow should be at least two times the height of the real body.
Hammer candlesticks indicate a potential price reversal to the upside. The price must start moving up following the hammer; this is called confirmation.
Script = Biocon
Time Frame = 1 Day

Bitcoin (BTC) Chart - Japanese Candlesticks Vs. Heikin AshiOn the left side: BTC chart with japanese candlesticks (full of noises that hinder our trading decisions).
On the right side: The same chart but with Heikin Ashi candlesticks (much cleaner and more defined which helps our trading decisions).
Heikin Ashi was developed by Munehisa Homma in the 1700s and share some characteristics with standard japanese candlestick, but differ based on the values used to create each candle. Instead of using the open, high, low, and close like japanese candlesticks, the Heikin-Ashi technique uses a modified formula based on two-period averages. This gives the chart a smoother appearance, making it easier to spots trends and reversals.
Tip: Heikin Ashi is ideal for swing trading.

BankNifty Intraday Trade Setup for 19th May 22 (Trading Idea)After a huge Gap down, we have seen some buying happening and the market is moving slowly and steadily towards the upside, so what should be our trade plan for the day? Since today is Thursday and chances of Premium decay as well as volatile delta moves is very high, so we should wait for some time for the market to show us the right direction
Be active on this post to see my live positions and Trade
Do Support by Liking and Commenting on our Post as it motivates us to post more such ideas
The chart is for study purposes only!!
NSE:BANKNIFTY
NIFTY, Trading Strategy, Intraday, Banknifty option trading strategy, intraday strategy, simple intraday strategy, Share Trading Strategies, BANK NIFTY TRADING STRATEGIES, trading with volume profile, intraday, mcx , crude oil , crude, crude oil trading tricks, open interest analysis, options trading,
options trading strategies, Emotion in Investing, markets scientist, candlestick pattern, candlestick,
candlestick analysis, candlestick stock pattern, trusted spots, cool brains, learn and earn, trending, profits
How to find stocks for intraday, how to buy and sell in Zerodha kite, Zerodha trading tutorial in Hindi,
bracket order, daily income plan, emotions, Unsuccessful Investor, share trading course, share market course.
day trading, best strategy on intraday trading, Candlestick types, Candle types, Candlestick analysis in Hindi,
Candlestick Body, Japanese Candlestick , Rakesh Jhunjhunwala, share market,
stock market for beginners tutorial, how to enter the stock market for beginners, stock market guide,
Share market basics for beginners
