BRITANNIA - Falling Wedge + Bullish Engulfing Combo💹 Britannia Industries Ltd (NSE: BRITANNIA)
Sector: FMCG | CMP: ₹5,892.50 | View: Falling Wedge + Bullish Engulfing Reversal Setup
📊 Price Action:
Britannia is currently displaying a strong confluence setup where both a chart pattern and a candlestick pattern align perfectly to signal a potential trend reversal.
After weeks of consolidation within a downward-sloping structure, the stock has formed a Falling Wedge pattern — a classic bullish reversal formation.
Adding strength to this structure, a Bullish Engulfing Candle on 4 Nov 2025 emerged from the wedge’s lower boundary, confirming buyer dominance and hinting at a near-term trend reversal.
📉 Chart Pattern Analysis – Falling Wedge (Bullish Setup):
The Falling Wedge pattern is marked by two converging downward trendlines, each connecting a series of lower highs and lower lows.
This structure reflects seller exhaustion and early buying interest.
Britannia’s wedge formation is now reaching its apex, where breakout probability is highest.
Volume contraction throughout the wedge also supports the notion that supply is drying up, preparing for a breakout above the upper trendline.
📈 Candlestick Pattern – Bullish Engulfing Confirmation:
The Bullish Engulfing Candle formed on 4 Nov 2025 precisely at the lower support line of the wedge, validating the pattern with strong timing. It represents a shift in control from sellers to buyers, with the green candle completely engulfing the prior red body. Volume expansion on that session further confirmed active participation by institutions ahead of the upcoming news catalysts. This one-day reversal candle acts as the first technical confirmation, while a breakout above the upper trendline will serve as the structural confirmation for the wedge pattern.
📏 Fibonacci Analysis:
From swing low ₹5,298 to swing high ₹5,930:
78.6% retracement @ ₹5,795 → Key reversal level defended.
61.8% retracement @ ₹5,888 → Currently reclaimed zone.
100% extension @ ₹5,930 → Short-term breakout threshold.
The Fibonacci structure aligns beautifully with the wedge’s geometry, implying that the reversal zone is complete and buyers are regaining momentum.
🧭 STWP Support & Resistance:
Resistances: ₹5,940 | ₹5,987 | ₹6,055
Supports: ₹5,825 | ₹5,775 | ₹5,710
The ₹5,775–₹5,825 range is acting as a high-confidence accumulation base, while ₹6,090–₹6,150 represents the key breakout trigger zone.
📊 STWP Volume & Technical Setup:
Volume on 4 Nov surged to 363.4K vs 248.7K average, confirming institutional interest at lower levels. VWAP recovery and improving RSI (47→52+) show that momentum is gradually returning.
MACD is approaching a bullish crossover, while Stochastic and CCI have both turned upward — all aligning with a reversal confirmation setup.
Trend Direction: UPTREND (Transitioning) | Volume Confirmation: Possible Accumulation in Progress
🧩 STWP Summary View:
Final Outlook:
Momentum: Strengthening | Pattern: Falling Wedge + Bullish Engulfing | Risk: Moderate | Volume: Increasing
Britannia’s technical structure now showcases dual confirmation — a chart pattern (Falling Wedge) supported by a candlestick reversal (Bullish Engulfing).
This confluence enhances the reliability of the reversal signal and increases the probability of an upside breakout. As long as the price holds above ₹5,825, the bias remains bullish with potential continuation toward ₹6,150–₹6,250.
⚠️ Disclosure & Disclaimer – Please Read Carefully
This analysis is for educational purposes only and should not be treated as financial or investment advice.
I am not a SEBI-registered investment adviser. All views are based on technical observations and publicly available information.
Trading involves risk; please assess your financial suitability, position size, and stop-loss levels before entering any trade.
Always consult a SEBI-registered financial adviser for personalized guidance.
Position Status: No active position in (BRITANNIA) at the time of this analysis.
Data Source: TradingView & NSE India
💬 Found this useful?
🔼 Give this post a Boost if you value clean technical confluence studies.
💭 Comment your thoughts — does this wedge-breakout setup look convincing to you?
🔁 Share this post to help others understand pattern + candlestick synergy.
👉 Follow for more institutional-style technical breakdowns built on clarity and patience.
🚀 Stay Calm. Stay Clean. Trade With Patience.
Trade Smart | Learn Zones | Be Self-Reliant 📊
Search in ideas for "CANDLESTICK"

Nifty Pharma- Three White Soldiers BULLISH REVERSAL!Attached: Nifty Pharma Index Weekly Chart as of 7th April 2023
With the Week gone by,
Price has formed the 'Three White Soldiers' Candlestick Pattern on the Weekly Chart
This has MAJOR IMPLICATIONS
(Note: the 'Three White Soldiers' is a Bullish Candlestick Pattern that is used to predict the Reversal of the current Downtrend in a pricing chart.)
What Does This Mean for Investors & Traders?
- Money is flowing back into the Pharma Sector and Stocks
- There is a Trend Change of the previous Bear Trend to start of a New Bull Trend
- In addition to the Candlestick Reversal Pattern, Price has also given a Trend Line Breakout (marked as Dotted Trend Line on Chart) which is another sign for a Trend Reversal
Hence,
Bulls are now chasing the Pharma Sector so if you want to make Money on the Long Side, this is the Sector to be in !
..........................
FYI: I have already shared a Bullish Stock Pick within the Pharma Sector in my Related Ideas below. Check it out to know more.

WAVE STUDY AND INDICATOR CONFIRMATIONCRISIL seems to have completed the correction at least for a shorter term. Wave counting is clearly mentioned on the chart. I request you not to get confused with Wave 2 as it is lower than the initiation point of Wave 1 but visible in Candlestick Chart. As the correction of Wave 2 have been really sharp ie. It was completed in 8 Days with 609 Points of Up move, that is why the Wave 4 is Sideways ie. It was completed in 64 Days with 438 Points of up move.
Wave 1 , 3 & 5 are in Fibonacci Time zone sequence. Wave 1 has taken approximately 13 days for completion, where as Wave 3 has taken 32 days and Wave 5 has taken 105 days. If the mathematics is done the ratio stands to be at 1:2:3 Approximately. Hence it is a well structured wave. Wave 5 for downside seems completed now. It comprises of 5 minor waves and the end is a Truncated Wave. Where the bottom of Wave (iii) & Wave (V) of Wave 5th are same .Explaining the reasons for the truncation will take longer, so let’s skip the theory.
Few key indicators that we should focus on are ROC, RSI & Candlestick Pattern .
ROC: ROC (21 Days, Close) has breached the EMA ( 21 Days, ROC) during the formation of the bottom of Wave (iii) of Wave 5th but has taken a good support over EMA ( 21 Days, ROC) during the formation of the bottom of Wave (V) of Wave 5th. This is a sign of bullishness that cannot be ignored.
RSI: RSI (14 Days, Close) on 9th Nov at the bottom of Wave (iii) of Wave 5th was 28.25 and on 7th Dec at the bottom of Wave (V) of Wave 5th the RSI (14 Days, Close) was 31. Hence such pattern is called Exaggerated Divergence as the bottom of Wave (iii) & Wave (V) of Wave 5th are same but in RSI a higher low is formed.
Candlestick Pattern: An upside reversal is better marked with a close above previous day high and a low above previous day low. Of course this happened on 8th Dec and last time when the same happened was on 10th Nov during initiation of Wave (iv) of Wave 5th .
If we take a conservative approach the first expected target should be 3138 as per Fibonacci Retracement basis. SL should be below 2800 on closing basis.
CHART & ANALYSIS
ADARSH DEY

BUY HITACHI ENERGY INDIA LIMITEDHitachi energy India limited on strong support level as well as breakout on candlestick pattern, very small size stoploss for good amount of reward, so make a position current price and wait for fun in few days. Go long and enjoy. No Guaranteed return assured.

Multi‑Timeframe RSI Divergence Strategy with CandlesticksA confluence-based setup combining higher timeframe levels, RSI divergence, and candle signals for high‑probability swing entries . Sharing how to Create and backtest strategies on Trading view platform .
Charts used are 3 months or older .

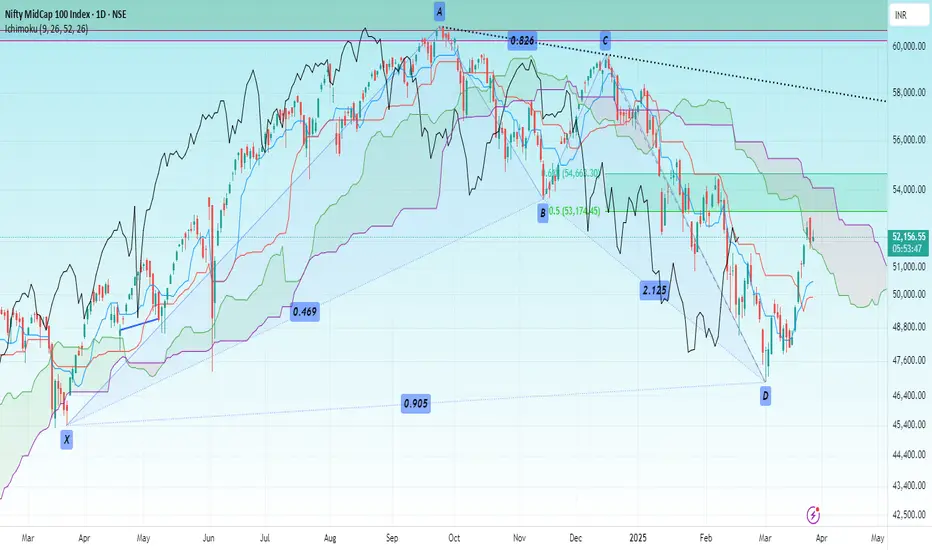
MIDCAP INDEXHello & welcome to this analysis
The index after a steep decline formed a bullish Harmonic Bat reversal pattern.
At the 50% retracement level it has formed a three candlestick bullish signal - Upside Tasuki Gap suggesting further upside.
As long as it sustains above 51500 it could continue its up move till 54500 that is the 62% retracement and above that 57500 that coincides with the trend line resistance.
All the best
Silver Weekly : BuyMCX:SILVER1! Silver weekly candlesticks settle above resistance and probably forming parabolic moves in near terms. Very good risk reward in current scenario.

Nifty Divergent AnalysisHello traders,
Here are few observations on Nifty that I would like to share with you.
✅ Tools Used
>> Bollinger Band (BB) (20,2)
>> RSI (14)
>> Candlesticks Chart (Daily)
✅ Reversal Trade Setup Criteria
>> Price outside the BB for the second time with a higher high (HH) or lower low (LL) formation
>> While price is outside BB for the second time, there is divergence on RSI (Divergence discussed below)
>> There has to be two Bearish/Bullish (as the case may be) candles, accompanying the above conditions, to take the trade
>> Target (at the very least) would be the other side of the BB
🚩Divergence is a condition when the price is making higher highs but the RSI is not. RSI would be either flat (at same level to previous swing) or lower. This means that the price is inching up but bulls are losing strength. Similarly, when price makes lower lows but RSI is making higher lows or is flat then this is also called divergence. It means bears are losing strength.
Now sit tight and observe all the setups shown on the chart (AB, CD, EF, GH) and see how they worked.
Recently Nifty made a swing high at 'I' but it was not an extreme condition because price was well contained with in the BB and not rushing outside of it. RSI was highly overbought though.
For the required setup, we need two swing highs peeking outside BB and divergence on RSI with two bearish candles to go short. Let's see if we get the same setup this time or not.
I hope you found this idea interesting.
Thanks for reading.

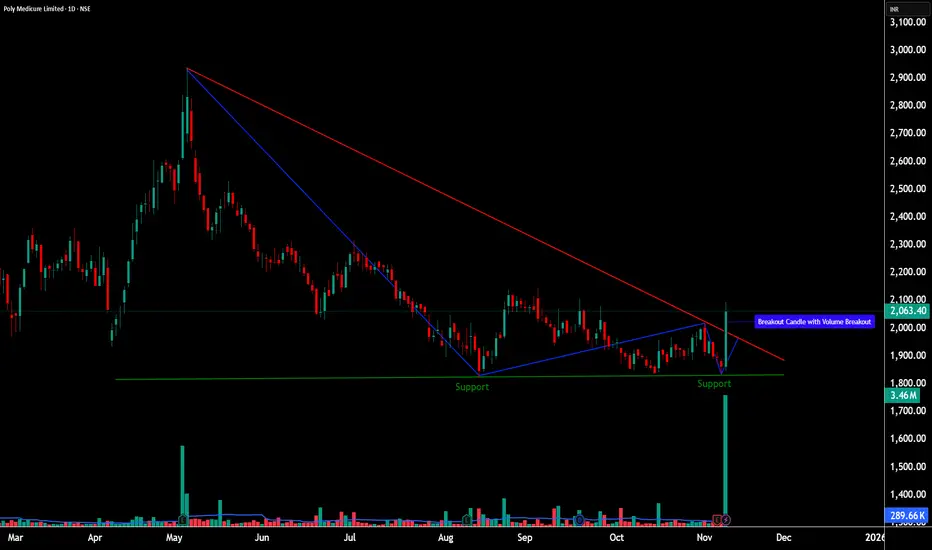
POLYMED - Breakout from Descending Triangle with Volume💹 Poly Medicure Ltd (NSE: POLYMED)
Sector: Healthcare & Diagnostics | CMP: ₹2,063.40 | View: Descending Triangle Breakout + 52-Week Volume Expansion
📊 Price Action
Poly Medicure finally broke out from a six-month descending structure with a sharp bullish candle. The move came after sustained compression near ₹1,800–₹1,850 support and resulted in a clean trendline breakout with the highest daily volume of the year.
Chart Pattern: Descending Triangle (Breakout in Progress)
Candlestick Pattern: Bullish Engulfing (Formed at Lower Boundary of Triangle – Base Support Zone ₹1,800–₹1,850)
📈 STWP Trading Analysis
STWP Trade Setup
Bullish Breakout: ₹2,094.30
Stop Loss: ₹1,829.30
Possible Intraday Demand Zone: 1869.50 - 1850.20
Possible Swing Demand Zone: 1869.50 - 1832.90
Momentum: High
Volume: 52-week breakout
This marks the possible conviction zone — where price, pattern, and participation align perfectly.
🧭 Support & Resistance
Support 1: ₹1,908 – immediate retest zone
Support 2: ₹1,752 – mid-base accumulation area
Support 3: ₹1,659 – final demand base
Resistance 1: ₹2,156 – near-term resistance
Resistance 2: ₹2,249 – previous supply pocket
Resistance 3: ₹2,404 – key breakout target zone
🔢 Fibonacci Levels
Retracement from the ₹3,000 high to ₹1,700 low shows:
38.2% level: ₹2,160
50% level: ₹2,350
📈 Volume & Momentum Setup
RSI: back above 61 — momentum returning
MACD: bullish crossover with growing histogram
CCI: high but justified by volume expansion
The breakout candle printed the highest daily volume in a year, confirming institutional accumulation.
While the weekly chart remains in recovery mode, the daily structure is already in breakout alignment.
🧩 STWP Summary View
Momentum: Strong
Trend: Early Reversal Attempt
Volume: Extremely High
Risk: Moderate (Stop below ₹1,830)
Bias: Bullish above ₹2,100 | Neutral below ₹1,850
________________________________________
⚠️ Disclosure & Disclaimer – Please Read Carefully
This post is created purely for educational and informational purposes and does not constitute investment advice or a buy/sell recommendation.
I am not a SEBI-registered investment adviser. All observations are based on technical studies and publicly available information.
Trading and investing involve risk; please manage position size and stop-loss discipline as per your risk profile.
Always consult a SEBI-registered financial advisor before making trading decisions.
________________________________________
Position Status: No active position in (POLYMED) at the time of analysis.
Data Source: TradingView & NSE India
💬 Found this useful?
🔼 Boost this post if you value clean, structured analysis.
💭 Drop your views — can Torrent Pharma sustain this breakout above ₹3,835?
🔁 Share this with traders who track institutional breakouts.
👉 Follow for more price-action based institutional setups.
🚀 Stay Calm. Stay Clean. Trade With Patience.
Trade Smart | Learn Zones | Be Self-Reliant 📊
________________________________________
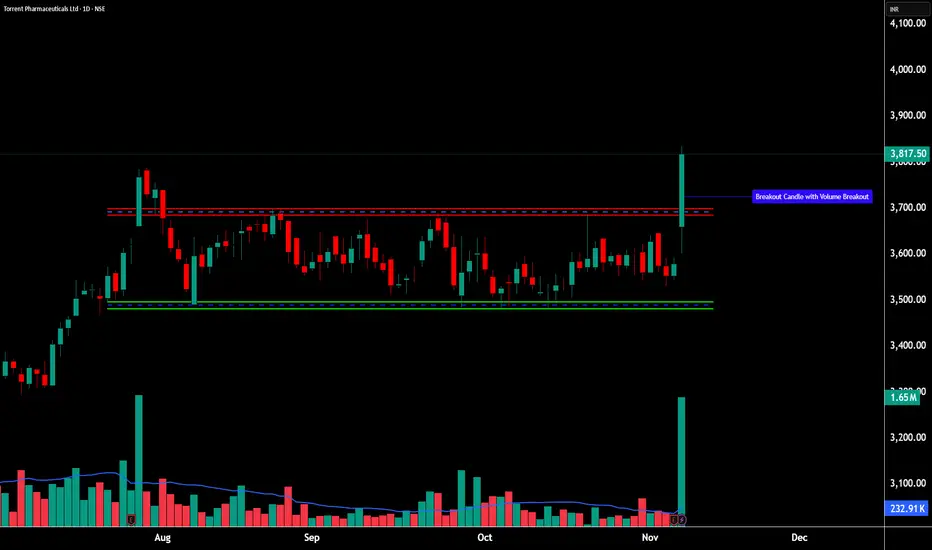
TORNTPHARM - 52-Week Breakout With Institutional Conviction________________________________________
💹 Torrent Pharmaceuticals Ltd (NSE: TORNTPHARM)
Sector: Pharmaceuticals | CMP: ₹3,817.50 | View: 52-Week Breakout With Institutional Conviction
________________________________________
📊 Price Action:
Torrent Pharma delivered a powerful 52-week breakout candle backed by exceptionally high volume, confirming strong institutional participation and renewed leadership momentum within the pharma space.
After consolidating for several weeks between ₹3,400–₹3,650, the stock broke through resistance with a wide-range bullish candle, signaling a structural shift from accumulation to expansion.
The follow-through strength and delivery volume highlight conviction buying, positioning Torrent Pharma for potential short- to medium-term trend continuation.
________________________________________
💼 HNI Trade Levels (STWP Setup):
Aggressive Entry: ₹3,817–₹3,835 | Stop Loss: ₹3,660
Low-Risk Entry: ₹3,770 | Stop Loss: ₹3,594.09
The breakout session recorded 1.65M shares vs 0.23M average, confirming institutional footprints.
Price structure has cleanly shifted into higher territory, with ₹3,665–₹3,700 now acting as the new demand base.
Sustaining above this zone keeps the bias firmly bullish with room for further upside extension.
________________________________________
📉 Chart Pattern Analysis – 52-Week Breakout (Institutional Structure):
Torrent Pharma has been in a multi-week compression phase, forming a tight base under the ₹3,700 resistance zone.
Such base formations often precede high-conviction institutional breakouts, and the explosive candle with volume confirmation validates that the breakout is not speculative but driven by genuine accumulation.
The move aligns with sectoral strength seen across quality pharma counters, where price action is transitioning from range-bound to trending behavior.
This breakout now places Torrent Pharma in the leadership bracket within the pharma index structure, supported by momentum and delivery expansion.
________________________________________
📈 STWP Trading Analysis:
Bullish Breakout: ₹3,817–₹3,835 | Stop Loss: ₹3,660.06
The breakout candle exhibited strong momentum with a 7x volume surge, indicating clear participation from institutions and long-only funds.
Price has decisively closed above short- and medium-term EMAs, confirming trend alignment across daily and weekly timeframes.
Holding above ₹3,665–₹3,700 will maintain the bullish bias, keeping the setup active toward ₹3,935–₹4,015 in the short term.
A sustained close above ₹3,935 can potentially open the next expansion leg toward ₹4,145 levels.
________________________________________
📈 Candlestick Structure – Bullish Strength Confirmation:
The breakout candle represents a strong bullish engulfing formation, signaling complete control by buyers.
The large body-to-wick ratio and volume expansion confirm institutional momentum entry rather than retail-driven strength.
Such candles following a multi-week base often mark early-stage uptrend resumption phases, where risk-to-reward remains highly favorable if trend levels hold.
________________________________________
📏 Fibonacci Analysis:
From swing low ₹3,079 to swing high ₹3,835:
61.8% retracement @ ₹3,436 → Major base support
50% retracement @ ₹3,457 → Structural accumulation zone
23.6% retracement @ ₹3,666 → Confirmed demand zone
Sustaining above the 23.6% level keeps the momentum firmly intact, while a clean close above ₹3,935 validates continuation toward ₹4,145–₹4,185 Fibonacci extension levels.
________________________________________
🧭 STWP Support & Resistance:
Resistances: ₹3,901 | ₹3,984 | ₹4,134
Supports: ₹3,667 | ₹3,518 | ₹3,344
The ₹3,665–₹3,700 area remains the immediate accumulation pocket, aligning with EMA support and Fibonacci confluence.
The breakout above ₹3,835 confirms strength, while supports around ₹3,500 represent deeper institutional demand zones.
________________________________________
📊 STWP Volume & Technical Setup:
Today’s session saw 1.65M shares traded vs 0.23M average, validating strong institutional accumulation and conviction buying.
Indicators confirm trend strength:
RSI (70+) – sustaining above bullish zone.
MACD – positive crossover maintained.
CCI & Stochastic – both elevated, reflecting momentum expansion.
Overall alignment across daily and weekly charts confirms trend continuation potential.
Trend Direction: UPTREND | Volume Confirmation: Strong Institutional Activity
________________________________________
🧩 STWP Summary View:
Final Outlook:
Momentum: Strong | Trend: Bullish | Risk: Moderate | Volume: High
Torrent Pharma’s breakout signifies a transition from accumulation to expansion, supported by clear institutional conviction and strong technical structure.
As long as the price sustains above ₹3,665–₹3,700, the bias remains bullish with targets toward ₹3,935–₹4,145 in the near term.
The setup continues to display a clean risk–reward framework within an evolving leadership trend in the pharma sector.
________________________________________
⚠️ Disclosure & Disclaimer – Please Read Carefully
This post is created purely for educational and informational purposes and does not constitute investment advice or a buy/sell recommendation.
I am not a SEBI-registered investment adviser. All observations are based on technical studies and publicly available information.
Trading and investing involve risk; please manage position size and stop-loss discipline as per your risk profile.
Always consult a SEBI-registered financial advisor before making trading decisions.
________________________________________
Position Status: No active position in (TORNTPHARM) at the time of analysis.
Data Source: TradingView & NSE India
💬 Found this useful?
🔼 Boost this post if you value clean, structured analysis.
💭 Drop your views — can Torrent Pharma sustain this breakout above ₹3,835?
🔁 Share this with traders who track institutional breakouts.
👉 Follow for more price-action based institutional setups.
🚀 Stay Calm. Stay Clean. Trade With Patience.
Trade Smart | Learn Zones | Be Self-Reliant 📊
________________________________________
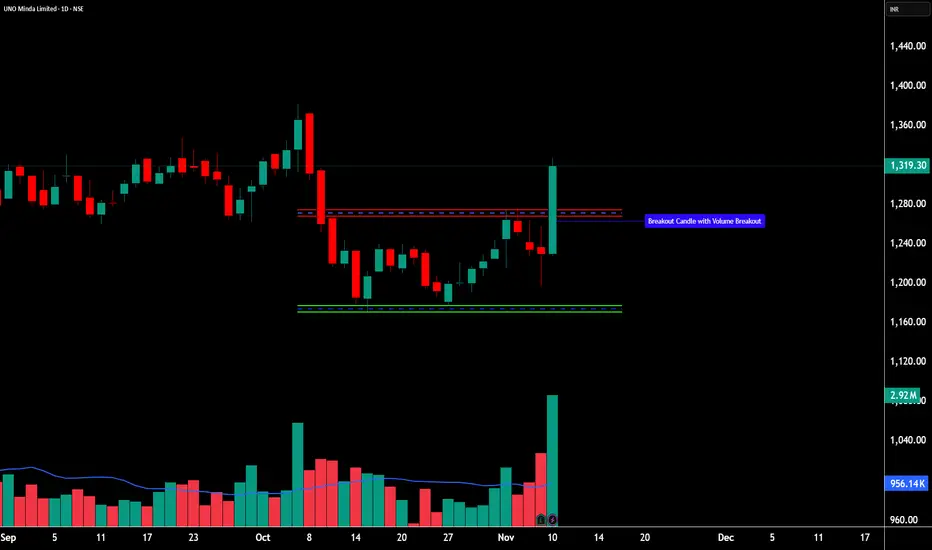
UNOMINDA - Institutional Breakout After Price Compression________________________________________
💹 UNO Minda Ltd (NSE: UNOMINDA)
Sector: Auto Components | CMP: ₹1,319.30 | View: Institutional Breakout After Price Compression
________________________________________
📊 Price Action:
UNO Minda has delivered a strong breakout candle after a prolonged phase of price compression within a rising channel, confirming a shift from consolidation to directional momentum.
The stock rebounded sharply from the ₹1,190 zone and pierced through the upper trendline with an exceptionally high volume spike, signaling renewed institutional interest.
This breakout structure now positions the stock for a potential continuation move as long as price sustains above the ₹1,255–₹1,270 support base.
________________________________________
💼 HNI Trade Levels (STWP Setup):
Aggressive Entry: ₹1,319–₹1,327 | Stop Loss: ₹1,238.57
Low-Risk Entry: ₹1,297 | Stop Loss: ₹1,210.74
The breakout candle recorded volume of 2.9M vs 0.95M average, confirming heavy accumulation and strong HNI participation.
The near-term momentum bias remains bullish, supported by both volume expansion and favorable price structure.
________________________________________
📉 Chart Pattern Analysis – Compression Breakout (Bullish Structure):
Over the past few weeks, UNO Minda formed a rising channel pattern characterized by narrowing ranges and lower volatility — a classic price compression structure.
This phase often precedes large directional moves, and the breakout above ₹1,310 confirms the volatility expansion phase.
Such structures typically indicate early-stage accumulation by institutional hands before momentum expansion begins.
The confirmation of breakout with both volume and candle strength reflects clear smart money participation.
________________________________________
📈 STWP Trading Analysis:
Bullish Breakout: ₹1,319–₹1,327 | Stop Loss: ₹1,195.20
The breakout candle displayed strong momentum and 3x volume expansion, validating aggressive buying from higher timeframes.
Price action has now closed firmly above short- and mid-term EMAs, aligning all major timeframes — Daily, Weekly, and Monthly — in a unified uptrend.
Holding above ₹1,255–₹1,270 will maintain the bullish bias, keeping the setup active toward ₹1,379–₹1,420 in the near term.
A decisive close above ₹1,355 could further accelerate the next leg of the uptrend, extending the move toward ₹1,455.
________________________________________
📈 Candlestick Structure – Bullish Engulfing Confirmation:
The current breakout candle is a strong bullish engulfing formed after a brief sideways phase — signaling renewed dominance of buyers.
Such candles, especially when paired with volume spikes and EMA crossovers, mark the beginning of institutional-led expansion legs.
The price-volume confluence validates that the short-term correction phase has likely ended, and the stock is transitioning into an active swing momentum phase.
________________________________________
📏 Fibonacci Analysis:
From swing low ₹1,114 to swing high ₹1,327.8:
61.8% retracement @ ₹1,190 → Strong support zone defended.
78.6% retracement @ ₹1,255 → Current breakout retest area.
100% extension @ ₹1,327 → Confirmed expansion level.
Sustaining above ₹1,255 keeps the structure intact and supports continuation toward the ₹1,379–₹1,420 target band.
________________________________________
🧭 STWP Support & Resistance:
Resistances: ₹1,355 | ₹1,391 | ₹1,456
Supports: ₹1,255 | ₹1,191 | ₹1,155
The ₹1,255–₹1,270 zone remains a high-probability demand pocket, supported by both Fibonacci confluence and recent volume base formation.
The ₹1,355–₹1,390 zone acts as a minor resistance band, where partial booking or temporary supply may appear before momentum resumes.
________________________________________
📊 STWP Volume & Technical Setup:
Today’s breakout session recorded 2.92M shares vs 0.95M average, confirming exceptional institutional participation.
Indicators such as RSI (68.7) and MACD bullish crossover reinforce the continuation potential.
Stochastic and CCI both remain in strong zones, consistent with trend alignment across timeframes.
Trend Direction: UPTREND | Volume Confirmation: Strong Institutional Activity
________________________________________
🧩 STWP Summary View:
Final Outlook:
Momentum: Strong | Trend: Bullish | Risk: Moderate | Volume: High
UNO Minda has transitioned from a consolidation phase into a clean institutional breakout setup.
The combination of price compression, breakout volume, and bullish engulfing confirmation signals a fresh impulse wave beginning within the existing uptrend.
Holding above ₹1,255–₹1,270 will sustain the bullish structure, with potential upside toward ₹1,420–₹1,455 zones in the coming sessions.
________________________________________
⚠️ Disclosure & Disclaimer – Please Read Carefully
This analysis is intended solely for educational and informational purposes and does not constitute investment advice or a buy/sell recommendation.
I am not a SEBI-registered investment adviser. All observations are based on chart study, technical structure, and publicly available data.
Trading involves risk; please manage position size, stop-loss levels, and discipline as per your risk appetite.
Consult a SEBI-registered financial advisor before acting on any trade setup.
________________________________________
Position Status: No active position in (UNOMINDA) at the time of analysis.
Data Source: TradingView & NSE India
💬 Found this useful?
🔼 Boost this post to help more traders learn from structured setups.
💭 Drop your insights — how do you view this breakout’s sustainability?
🔁 Share with traders who value clean, volume-backed analysis.
👉 Follow for more price structure + institutional logic breakdowns.
🚀 Stay Calm. Stay Clean. Trade With Patience.
Trade Smart | Learn Zones | Be Self-Reliant 📊
________________________________________
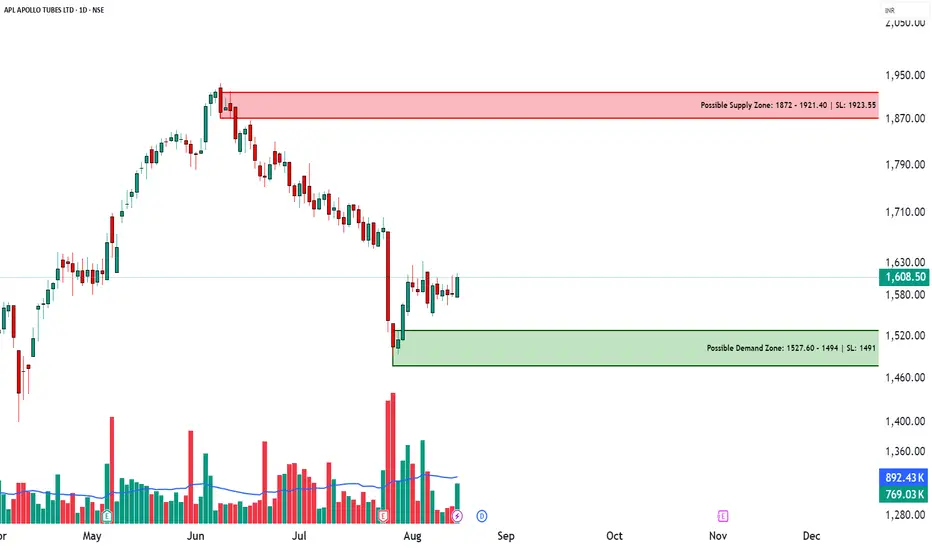
APLAPOLLO – Technical & Educational Snapshot📊 APLAPOLLO – Technical & Educational Snapshot
Timeframe: Daily / Weekly / Monthly
Overall Bias (for learning): ⭐⭐⭐⭐ Moderately Bullish – supply & demand zones identified, breakout study in progress
🔹 Candlestick Observations
Daily Bullish Piercing → Bullish Engulfing Buyers showing short-term strength
Weekly Three Black Crows → Bullish Engulfing Bearish pressure absorbed; case study of reversal attempt
Monthly NA No clear signal on higher timeframe
🔹 Supply & Demand Zones (Learning Reference)
Supply Zone (Resistance area): ₹1872 – ₹1921.40
(Stop Loss Ref: 1923.95 → possible invalidation if breached)
Demand Zone (Support area): ₹1494 – ₹1527.60
(Stop Loss Ref: 1491 → possible invalidation if broken)
🔹 Technical Observations
✅ Strong bullish candles forming
✅ Bullish Engulfing → buyer dominance visible
✅ Open = Low → intraday bullish bias illustration
✅ Double Wick → rejection from lower levels
✅ Breakout probability higher if weekly channel is cleared
📊 Volume Study
Any breakout is more reliable when supported by higher-than-average volume.
Traders typically wait for volume confirmation alongside bullish candlestick follow-through before validating a breakout.
📌 Summary (Learning View Only)
APLAPOLLO is a useful case study in demand-supply dynamics and bullish engulfing setups.
Lesson: Breakouts above consolidation + volume confirmation often strengthen trend continuation.
⚠️ Disclaimer (SEBI-Compliant)
This post is for educational & informational purposes only. It is not a buy/sell recommendation, not research, and not investment advice.
I am not a SEBI-registered advisor. Examples are for learning through chart patterns and public market data. Please consult a SEBI-registered financial advisor before making investment decisions.
💬 Found this useful?
🔼 Tap Boost so more traders can learn from structured analysis.
✍️ Share your views in the comments — let’s grow together.
✅ Follow @simpletradewithpatience for clean, zone-based setups & beginner-friendly market education.
🚀 Stay Calm. Stay Clean. Trade With Patience.
Trade Smart | Learn Zones | Be Self-Reliant 📊
TRENT LTD – INTRADAY ZONE ANALYSIS________________________________________________________________________________
📈 TRENT LTD – INTRADAY ZONE ANALYSIS
📆 Date: July 1, 2025 | ⏱ Timeframe: 15-Minute Chart
🔍 Educational Analysis for Learning Purposes Only
________________________________________________________________________________
📊 Zone Breakdown:
• 🔴 Top Range Resistance – 6,261
Marked in Red: This is a key supply zone where the price has previously stalled. Traders should watch for bearish reversal candlestick patterns like a bearish engulfing, evening star, or long upper wick rejection. A lack of follow-through volume here may indicate exhaustion.
• 🟠 Neutral Zone – Avoid Trade Area (6,155 – 6,210)
Marked in Orange: Price tends to be indecisive here. This is a “no trade zone” unless supported by a strong trend direction and setup. Historically, it has shown sideways movement and choppy behaviour.
• 🟢 Demand Zone – 6,105 to 6,066.50 | SL: 6,058.10
Marked in Green: Price reacted sharply from this zone with rising volume. A bullish engulfing candle confirmed demand here. Ideal for watching pullback opportunities on re-tests, supported by bullish confirmation candles.
• 🟩 Bottom Support – 5,968
A strong base level. A breakdown below this zone may signal a shift in short-term structure. Look for volume spike and wide-bodied red candle for bearish confirmation.
________________________________________________________________________________
🔍 Candlestick Observation:
At the Top Resistance Zone (6261), recent candles show upper wicks and indecision, but no strong bearish reversal yet. Volume is elevated, signaling activity, but candles show hesitation.
🧠 Interpretation: This could be an early sign of supply pressure. A follow-up bearish engulfing or strong rejection candle may validate a reversal. Until then, price may consolidate within the zone.
________________________________________________________________________________
⚙️ Educational Trade Ideas (Study Purpose Only)
▶️ Reversal Setup – Bearish Bias
• Entry: Below ₹6,190 on confirmation candle from resistance zone
• Stop Loss: Above ₹6,265
• Risk-Reward: 1:1 | 1:2 +
• 🧠 Ideal for learning how price reacts to supply after a sharp rally
________________________________________________________________________________
▶️ Pullback Setup – Bullish Bias
• Entry: Near ₹6,100–₹6,110 on bullish confirmation from demand zone
• Stop Loss: ₹6,058
• Risk-Reward: 1:1 | 1:2 +
• 🧠 A classic “Breakout–Retest–Continuation” setup with proper risk management
________________________________________________________________________________
⚠️ Disclaimer (SEBI-Compliant):
This content is shared strictly for educational and informational purposes only. It does not constitute investment advice or a trading recommendation. Always consult a SEBI-registered financial advisor before making investment decisions.
STWP | Learn. Trade. Grow.
________________________________________________________________________________
💬 What do you think about this TRENT setup?
Did you observe any volume divergence or trendline reaction?
👇 Drop your insights in the comments — let’s grow together!
________________________________________________________________________________
Bonus:

MARUTI SUZUKI INDIA LTD. – INTRADAY ZONE ANALYSIS________________________________________________________________________________📈 MARUTI SUZUKI INDIA LTD. – INTRADAY ZONE ANALYSIS
📆 Date: June 29, 2025 | ⏱ Timeframe: 15-Minute Chart
🔍 Educational Analysis for Learning Purposes Only
________________________________________________________________________________
📊 Zone Breakdown:
• 🔴 Top Range Resistance – 12,848
Marked in Red: This area has previously acted as a supply zone, where prices were rejected sharply. It is a potential region to watch for bearish reversal patterns, especially if price rises into this zone on weak volume or shows rejection candles like shooting star or bearish engulfing.
• 🟠 Neutral Zone (No Trade Zone) – Between ~12,720 to ~12,680
Marked in Orange: This is an indecision zone, where price has shown choppiness in the past. It is advisable to stay cautious and avoid trades here, as clear momentum is often missing in this range.
• 🟢 Support Zone – 12,617
Marked in Green: This is the demand zone, where price previously reversed on higher volume. It is a good region to observe for bullish candlestick confirmation patterns (e.g., hammer, bullish engulfing, morning star) on intraday timeframes.
________________________________________________________________________________
🔍 Candlestick Pattern Observation:
At the support zone (12,617), the most recent candle (the last one) shows a long lower wick with a bullish body, forming a bullish hammer-like structure.
• 🧠 Interpretation: This suggests possible buying interest at lower levels, especially since it coincides with volume spike, indicating potential reversal.
• 📌 However, confirmation from the next candle (closing above 12,670 with decent volume) would be required before validating it as a bullish reversal.
________________________________________________________________________________
⚙️ Educational Trade Idea (For Study Purpose Only):
▶️ Potential Long Trade Setup (Bullish Bias)
• Entry (Low-Risk Learner Zone): Around 12,670–12,675, only if next candle shows bullish strength
• Stop Loss: Below 12,617 (zone low) → e.g., 12,600
🧠 Reasoning:
• Price is reacting from a well-identified demand zone
• Volume spike confirms possible accumulation
• Candle with rejection wick hints at reversal interest
• Risk-reward approx. 1:2 or better depending on exit point
________________________________________________________________________________
⚠️ Disclaimer (SEBI-Compliant):
This analysis is shared strictly for educational and informational purposes. It does not constitute investment advice or a recommendation to trade. Viewers are encouraged to use this for learning technical chart reading and should consult a registered advisor before making any financial decisions.
STWP | Learn. Trade. Grow.
________________________________________________________________________________
What do you think about this setup?
Did you spot any other patterns or zones?
👇 Drop your comments below — let’s grow together!
________________________________________________________________________________

GSPL - Gujarat State Petroleum Corporation Bullish ViewGSPL charts have formed a bullish engulfing candlestick pattern.
You can use this opportunity because it has a very good risk to reward ratio.
Entry: Long above ₹389.80 (the high of the bullish engulfing candle)
Stop-Loss: Short below ₹368 (the low of the bearish candlestick before the bullish engulfing pattern)
Take-Profit: This will depend on your risk tolerance and trading goals. based on a 1:2 or trailing basis 1:3 Risk to reward Ratio
Risk Management: Always remember to practice good risk management. Only risk a small percentage of your capital on each trade.
Disclaimer: This is not financial advice. Please do your own research before making any trading decisions.
Remember, trading involves risk. I can't guarantee that this trade will be successful.
Also dont forget to share and boost, thank you for all your love and keep supporting like you do, helps me work harder..

Gold Elliott - 5 Waves to top 2488 - Tower Top Candlestick
Recent Performance Update
As per the last idea published, we saw a significant bounce of $184 following the post-triangle analysis.
Last Idea on Gold
Clear 5-Wave Structure from 2304 Bottoms
Yellow metal has unfolded a clear 5-wave structure from the bottoms of 2304 to 2488 & reversal candle is unfolding from the tops of 2488.
Reversal Candle in Play
The Bearish Tower Top is a reversal candlestick pattern typically observed at the top of the trend which can be seen unfolding in the current scenario at the tops of 2488.
Bearish Tower Top Candlestick Pattern
A strong bearish candle has taken out the lows of the last few candlesticks while going up, which can be a strong signature unfolding in favor of the bears.
Bearish Signature Unfolding at 2488 Tops
Slipping below 2465, Gold has key and minor support at 2406 lows. Once the lows of 2406 and 2400 support zone are breached, Gold can slip down to important levels at 2355 and 2305 lows.
From WaveTalks
Abhishek

ETC: Look for Confirmation Near Previous Resistance💎 ETC is currently exhibiting a bullish market structure and is undergoing a retest of the support zone, which was previously a resistance level. This zone may now act as support since it has been broken.
💎Analyzing past chart data reveals that there is potential for a bounce from the bullish interest zone, especially if ETCUSDT forms bullish engulfing candlesticks. Confirmation of this bounce would require seeing bullish engulfing patterns from our support zone and smaller support levels. In such a scenario, we can anticipate targets until the next resistant levels.
💎However, if ETC breaks down below our support levels without showing any bullish confirmation, it would be advisable to refrain from trading ETC in that scenario and wait for better price action to form before making any decisions.

[1H] M_M Mahindra &Mahindra SELL1. Chart clearly shows Support and Resistance Zone.
2. It takes two supports and one resistance with confirmation.
3. The confirmation candles is Bearish Engulfing candlesticks.
4. Trend is actually going down.
5. Pure Price Action with naked chart.
6. Stop Loss and Take Profit clearly mentioned in the chart.

ShreeCem - Long Candidate - Bullish Harami - Weekly OverviewNSE:SHREECEM looking ripe for a good R:R trade on upside with last week's candle closing as Bullish Harami candlestick. I would wait for 25550 to be taken out as that is a small resistance and then enter the trade with SL of Friday's candle. One can looking for upside target of 26340
Let's see how the story develops. Best wishes!
Disclaimer -
- The opinions expressed here are my own. This is for my own records as well as what I see on charts.
- If you are referring to this, please keep in mind that it is only for educational and research purposes.
- Past performance is no guarantee of future results.
- You must accept responsibility for any decision you make. DO NOT TAKE THIS AS AN INVESTMENT RECOMMENDATION.
- It's your hard-earned cash. Trade / Invest wisely, keeping in mind your trading style, goals and objectives, time horizon, and risk tolerance.
- Before investing, conduct your own research and consult with a financial advisor.
TIA!

SASKEN TECHNOLOGY BREAKOUT Lets look at the candlestick pattern that i have marked on the chart, its a morning star. a perfect setup for reversal. can go long as it has given a breakout today closing above the resistance. targets and stoploss are both marked in the chart.

Cholamandalam Investment and Finance Company Ltd.DATE - AUG 02, 2021.
1. Cholamandalam Investment bounce from previous SUPPORT.
2. Formation of Bullish Engulfing candlestick. (DAILY CHART)
3. High traded and delivered QTY.
4. High increase in OPEN INTEREST.

Late night Technical analysis talk - TCS, HCL, INFY👑 Terms used if you don't know :
✣ Contraction pattern: A pattern starting with a broadening high candlestick and low candlestick and converging to a fixed point, these highs and lows created in between them are bulls vs bears fight going on inside the pattern and if it comes to the lower part of it, surely bulls will take it to the topmost point and vice-versa until one of them wins
✣ Structure and trend: Two types of trends that exist in the market today are uptrends and downtrends. Each type of trend tells a different story and has its own impact on a trader's success in the market. While uptrends show a series of higher highs and higher lows, downtrends show lower highs and lower lows
✣Breakout: Breakouts are commonly associated with ranges or other chart patterns, including triangles( HERE WE WILL SEE THIS ONE ), flags, wedges , and head-and-shoulders. These patterns are formed when the price moves in a specific way which results in well-defined support and/or resistance levels. Traders then watch these levels for breakouts
✣ RSI DIVERGENCE: A bullish divergence occurs when the RSI creates an oversold reading followed by a higher low that matches correspondingly lower lows in the price. This indicates rising bullish momentum, and a break above oversold territory could be used to trigger a new long position.
✣ Supply/ Demand: In the supply zone , the prices are higher than the bid price, and in the demand zone , they are lower. The bid price is what a trader is willing to pay for a stock
👑 Important levels - explained well
👑 Comment your thoughts and queries regarding anything on this analysis of mine, feel free buddy :)
⌛ Motivational and psychological area ⌛
✣Trade only if you are in the right mindset, if you have been emotionally weak for some time, take your time and don't trade, trade with a happy and + mindset only.
✣If you want to make money, firstly be prepared to lose it, only that much which you can afford and that much by which you can make a mistake again, learn from them and grow
✣Don't lose hope and keep grinding
✣I have seen my friends on youtube streaming games with watching 10, constantly they streamed for a year or two and now they are buzzing with 1k to 2k watching daily.
✣Focus on the process, you are here to make money not stupid decisions and lose it all
✣No one will help you climb the mountain, few will tell the path, so follow good people, make good mentors and make good decisions and choices in the stock market.
✣Believe in yourself :)
🎓🎓 Some info about me :)
➼My name is Apoorv and I am a 2nd year Engineering student, I want to pursue trading as my career, and thus whatsoever setups or trades I potentially see on my charting platform, I post it here and share them with you all.
➼I hope you will love my simple analysis style.
➼Feel free to suggest your view on this as learning is earning here :)
➼I take my trades on my Zerodha account :)
➼I don't take all the trades I post
➼These charts are my and only my work, my thought process, just from an educational point of view and no calls.

Potential Good setup in LUPIN - 4 to 8% 👑 Terms used if you don't know :
✣ Contraction pattern: A pattern starting with a broadening high candlestick and low candlestick and converging to a fixed point, these highs and lows created in between them are bulls vs bears fight going on inside the pattern and if it comes to the lower part of it, surely bulls will take it to the topmost point and vice-versa until one of them wins
✣ Structure and trend: Two types of trends that exist in the market today are uptrends and downtrends. Each type of trend tells a different story and has its own impact on a trader's success in the market. While uptrends show a series of higher highs and higher lows, downtrends show lower highs and lower lows
✣Breakout: Breakouts are commonly associated with ranges or other chart patterns, including triangles( HERE WE WILL SEE THIS ONE ), flags, wedges , and head-and-shoulders. These patterns are formed when the price moves in a specific way which results in well-defined support and/or resistance levels. Traders then watch these levels for breakouts
✣ RSI DIVERGENCE: A bullish divergence occurs when the RSI creates an oversold reading followed by a higher low that matches correspondingly lower lows in the price. This indicates rising bullish momentum, and a break above oversold territory could be used to trigger a new long position.
✣ Supply/ Demand: In the supply zone , the prices are higher than the bid price, and in the demand zone , they are lower. The bid price is what a trader is willing to pay for a stock
👑 Important levels - explained well
👑 Comment your thoughts and queries regarding anything on this analysis of mine, feel free buddy :)
⌛ Motivational and psychological area ⌛
✣Trade only if you are in the right mindset, if you have been emotionally weak for some time, take your time and don't trade, trade with a happy and + mindset only.
✣If you want to make money, firstly be prepared to lose it, only that much which you can afford and that much by which you can make a mistake again, learn from them and grow
✣Don't lose hope and keep grinding
✣I have seen my friends on youtube streaming games with watching 10, constantly they streamed for a year or two and now they are buzzing with 1k to 2k watching daily.
✣Focus on the process, you are here to make money not stupid decisions and lose it all
✣No one will help you climb the mountain, few will tell the path, so follow good people, make good mentors and make good decisions and choices in the stock market.
✣Believe in yourself :)
🎓🎓 Some info about me :)
➼My name is Apoorv and I am a 2nd year Engineering student, I want to pursue trading as my career, and thus whatsoever setups or trades I potentially see on my charting platform, I post it here and share them with you all.
➼I hope you will love my simple analysis style.
➼Feel free to suggest your view on this as learning is earning here :)
➼I take my trades on my Zerodha account :)
➼I don't take all the trades I post
➼These charts are my and only my work, my thought process, just from an educational point of view and no calls.
☃☃☃☃ Thank You Have a Nice Trading Day ☃☃☃☃
