Yesbank - Trendline Breakout It has been observed that the price action breaks out above the 6 months trendline and confirmed the breakout by re-testing of trendline by forming a bullish candlestick. The breakout is also confirmed by the RSI Bullish Divergence. Therefore, price action is expected to go further up from here on. T1-17.5, SL 14
Search in ideas for "CANDLESTICK"

Aarti ind shortAarti ind short
Bearish engulfing Candlestick pattern
Wait for close below 1680
Sell at- 1675
SL-1820
Target open
Disclaimer- We are not SEBI registered advisor.
Charts and views are only for educational purpose.

TITAN,1HrAs per the Trend and Candlestick pattern analysis market will fall down will try to hit the support level

TITAN,1HrAs per the candlestick pattern and trend analysis the hanging man is at resistance market will reverse from resistance will try to hit the support

JSWsteel | Three Line Strike Candle stick Pattern spotted 🎯⭕ Positional Trading opportunity! 4hrs Chart Alert !!!⭕
--Buy Above =411 or CMP
--Target = 426.95 | 451
--Stop-loss = 393.90
--R:R =2.34
--Expected Profit = 9.78 %
--Expected Holding = 30 days only
#ThankU For Checking Out Our Content, We Hope U Liked It 🎈
======================================================
⭕Technical Reasons to trade or Strategy applied:- ⭕
1) Stock has formed flag pattern & has given the breakout
2) Three line candlestick pattern is observed clearly in the chart
3) Volume is good enough
4) Target is based on Fibonacci levels & pattern height & resistance level as well
______________________________________________________________________
Why to follow............. #TradeTheTip ?
📍No junk in our charts
📍Follow-up updates till the end
📍Detailed Price Action Analysis
📍10+ years of experience
📍Accurate Support & resistance Levels
📍Covering Swing, Short-term & positional trading
📍Educational content every SUNDAY
________________________________________________________________________
DISCLAIMER Alert:-
❌ All posts are for Educational Purpose Only.
❌ Analyze your own before Considering mine.
❌ Know your RISK & HOLDING capacity.
❌ TradeTheTip is not responsible for any of your profit/Loss.
------------------------------------------------------
Guys check out the related POST as well, it went FANTASTIC !
🙏FOLLOW for more !
👍LIKE if U find it useful !
✍COMMENT your views & feedback !
-----------------------------------------------
Regards,
TradeTheTip Global Research Pvt.Ltd.

KOTAK BANK | Doji Pattern with Really High Volume 🎯NSE:KOTAKBANK
Swing trading opportunity ...4hrs chart alert !!!
👉👉WAIT FOR RETRACEMENT OR TRADE ACTIVE RECOMMENDATION👈👈
--Sell below =1850
--Target = 1740
--Stop-loss = 1915
--Lot Size = 400
--R:R = 1.68
--Expected Profit = 43,600 ₹ per lot ( 6 % )
Technical Reasons to trade :- 🧢
1) Kotak bank has breakdown the support area .
2) Volume is ULTRA high in DOJI candlestick pattern.
3) trendline is already broken as well as support zone .
4) All the possible support & resistance is mentioned on the chart.
Guys check out the related ideas as well, it will worked really well !
🙏FOLLOW for more !
👍LIKE if think is useful !
✍COMMENT Below your view !

Bank Nifty - Bearish engulfing candlestickBank Nifty corrected over 500 points today and formed an bearish engulfing candlestick.
It is looking weak on other indicators / oscillators too, 9 EMA on 21 RSI indicator did gave an SELL signal neat 30980 levels.
Bank Nifty closed at 30541, if it sustains below 30512, 30390 and 30240 can be expected.
Any move and sustaining above 30680 may strengthen the bulls for upside targets of 30774, 30822, 30940
"Puneet_9EMA_21_RSI" is a simple and reliable indicator, many of us have been using it for a few months as it has given some unbelievable "Enter" and "Exit" signals, all very close to the tops and bottom.
++++++++++++++++++++++++++++++++++++++++++++++++++++++++++++++++++++++++++++++++++++++++++++++
This post is not an advice to speculate using leveraged products, one must thoroughly understand the financial implications, consult some financial adviser before taking any positions.
++++++++++++++++++++++++++++++++++++++++++++++++++++++++++++++++++++++++++++++++++++++++++++++
Please consider hitting the LIKE button below the chart, if you find this post / idea worthy. You may also FOLLOW me over this forum for periodic updates on Nifty , Bank Nifty and bullion.

Britannia forming Morning star Pattern at major support & VolumeHi Traders,
Britannia forming Morning star Pattern at major support with good Volume.
Bullish View on stock due to below point:
1) Britannia has taken support at major support (22250-2400) ,which was major consolidation / support zone in Jan -Feb 2018 times. See chart for more detail.
2) It has form reversal pattern of morning star candlestick pattern with good volume.
What Indicator are says:
1) RSI out of oversold position & RSI above 40 will take stock out of bear control.
2) Stochastics RSI has make advance breakout , which tell bull control in near term. See chart for more detail.
Target :
T1 : 2620 (Book 50-70 % as per risk capacity)
T2 : 2730 -2830 zone. (Book remaining 20 % profit)
T3: 2930 zone (Hold remaining 10 % & can add new position if stock sustain good period of time above 200 sma)
Strict Stoploss : 2300 low of Morning star pattern
Happy Learning );
Disclaimer : This is post only for educational purpose . Do your analysis before taking position or trading.

NIFTY CRASHnifty forms strong bearish candlestick. resistance 11830,11887 support 11775,11757,11733,11640,11565

BTST IN NIITECH JAN (FUT)BTST IN NIITECH
NOTE:IS ALSO GIVEN AS A POSITIONAL TRADE EARLIER
ADD UP TRADE
HOLDING MOVING AVERAGES WITH
A PIERCING LINE CANDLESTICK PATTERN
ITS LOOKING GOOD FOR A BREAKOUT
JAN FUT TRADE
BUY@1155
STOP@1140
TARGET@1172
LOT:750
QTY:1

buy eichermotors cuurently the market is in major trend line levels (green colour) which is in confluence with support levels (red colour) candlesticks forming engulfing patterns ( currently, candlesticks may change at the end of day ) on daily charts giving some indication for buying opportunity we can expect an upmove upto 3800 levels

ALBK -Magical Words-Sim Sim Door opened@66 for 80+ & H&S PatternWe continue with ALBK (Allahabad Bank) as suggested in the previous post that we can plan to buy ALBK if it comes close to 65-66 Zone- Traders should look to buy if it remains above 65 which was our stops downside
I have updated previous post twice when it was close to 65-67 Zone - Please say - "khul ja sim sim" the magical door opened & obliged us by holding above 65 -an important level.
How this magical word was connected with Technical Analysis.
Double Bottom
Trendlines
Bullish Candlestick pattern
Head & Shoulder
Double Top next at 73.50 levels - these are magical words - Sim Sim for an analyst in the world of Technical Analysis.
Now, let the journey continue above double top@73.50 with post breakout above Head & Shoulder Pattern.
Target Measurement
Measure the distance from head bottom to the neckline - keep the same distance (in our case it is vertical red trendline) above the neckline so we get target as 79-80 Next.
Trading Psychology / Investment Psychology
Set of few questions as mentioned below by Dr. Van K.Tharp, which can help in becoming a better trader are
"(1) To recognize trading opportunities,
(2) To organize your investment information and manage risk,
(3)To wait for the right opportunity,
(4)To avoid failure thinking,
(5)To prevent your personal life from interfering with your investments, and
(6)To be responsible for your investment. In addition, the test measures
(7)The extent to which you invest to make money compared with other investors and
(8)The extent you have defense mechanisms that prevent you from becoming successful. Finally, you can compute an overall percentile ranking which allows you to compare yourself to other investors in terms of your overall investment psychology skills."
Clearly, this is valuable information. In fact, simply filling out the form can provide real insight,
This can be of real value or insight if Dr. Tharp delivers the analysis for above set of questions - Does he?
For this you can refer - Book -Invest Psychology Inventory by Van K. Tharp or You can read the book - " Trading Beyond the Matrix" by Van K. Tharp.
Previous Update - Lawyer back in courtroom


Tirupati Sarjan Ltd#stocks #investing #swing #trading #technical #RSI #candlesticks
Key Points:
1. Support at ₹15-16: The stock has shown strong support at this level, as evidenced by multiple bounces. This suggests that buyers are stepping in at this zone, making it a crucial level to watch.
2. RSI Crossover with 14 EMA: The crossover of RSI above the 14-day EMA is a bullish signal, indicating increasing momentum. If the RSI continues to rise, it could suggest further upside potential.
3. Weekly Hammer Pattern: The hammer candlestick pattern on the weekly chart is often a bullish pattern, especially forming at support levels. It signifies that buyers are rejecting lower prices, which could lead to further price appreciation.
4. Resistance at ₹20-21: The resistance zone around ₹20-21 is an important hurdle. If the stock breaks through this resistance with volume, it could signal a breakout and lead to higher levels.
5. Stop-Loss: If the stock breaks below ₹15, it could invalidate the bullish outlook, and further downside may follow. Hence, view will be neglected if price breaks below ₹15.
Strategy:
• Bullish Bias: As long as the stock holds above ₹15, the technical indicators suggest a bullish view, with potential upside towards the ₹20-21 resistance zone.
• Breakout Watch: A close above ₹21 could trigger further bullish momentum, opening the door for higher targets.
• Risk Management: Set a stop-loss below ₹15 to protect against potential downside in case the support breaks.
NOTE: This is a risky trade/analysis considering it’s a penny stock. Penny stocks can be highly volatile, illiquid, and subject to significant price fluctuations. Do your own due diligence and assess your risk tolerance before investing.

CNXMetal or Nifty Metal - Outlook For Coming WeeksNSE:CNXMETAL index is looking weak on charts with multiple bearish formations in place. Referring to candlesticks, last week's close has come with 3 inside down candles. Though this candlestick pattern is not completely reliable, it suggests price making lower lows and the index is witnessing pressure!
On last week's candle, it also formed a bearish marabozu which shows the intent of sellers selling the stock at any given price. Last week's close also came below 100 EMA and if the selling pressure continues, I won't be surprised if this index heads towards 200 EMA on weekly which is placed at 4858.
Short term targets on downside would be 5293 and 5174. If a close comes below 5174, I can be certain that the price will head to 200 EMA positionally. Also 5174 is below 5209 ( weekly swing low )
Let's see how the story develops. Best wishes!
Disclaimer -
- The opinions expressed here are my own. This is for my own records as well as what I see on charts.
- If you are referring to this, please keep in mind that it is only for educational and research purposes.
- Past performance is no guarantee of future results.
- You must accept responsibility for any decision you make. DO NOT TAKE THIS AS AN INVESTMENT RECOMMENDATION.
- It's your hard-earned cash. Trade / Invest wisely, keeping in mind your trading style, goals and objectives, time horizon, and risk tolerance.
- Before investing, conduct your own research and consult with a financial advisor.
TIA!

ALB bank : Morning star formation likely Scrip can rebound owing to fine YoY Q1 results after going down below support levels and falling below 200-SMA forming morning star pattern however,confirmation is yet needed
One can aim for resistance level 1 and beyond if it goes around entry range wherein, the close of last candlestick should show above the preceding candlesticks real body
%william upward trend from oversold situation is also bit in jittery so momentum and confirmation is quite necessary..
Rest in chart..
PSB has shown fine results YoY with improvement over previous results which could built trust amongst investors majorly
indiatoday.intoday.in

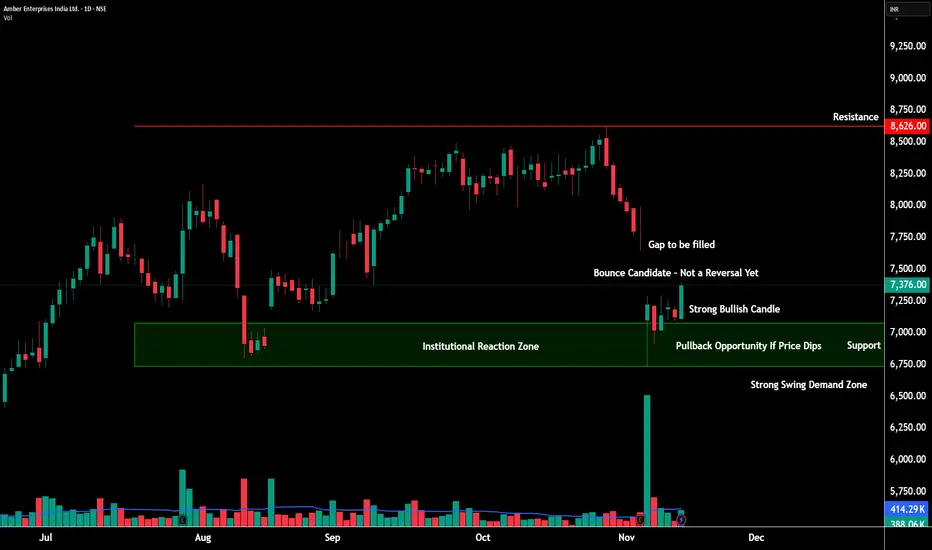
AMBER at a Critical Turning Point – Trend Shift or Just a Bounce💹 Amber Enterprises Ltd (NSE: AMBER)
Sector: Consumer Durables | CMP: 7376 | View: Early Reversal Attempt Inside Downtrend Structure
Chart Pattern: NA
Candlestick Pattern: Bullish Engulfing
📊 Price Action – What’s Really Happening?
Amber finally showed signs of life after a sharp slide from 8600 levels.
Buyers stepped in near 7180–7200, creating a clean intraday reversal base.
But — the larger trend is still down, so this bounce must prove itself above 7480–7536.
🧭 Support & Resistance
Resistances: 7484 | 7536 | 7592 | 7785
Supports: 7183 | 7090 | 6990 | 6882
Demand zones are strong → resistance zones are layered and heavy.
This is why confirmation matters.
📈 STWP Trading Analysis:
Bullish Breakout: 7400 | Stop Loss: 7180
A clean bounce developed from the swing demand zone after strong absorption of selling pressure. Despite this intraday strength, the daily chart remains in a downtrend with lower highs and lower lows. A possible close above 7480–7535 could shift bias to short-term bullish continuation. Below 7180, weakness can reappear quickly.
🧩 Final STWP Outlook
Momentum: Mild |Trend: Bearish | Risk: Moderate | Volume: Improving
⚠️ Disclosure & Disclaimer – Please Read Carefully
This content is strictly for educational and informational purposes.
It is not a buy/sell recommendation and should not be treated as investment advice.
I am not a SEBI-registered investment adviser.
Markets carry risk, and price can move unpredictably.
Always evaluate your risk, position size, and suitability before trading.
Consult a SEBI-registered adviser before making any financial decision.
Position Status: No active STWP position in AMBER at the time of analysis.
Data Source: TradingView & Market Data Snapshot.
💬 Found this breakdown useful?
🔼 Boost this post to help more traders learn structured analysis
✍️ Comment your views or setups — let’s grow together
🔁 Share it with traders who want clean, disciplined analysis
👉 Follow @STWP for more structured trade setups, zone-based insights, and disciplined trading approach.
🚀 Stay Calm. Stay Clean. Trade With Patience.
Trade Smart | Learn Zones | Be Self-Reliant 📊
JUBLFOOD formation of Double BottomDouble bottom chart pattern formed in JUBLFOOD and pattern will active only after break and close above 470.
It is also important to note that JUBLFOOD is bounced back from prior support level with formation of bullish candlestick called Hammer.
Price is also pierced the downtrend line and currently price is consolidating near neckline.
We have also found inside bar pattern near the neckline, if upside breakout is sustained then we can get sharp up move or else pattern will be invalid.

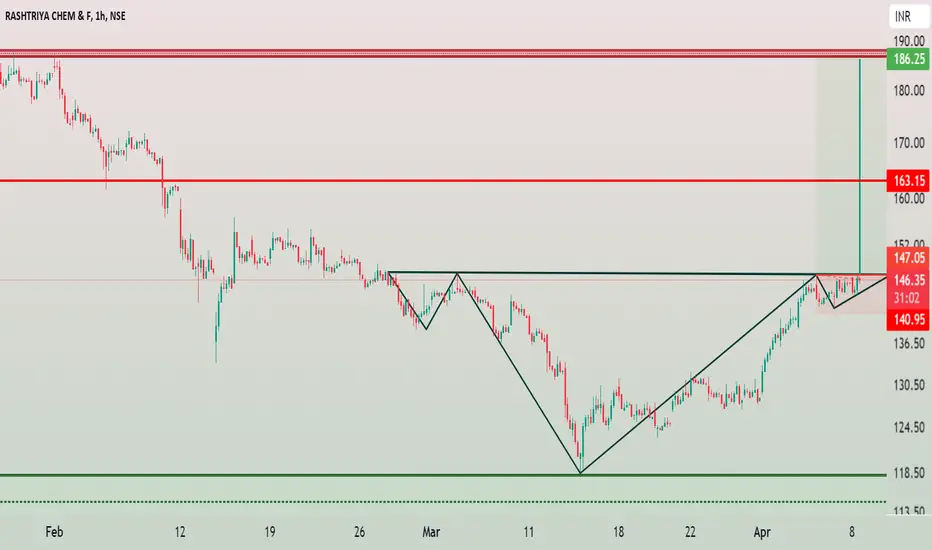
RCF - Head and Shoulder Chart PatternRashtriya Chemicals and Fertilizers Limited (RCF) has formed a bullish chart pattern called Head and Shoulder. Chart structure is bullish in every point of views like in a daily chart pattern you found RSI above 60 and also above 200 EMA is a very positive signal of uptrend.
Head is formed at very important zone which act as a resistance for than a decade almost (14 years). After successfully breakout of important resistance now price retest that level and formed strongest support zone with bullish piercing candlestick in daily timeframe. Change of Polarity, Prior resistance become support.
RCF buy above 148
Stop Loss below 142
Target 163 and 186
Falling wedge pattern breakout in JUBLFOODJUBLEFOOD
Key highlights: 💡⚡
✅On 1Day Time Frame Stock Showing Breakout of Falling wedge Pattern .
✅ Strong Bullsih Candlestick Form on this timeframe.
✅It can give movement up to the Breakout target of 500+.
✅Can Go Long in this stock by placing a stop loss below 420-.

Wipro Analysis for swing tradeNSE:WIPRO After some gain Evening Star candlestick pattern is form . Short Sell the stock. Stop Loss 396 and as the stock is in down trend no fix target . Support at 376 .

ABB ANALYISIS IN 1H TF28/11/2022
LONG SIDE TRADE
SWING(1H)
ABB
Triangle pattern breakout and retested in 4H TF(LOWER TRENDLINE SUPPORT IN DAILY TF)
Closed with hammer candlestick above 50 MA
Risk taker can initiate trade with trading the hammer for that:
ENTRY-3104
SL-3076
TARGET 1-3159
TARGET 2-IF TARGET 1 ACHIEVED CAN FOLLOW THE RISK ADVERSE TRADE
Risk adverser can trade the triangle pattern breakout that is retested in 4H TF for that:
ENTRY-3120
SL-3070
TARGET-FOLLOW THE ABOVE TRENDLINE
R:R-AROUND 1:2

Polycab Ready For Good Return In Short Term!Dark Cloud Cover Is A Candlestick Pattern That Shows A Shift In Momentum To The Downside Following A Price Rise. The Pattern Is Composed Of A Bearish Candle That Opens Above But Then Closes Below The Midpoint Of The Prior Bullish Candle.
Buy Polycab Above ~ 2245 With Stop ~ 2150, Target ~ 2550, 2650, Short Term Trade.
