Search in ideas for "COMMODITY"


Cummins India short term viewRefer chart for target and stoploss. Indicators are showing bullish signal.RSI,STOC,MACD,CCI are in bullish mode, and ADX showing bearish reversal. This all helps to move up further.
Vijayaraghavan,
Kovilpatti.

RBL bank short term viewRefer chart for stoploss and target. Head and shoulder fomation going on in 1hr chart. Target given based on trend lines and head and shoulder formation. Both targets are same. Indicators also may turn to sell.
Vijayaraghavan,
Kovilpatti.

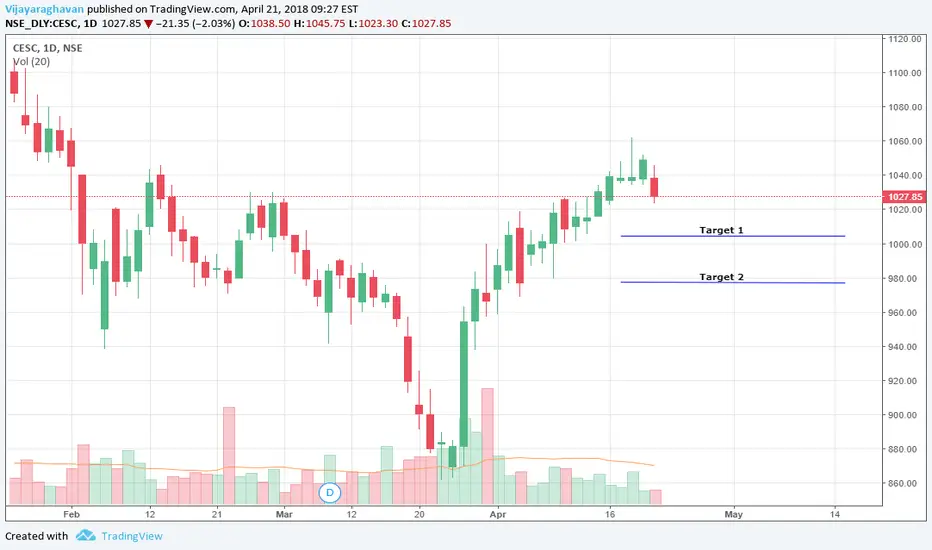
CESC Short term viewIndicators are showing some bearish signal. No patterns formed. View given fully based on indicators. Refer chart for target and stoploss
Vijayaraghavan,
Kovilpatti

intraday sell sell bpcl future around 736 sl 745 target 731,726...........
lot size 1200.....
intraday and positional

buy near support level Buy at / above : 9432 Targets: 9451.57 ,, 9475.88 ,,9500.23 ,, 9524.60
Stploss : 9407.73
We are not Registered with SEBI, Under RA Regulations. All Calls/Views posted here are for an Educational Purpose Only. Do your Own Analysis

buy zone buy around 86.3 sl 84 target1 87.75 target 89.45 target3 91.90
We are not Registered with SEBI, Under RA Regulations. All Calls/Views posted here are for an Educational Purpose Only. Do your Own Analysis

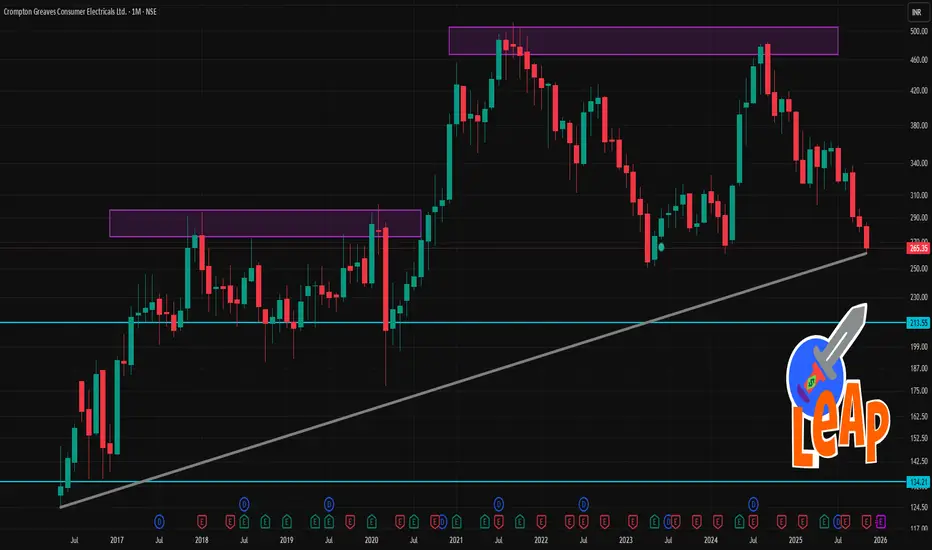
Crompton 1 Month Time Frame 📉 Recent context & background
The stock recently hit a fresh 52-week low — around ₹267.5–₹271.25.
Latest quarter (Q2 Sep-2025) saw a sharp profit drop: net profit fell ~43% YoY, with EBITDA margin under pressure due to commodity cost inflation and restructuring costs.
On the flip side, the company’s broader business mix (like pumps / small domestic appliances / solar-rooftop orders) and some analyst estimates still see potential for recovery.
🧭 What could move the price in next 1 month
Positive triggers: Any signs of margin recovery, easing of commodity inflation, good order wins (e.g. solar-segment orders or domestic appliance demand), supportive news or institutional interest.
Negative triggers: Continuation of margin pressure, weak demand in core categories, negative macro / interest-rate or inflation environment, or broader investor risk-off sentiment.
🎯 My Base-Case 1-Month Scenarios
Bearish to neutral scenario: Price may hover or drift around ₹260–₹285, possibly bouncing between support (₹265–₹270) and resistance (₹280–₹290).
Bullish/recovery scenario: If sentiment improves, stock could aim for ₹300–₹330 over the next 3–4 weeks — especially if company provides encouraging updates or sector environment improves.
Upside breakout scenario (less likely in short 1-month): A push toward ₹340 is possible only if there’s a strong catalyst (e.g., margin rebound, big orders, broadly bullish market) — but that feels optimistic for just 1 month.
MCX - Bullish W-Pattern (Double Bottom Breakout)________________________________________
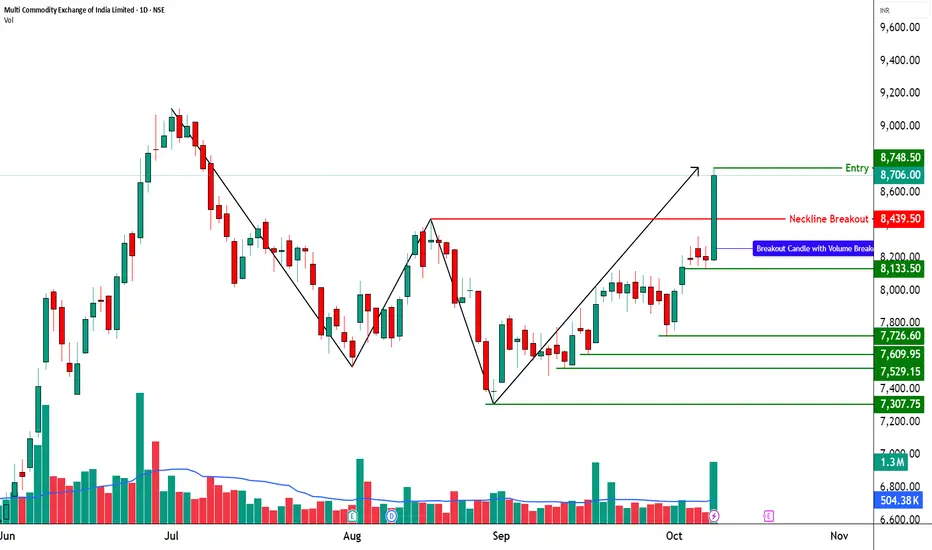
🚀 Multi Commodity Exchange of India Ltd (NSE: MCX) | Bullish W-Pattern (Double Bottom Breakout)
📊 Current Market Snapshot
CMP: ₹8,706.00
Sector: Financial Services / Commodity Exchange
Pattern Observed: 🟢 W-Pattern (Double Bottom Breakout)
Candlestick Signal: Strong Bullish Marubozu + Volume Breakout
Strength Rating: ⭐⭐⭐⭐☆ (High-Conviction Bullish Reversal)
________________________________________
🧭 Technical Indicators
The technical indicators on this chart are flashing strong bullish signals. Momentum is clearly positive, supported by a Bullish Marubozu candle, which reflects strong buying pressure and conviction. The chart also indicates a possible breakout formation, confirmed by a strong bullish candle backed by extremely high volume — a classic sign of institutional participation.
Multiple bullish confirmations like swing trade alignment, intraday signal, RSI breakout, and bullish engulfing pattern further add weight to the uptrend. The Bollinger Band breakout and Bullish VWAP suggest sustained price expansion, while the BB Squeeze-Off hints at volatility returning in favor of the bulls. Altogether, these indicators reinforce a buy-on-dip structure with potential for continuation toward higher resistance zones.
MCX is currently trading in the Progressive Zone, indicating a phase of steady upward momentum where buyers are actively accumulating positions. This zone reflects controlled bullish strength and sustained participation, suggesting that the stock is gearing up for a potential breakout continuation.
The KST (Know Sure Thing) indicator for MCX is in bullish territory, confirming the upward momentum seen in price action. With a strong positive crossover and supportive strength reading, the KST reinforces the ongoing uptrend — indicating that momentum remains firmly in favor of the bulls and the stock could continue its northward journey.
MCX is trading between its Swing High at ₹8,439.5 and Swing Low at ₹7,304. The Top Range near ₹9,115 acts as a major resistance zone, while the Bottom Range around ₹7,304 provides strong support, defining a clear bullish structure with room for further upside if momentum sustains.
________________________________________
📊 Trade Setup (Strong Momentum Entry)
Entry: ₹8,748.50
________________________________________
💡 Learning Note
This setup is a textbook example of a W-pattern (Double Bottom) breakout, where price reverses from a downtrend after forming two clear lows at similar levels. The neckline breakout with heavy volume confirms a shift in market sentiment from bearish to bullish. Such patterns highlight how volume expansion and strong breakout candles validate reversal strength and help traders identify early entry points in new uptrends.
________________________________________
⚠️ Disclosure & Disclaimer – Please Read Carefully
The information shared here is meant purely for learning and awareness. It is not a buy or sell recommendation and should not be taken as investment advice. I am not a SEBI-registered investment adviser, and all views expressed are based on personal study, chart patterns, and publicly available market data.
Position Status: No active position in MCX at the time of analysis.
Data Source: Past Chart reference(Historical levels)
Trading—whether in stocks or options—carries risk. Markets can move unexpectedly, and losses can sometimes exceed the money you have invested. Past performance or setups do not guarantee future results.
If you are a beginner, treat this as a learning guide and practice with paper trades before risking real money. If you are experienced, always assess your own risk, position sizing, and strategy suitability before entering trades.
Consult a SEBI-registered financial adviser before making any real trading decision. By engaging with this content, you acknowledge full responsibility for your trades and investments.
________________________________________
💬 Found this useful?
🔼 Give this post a Boost to help more traders discover clean, structured learning.
✍️ Drop your thoughts, questions, or setups in the comments — let’s grow together!
🔁 Share with fellow traders and beginners to spread awareness.
👉 “If you liked this breakdown, follow for more clean, structured setups with discipline at the core.”
🚀 Stay Calm. Stay Clean. Trade With Patience.
Trade Smart | Learn Zones | Be Self-Reliant 📊
________________________________________
The Redoubling. BRBR: The New King of U.S. Sports Nutrition?About Redoubling
Redoubling is my own research project, which is designed to answer the following question: How long will it take me to double my capital? Each article will focus on a different company that I've added to my model portfolio. I'll use the close price of the last daily candle on the day the article is published as the trade price. I'll make all my decisions based on fundamental analysis. Furthermore, I'm not going to use leverage in my calculations, but I'll reduce my capital by the amount of commissions (0.1% per trade) and taxes (20% capital gains and 25% dividend). To find out the current price of the company's shares, just click the Play button on the chart. But please use this stuff only for educational purposes. Just so you know, this isn't investment advice.
Below’s a detailed overview of BellRing Brands, Inc. (ticker: BRBR )
1. Main areas of activity
BellRing Brands is a consumer nutrition company focused on the “convenient nutrition” category. It markets protein‑based products (ready‑to‑drink shakes, powders, and nutrition bars) under key brands such as Premier Protein, Dymatize, and PowerBar. BellRing operates as a holding company structure overseeing these brand businesses and focuses on scaling distribution, penetration, and innovation in nutrition.
2. Business model
BellRing generates revenue by selling its nutrition products (shakes, powders, bars) through multiple channels (e.g., club, mass retail, e‑commerce, convenience, specialty) in the U.S. and internationally. Its model is largely B2C (business to consumers) via retail and direct channels, but it also relies on partnerships with retailers, distributors, and co‑manufacturers to handle production, contract manufacturing, logistics, and shelf space. BellRing also invests in marketing, brand building, and household penetration to drive repeat purchases and buy rate growth.
3. Flagship products or services
BellRing’s main brands and product lines are:
Premier Protein : its flagship brand, offering ready-to-drink protein shakes, powder versions, and refreshing protein beverages. It is the largest contributor in their portfolio.
Dymatize : positioned more toward sports nutrition / performance protein powders and related products.
PowerBar : a legacy nutrition bar brand, serving more as an international / cross‑category extension.
4. Key countries for business
While BellRing’s primary market is the United States, the company is working to expand its international presence. Dymatize’s international growth is cited as a positive driver. The PowerBar brand, too, has reach in over 35 international markets, particularly in Europe. That said, BellRing is often characterized as a “pure-play U.S. nutrition company” with ambitions to globalize further. Given that most of its distribution and consumer footprint is U.S.-centric, domestic retail, e‑commerce, and convenience channels are especially critical.
5. Main competitors
BellRing competes in the broader food, beverage, and nutrition space. Key competitive and peer companies include:
Medifast, Inc. (nutrition / diet & wellness products).
Large consumer goods and beverage companies like Coca-Cola, Unilever, Keurig Dr Pepper, Hershey (via beverage / nutrition arms).
Specialty nutrition / supplement companies in protein, health / wellness space.
According to Craft, competitors include Amy’s Kitchen and others in adjacent nutrition / food segments.
In more aggregate industry comparisons, BellRing is grouped with food processing and consumer non‑cyclical peers.
6. External and internal factors contributing to profit growth
External factors
Macro trends toward health, wellness, and functional nutrition: As consumers increasingly seek products with protein, clean labeling, convenience, and functional benefits, BellRing is well positioned to capture demand.
Low penetration in key product segments: The company notes that shakes as a segment still have relatively low household penetration (e.g., 48% in some tracked channels), implying room for growth.
Distribution expansion and new channels (e‑commerce, convenience): Growth across untracked channels, international sales, and digital platforms can expand reach.
Commodity cycles and input cost declines: Favorable raw material or input cost trends (or hedges) may improve margins. In Q4 2024, the company cited net input cost deflation as contributing to higher margins.
Internal factors
Brand strength and household penetration growth: Premier Protein has seen strong gains in penetration, which supports recurring demand.
Supply and manufacturing scale-up: BellRing has built out co‑manufacturing networks and increased shake supply to remove constraints.
Operational efficiency and margin expansion: The company uses cost discipline, procurement, production fees (e.g. attainment fees), and hedging strategies.
Share repurchase programs: The company actively buys back shares to return capital and support per‑share earnings growth.
Product innovation and extensions: New product launches under the nutrition umbrella can drive incremental volume and revenue.
7. External and internal factors contributing to profit decline
External threats
Intense competition and market saturation: The nutrition / functional beverage space is crowded, with many well-capitalized incumbents. Loss of shelf space or promotional pressure could erode margins.
Retailer power and inventory cuts: In Q3 2025, BellRing disclosed that major retailers cut weeks of supply, expected to create a growth headwind.
Input cost inflation and commodity volatility: Rising costs or unfavorable mark-to-market hedging could compress margins.
Regulatory, labeling, or health claims risks: In food, beverage and nutrition sectors, regulatory changes around supplements, health claims, or labeling could impose costs.
Legal / litigation exposure: BellRing disclosed a $90 million class‑wide settlement related to past litigation (Joint Juice).
Internal weaknesses
Overdependence on core brands / product categories: If Premier Protein underperforms, the company’s revenue concentration could pose risk.
Operational execution risks: Scaling manufacturing, supply chain disruptions, quality control failures, or missteps in marketing could hurt growth.
Legal reserves / unexpected provisions: The provision for legal matters in Q3 2025 hit results, dragging operating profit.
8. Stability of management
Executive changes in the past 5 years
Darcy Horn Davenport serves as President & CEO and is on the board. She previously led Post’s Active Nutrition business before BellRing was spun off.
Paul Rode is CFO, with long experience in the nutrition business and prior roles at Post, including serving as CFO of Post’s Active Nutrition.
On July 30, 2025, BellRing announced that Elliot H. Stein, Jr. will resign from the Board effective September 30, 2026. Concurrently, Thomas P. Erickson was appointed lead independent director, Shawn W. Conway became Chair of the Compensation & Governance Committee, and Jennifer Kuperman joined the Executive Committee.
These changes are described as governance/committee reassignments rather than executive turnovers.
Impact on corporate strategy / culture
The management team appears relatively stable at the top, with no major CEO or CFO turnover recently. The board changes seem more about committee roles and succession planning rather than a radical shift. Under Davenport’s leadership, the company has executed aggressive growth, brand penetration, and supply expansion strategies, suggesting continuity and alignment between management and strategy. The board adjustments are intended to facilitate smooth continuity rather than disrupt direction, which may support investor confidence.
Why did I add this company to my model portfolio?
I took a look at the company's basics, and it seems like earnings per share aren't growing right now, but total revenue is growing steadily over time. This, combined with a low debt-to-revenue ratio and steady operating, investing, and financing cash flows, gives the balance sheet a good foundation. Some other things to note are that return on equity and gross margin are growing steadily, the current ratio is strong, and interest coverage is excellent. All of these things show that liquidity and solvency are solid. With a P/E of 20.36, I think the valuation is interesting given these fundamentals and consistent with a balanced growth profile.
I didn't find any major news that could threaten the company's stability or lead to insolvency. Considering a diversification coefficient of 20 and an observed deviation of the current stock price from its annual average by more than 16 EPS, I decided to allocate 15% of my capital to this company at the close price of the last daily bar.
Portfolio overview
Below are screenshots from TradingView's Portfolios tool. I used $100,000 as my initial capital for the model portfolio. I will update these screenshots as I add new trades.

Zuari Price ActionAs of July 24, 2025, Zuari Agro Chemicals Ltd is trading around ₹215 to ₹218 per share. The stock has shown a recent slight decline of about 1.27% on that day. Its market capitalization is approximately ₹900 crore, placing it among the mid-sized chemical and fertilizer companies.
The 52-week price range for Zuari Agro Chemicals is between ₹169 and ₹268, reflecting moderate volatility over the past year. The stock is trading closer to the lower-middle part of this range, about 18–20% below its 52-week high.
Fundamentally, the company demonstrates reasonable valuation metrics, with a price-to-earnings (P/E) ratio near 5.5, which is quite attractive compared to the sector average, and a price-to-book (P/B) ratio below 0.5, indicating it is trading at a significant discount to book value. Recent earnings per share show solid growth, contributing to strong profitability metrics.
Operationally, Zuari Agro Chemicals continues to build stable revenues within the fertilizers segment, benefitting from sectoral demand and government policies supporting agriculture inputs. The company maintains average financial strength with ongoing measures to reduce debt and improve operational efficiency.
On the technical front, the stock has experienced some consolidation after modest gains over recent months but remains vulnerable to market sentiment shifts in the commodity and fertilizer sectors.
Overall, Zuari Agro Chemicals offers a fair valuation entry for investors seeking exposure to the fertilizer industry with moderate risk. The current price implies value relative to its historical range, supported by steady earnings, though the stock price is subject to volatility driven by agricultural commodity cycles and sector-specific factors.

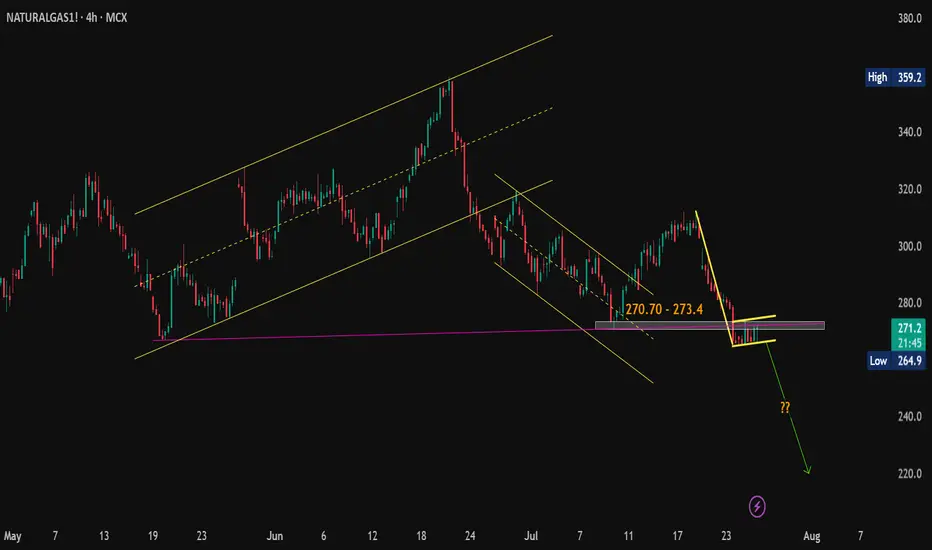
Natural Gas Technical Breakdown Ahead? Eyes on the 264.90 Mark#Commodity
#NaturalGas View:
CMP: 271.70
🔹 Resistance Levels:
• 270.70 – 273.40
• 275.00
• 284.00
🔹 Support Level:
• 264.90
Technical View:
Natural Gas seems to be forming a bearish flag pattern on the hourly & 4 hours chart. The price is currently facing resistance at the pink trendline breakdown level. While it's still early for confirmation, a decisive hourly close below 264.90 may validate the pattern and open the door for further downside. If the pattern plays out, a possible target zone around 220 could be in sight.
📌 Note: This is a technical analysis view shared for educational purposes only and not a recommendation to buy/sell. Always consult your financial advisor before making any trading decisions.
#Commodity | #NaturalGas | #MCX | #PriceAction
Britannia Industries Limited Britannia Industries Limited operates a robust and diversified business model centered on manufacturing, marketing, and distributing branded food products, primarily biscuits, with a growing presence in dairy, bakery, and snacks
1. Core Product Portfolio
Biscuits (80% of revenue): Britannia dominates India’s biscuit market with iconic brands like Good Day, Marie Gold, Tiger, Milk Bikis, NutriChoice, 50-50, Jim Jam, Treat, Little Hearts, and Pure Magic. It caters to diverse consumer segments (premium, mass, kids, health-conscious) with a focus on innovation (e.g., Jim Jam Pops, Pure Magic Choco Frames).
Dairy (10–12% of revenue): Includes cheese, Winkin’ Cow milkshakes, Come Alive paneer, dahi, and butter, leveraging partnerships like the joint venture with Bel SA (France) for cheese.
Bakery and Snacks: Offers breads (gourmet, white), cakes (Muffills, Gobbles), rusks (Toastea), and snacks (Time Pass). The croissant business operates through a joint venture with Chipita.
International Exports: Britannia exports to over 80 countries, with a strong presence in the Middle East, Africa, and North America, contributing to its global revenue stream.
2. Revenue Streams
Domestic Market: Britannia serves over 50% of Indian households through a network of 5 million retail outlets, including modern trade (supermarkets, e-commerce) and traditional kirana stores. Its wide product range ensures mass-market penetration and premium offerings.
International Market: Exports biscuits and dairy products, with strategic investments like the acquisition of a controlling stake in Kenya’s Kenafric Biscuits (2022) to strengthen its African footprint.
B2B and Institutional Sales: Supplies to hotels, restaurants, and catering (HoReCa) sectors, though this is a smaller segment.
Private Labels and Contract Manufacturing: Britannia occasionally engages in contract manufacturing for select partners, though this is not a primary focus.
3. Manufacturing and Supply Chain
Production Facilities: Operates 14 owned factories and 54 contract manufacturing units across India (e.g., Jhagadia, Gujarat; Taratala, Kolkata; Ranjangaon, Maharashtra) and international facilities in the UAE and Kenya. This ensures scalability and cost efficiency.
Sourcing: Procures raw materials (wheat, sugar, milk, palm oil) locally and globally, with a focus on cost optimization. The company mitigates commodity price volatility through strategic sourcing and hedging.
Distribution: Leverages a robust supply chain with over 4,000 stock-keeping units (SKUs), 27,000 distributors, and direct reach to 2.9 million outlets. Its rural penetration program, covering 40,000+ villages, enhances market reach.
4. Marketing and Branding
Brand Equity: Britannia’s “Eat Healthy, Think Better” philosophy and campaigns like “Nature Shapes Britannia” reinforce its image as a trusted, innovative, and sustainable brand. Limited-edition products (e.g., Avani Lekhara-inspired Marie Gold, Harry Potter-themed Pure Magic) create buzz.
Digital and Social Media: Engages consumers through targeted campaigns on platforms like X, Instagram, and YouTube, alongside celebrity endorsements and influencer partnerships.
Innovation: Regularly launches new products and variants (e.g., protein-enriched biscuits, low-sugar options) to cater to evolving consumer preferences for health, convenience, and indulgence.
5. Customer Segments
Mass Market: Affordable brands like Tiger and Milk Bikis target price-sensitive consumers, especially in rural areas.
Premium Segment: Good Day, Pure Magic, and NutriChoice appeal to urban, health-conscious, and premium consumers.
Kids and Youth: Treat, Jim Jam, and Winkin’ Cow target younger demographics with fun, indulgent offerings.
Health-Conscious: NutriChoice and Come Alive cater to fitness-focused consumers with low-sugar, high-fiber, and protein-enriched products.
6. Cost Structure and Profitability
Cost Drivers: Raw materials (50–60% of costs), packaging, labor, and logistics. Inflation in wheat, sugar, and palm oil prices impacts margins, countered by price hikes and operational efficiencies.
Margin Strategy: Maintains a 15–16% EBITDA margin (Q3 FY25: 15.5%) through cost optimization, premiumization, and economies of scale. For Q3 FY25, net profit rose 4.5% to ₹582 crore on ₹4,592.6 crore revenue.
R&D Investment: Focuses on product innovation and sustainability (e.g., reducing plastic by 66.07 tonnes via the Plastic Tray Removal program).
7. Sustainability and ESG
Integrates sustainability into operations, with initiatives like renewable energy use, water conservation, and reduced plastic packaging. Achieved an ESG rating of 61 by NSE Sustainability (June 2025).
Social initiatives include addressing malnutrition through fortified biscuits and community programs, enhancing brand goodwill.
8. Competitive Advantage
Market Leadership: Holds a 33% share in India’s biscuit market, competing with Parle, ITC, and Mondelez.
Brand Loyalty: Strong consumer trust built over 130 years, reinforced by consistent quality and innovation.
Distribution Network: Extensive reach, including rural markets, gives it an edge over competitors.
Global Presence: Strategic international expansions (e.g., Kenafric acquisition, Bel SA partnership) diversify revenue.
9. Challenges and Risks
Commodity Price Volatility: Fluctuations in raw material costs (e.g., palm oil, wheat) impact margins.
Competition: Faces pressure from local players (Parle, regional brands) and global giants (Mondelez, Nestlé).
Operational Disruptions: Recent strikes (e.g., Jhagadia plant, Q3 FY25) and unverified closure rumors (Taratala factory) pose risks to operations and reputation.
Health Trends: Shift toward healthier diets challenges traditional biscuit categories, requiring innovation.
10. Growth Strategy
Product Diversification: Expanding into adjacent categories like snacks, croissants, and premium dairy.
Geographic Expansion: Strengthening presence in Africa, Middle East, and Southeast Asia through exports and acquisitions.
Digital Transformation: Investing in e-commerce (10% of sales) and digital marketing to capture younger consumers.
Sustainability Focus: Aligning with ESG goals to appeal to conscious consumers and investors.
Financial Snapshot (Q3 FY25):
Revenue: ₹4,592.6 crore (7.9% YoY growth)
Net Profit: ₹582 crore (4.5% YoY growth)
Market Cap: ₹140,438 crore
Sales Growth (5-year CAGR): 9.12%
Britannia’s business model thrives on its strong brand portfolio, extensive distribution, and adaptability to consumer trends, balancing affordability with premiumization while addressing sustainability and global expansion.

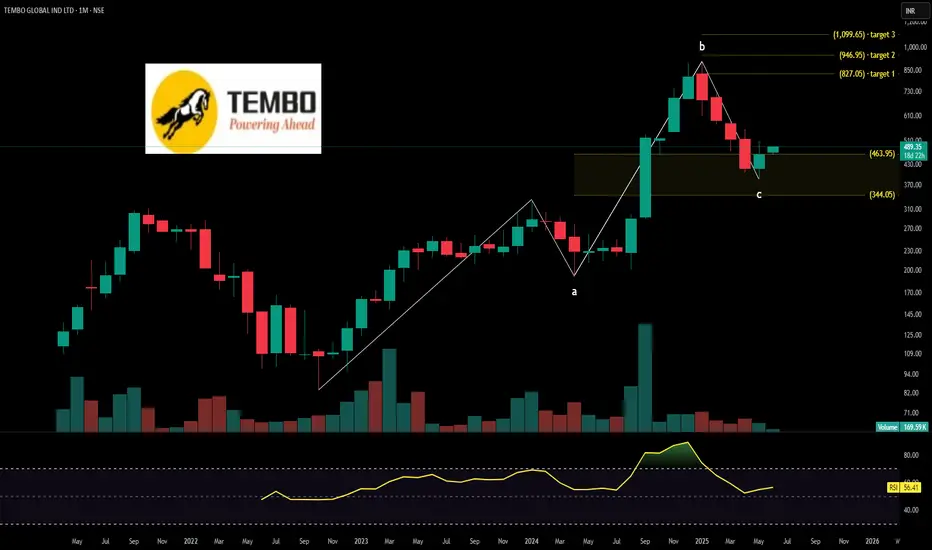
TEMBO GLOBAL technical analysisTembo Global Industries Ltd. (NSE: TEMBO) is currently trading at INR 489.35, reflecting a 6.24% increase. The company specializes in industrial and infrastructure solutions, manufacturing products for HVAC, firefighting systems, and metal fabrication used in construction and engineering projects.
Key Levels
Support Levels: INR 360.25, INR 432.80
Swing Level: INR 489.35
Possible Upside Levels: INR 827.05, INR 946.95, INR 1,099.65
Technical Indicators
RSI: The Relative Strength Index (RSI) is at 56.41, indicating moderate bullish momentum. While the stock is trending positively, it is still below the overbought threshold, leaving room for further gains.
Volume: Trading volume is 169.59K, showing active investor interest. Consistent volume increase near breakout levels would confirm potential upward movement.
Sector and Market Context
Tembo Global Industries operates in the engineering and industrial components sector, which has seen steady demand growth due to infrastructure development, urbanization, and real estate expansion. The sector benefits from government-backed projects, private construction investments, and the shift toward advanced fire protection systems and HVAC solutions. However, global commodity price volatility, raw material costs, and competitive pressures can impact margins and growth rates.
Latest News and Developments
Market Trends: Institutional investors continue to show confidence in industrial infrastructure stocks, as demand for quality engineering solutions remains strong.
Analyst Ratings: Some analysts maintain a bullish outlook, citing expansion plans and steady order book growth.
Quarterly Results: Tembo Global has reported stable earnings, supported by consistent revenue growth in metal fabrication and fire safety product segments.
Dividend Update: Tembo Global Industries Ltd. has declared a dividend payout of ₹4 per share, reinforcing its commitment to shareholder returns.
Analysis Summary
Tembo Global Industries Ltd. presents a bullish technical outlook, with RSI and key levels indicating potential for further price appreciation. Sector fundamentals remain strong, backed by construction growth and demand for advanced engineering solutions, though commodity cost fluctuations and competitive dynamics should be monitored. Investors should track price action near resistance levels, industry-wide trends, and upcoming financial disclosures before making strategic decisions.
DHAMPUR SUGAR MILLS technical analysisDhampur Sugar Mills Ltd. (NSE: DHAMPURSUG) is currently trading at INR 142.82. The company is a leading player in the sugar industry, involved in sugar manufacturing, ethanol production, and cogeneration of power from sugarcane byproducts.
Key Levels
Support Level: INR 97.06
Swing Level: INR 160.92
Possible Upside Levels: INR 289.80, INR 338.70, INR 400.95
Technical Indicators
RSI: The Relative Strength Index (RSI) is currently at 38.39, indicating bearish momentum, with the stock nearing oversold territory, which could signal a reversal if buying interest increases.
Volume: Trading volume is stable, showing consistent investor participation, though a volume spike near key levels would be needed to validate directional movements.
Sector and Market Context
Dhampur Sugar Mills operates in the sugar and ethanol production sector, which has been influenced by government policies on ethanol blending, agricultural yield fluctuations, and global sugar pricing. Recent trends suggest positive growth in ethanol demand, backed by India’s push for ethanol-based fuel diversification. However, commodity price volatility, policy changes, and export restrictions could impact industry margins. The broader market sentiment toward cyclical stocks remains mixed, with investors cautiously tracking demand and regulatory shifts.
Latest News and Developments
Market Trends: Institutional investors are showing interest in ethanol-driven growth stories, positioning sugar stocks favorably.
Analyst Ratings: Some analysts suggest potential upside, citing stable earnings and ethanol sector expansion.
Quarterly Results: Dhampur Sugar Mills reported steady revenue, though raw material costs have impacted margins.
Dividend Update: No recent dividend announcements, indicating reinvestment focus on capacity expansion and modernization.
Analysis Summary
Dhampur Sugar Mills Ltd. has entered a key technical zone, with RSI signaling possible stabilization near current levels. Volume activity remains steady, but confirmation through increased participation will be crucial for trend validation. Sector tailwinds—such as ethanol expansion and sugar consumption growth—support long-term prospects, though macro risks should be monitored. Investors should track regulatory developments, commodity price trends, and upcoming financial disclosures before making strategic decisions.

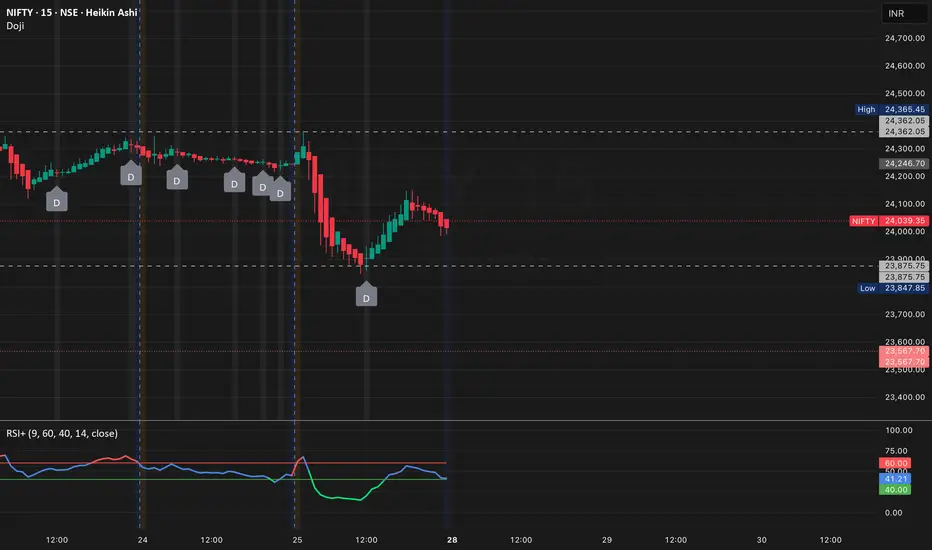
Daily Market Report – Monday, 28 April 2025Daily Market Report – Monday, 28 April 2025
Time stamp: 08:46 am
Opening Outlook
Index Levels:
- NIFTY 50 Previous Close: 24,039.35 (-0.86%)
- GIFT Nifty Indication: 24,261.00 (+0.13%)
- Opening Expectation: Mildly Positive
Domestic Cues:
- Anticipation of upcoming economic data releases and corporate earnings reports is likely to influence market sentiment.
Global Cues:
- Mixed performance in Asian markets amid concerns over global economic growth and commodity price fluctuations.
(हिंदी में):
- शुरुआती संकेत: थोड़ी तेजी
- घरेलू संकेत: आगामी आर्थिक आंकड़ों और कॉर्पोरेट आय रिपोर्टों की प्रत्याशा से बाजार की भावना प्रभावित हो सकती है।
- वैश्विक संकेत: वैश्विक आर्थिक विकास और कमोडिटी मूल्य में उतार-चढ़ाव को लेकर चिंताओं के बीच एशियाई बाजारों में मिश्रित प्रदर्शन।
Commodity, Currency, and Volatility Update
- USD-INR: 85.36
- Brent Crude: $66.78 per barrel
- Gold (24K): ₹9,820 per gram
- India VIX: 17.16
Comment:
- Volatility remains moderate as markets await key economic indicators.
(हिंदी में संक्षेप):
- डॉलर-रुपया दर: 85.36
- कच्चा तेल: $66.78 प्रति बैरल
- सोना (24 कैरेट): ₹9,820 प्रति ग्राम
- इंडिया VIX: 17.16
Sectoral Focus Today
- Positive Sectors: Information Technology, Pharmaceuticals
- Weak Sectors: Banking, FMCG
- Special Themes: Defensive sectors like Pharmaceuticals may attract buying amid market volatility.
(हिंदी में सारांश):
- मजबूत क्षेत्र: सूचना प्रौद्योगिकी, फार्मास्यूटिकल्स
- कमजोर क्षेत्र: बैंकिंग, एफएमसीजी
- प्रमुख विषयवस्तु: बाजार की अस्थिरता के बीच फार्मास्यूटिकल्स जैसे डिफेंसिव सेक्टरों में खरीदारी की संभावना।
Broader Market Commentary (Smallcaps/Midcaps)
- Breadth: Moderate Negative
- Key Observations:
- Smallcap indices are under mild pressure despite Nifty stability.
- Select midcap stocks show relative resilience.
(हिंदी में):
- बाजार प्रसार: मध्यम नकारात्मक
- महत्वपूर्ण टिप्पणियाँ:
- निफ्टी की स्थिरता के बावजूद स्मॉलकैप सूचकांक हल्के दबाव में रहे।
- कुछ मिडकैप स्टॉक्स ने सापेक्ष मजबूती दिखाई।
Key Events / Data Points Today
- Awaiting domestic economic indicators and corporate earnings reports.
Institutional Activity (FII/DII Flows)
- FII Net Activity (April 25, 2025): ₹2,952.33 Cr
- DII Net Activity (April 25, 2025): ₹3,539.85 Cr
Comment:
- Both FIIs and DIIs were net buyers in the cash segment, indicating a positive institutional sentiment.
(हिंदी में):
- एफआईआई शुद्ध प्रवाह (25 अप्रैल 2025): ₹2,952.33 करोड़
- डीआईआई शुद्ध प्रवाह (25 अप्रैल 2025): ₹3,539.85 करोड़
- प्रवाह विश्लेषण: एफआईआई और डीआईआई दोनों ने कैश सेगमेंट में शुद्ध खरीदार के रूप में भाग लिया।
Technical Levels to Watch
- NIFTY 50:
- Support: 24,000
- Resistance: 24,300
- BANK NIFTY:
- Support: 54,500
- Resistance: 55,000
(हिंदी में मुख्य स्तर):
- निफ्टी समर्थन/प्रतिरोध: 24,000 / 24,300
- बैंक निफ्टी समर्थन/प्रतिरोध: 54,500 / 55,000
Closing Summary (Sentiment Tracker)
- Overall Market Mood: Cautious
- Bias for Next Session: Buy on dips
(हिंदी में निष्कर्ष):
- समग्र भावना: सावधान
- अगली सत्र की रणनीति: गिरावट पर खरीदारी
➔ Despite mild positive indications, broader markets remain cautious. Defensive sectors may outperform. Maintain selective exposure with strict risk management.
Mid-Cap Nifty Weekly Technical Analysis for 7 - 11 Apr., 25!🚀 Unlock the potential of Mid-Cap Nifty Weekly Technical Analysis for 7 - 11 Apr., 25!
✨ Boost, follow, and engage for updates. Your support means a lot! 🚀❤️
✅ Weekly Range Trigger Point: 11182 | ✅ Expected Move: 571 pts
📈 Buy Above: 11483 | 🎯 Target1: 11534 | 🎯 Target2: 11752
✅ Average Buy Position: 11416 | ⛔ Stoploss: 11293
📉 Sell Below: 11348 | 🎯 Target1: 10829 | 🎯 Target2: 10611
⛔ Stoploss: 11539
✨ My strategies are backed by 6+ years of research and proven success in trading indices, commodities, and more. I am an independent Index and Commodity Trader, usually trading in MCX, and provide consultation for equity, commodity, and indices. Connect to know more for Intraday Levels and Live Market Confirmations. 📈
#MidcapNifty #Nifty50 #IntradayTrading #TechnicalAnalysis #TradingTips #TradingSignals #NumroTrader #IndexTrading #ChartPatterns #DayTrading #MarketAnalysis #PriceAction #Trading

Fin Nifty Weekly Technical Analysis for 7 - 11 Apr., 25!🚀 Unlock the potential of Fin Nifty Weekly Technical Analysis for 7 - 11 Apr., 25!
✨ Boost, follow, and engage for updates. Your support means a lot! 🚀❤️
✅ Weekly Range Trigger Point: 24774 | ✅ Expected Move: 683 pts
📈 Buy Above: 24938 | 🎯 Target1: 25196 | 🎯 Target2: 25457
✅ Average Buy Position: 24858 | ⛔ Stoploss: 24711
📉 Sell Below: 24777 | 🎯 Target1: 24352 | 🎯 Target2: 24092
⛔ Stoploss: 25005
✨ My strategies are backed by 6+ years of research and proven success in trading indices, commodities, and more. I am an independent Index and Commodity Trader, usually trading in MCX, and provide consultation for equity, commodity, and indices. Connect to know more for Intraday Levels and Live Market Confirmations. 📈
#FinNifty #NiftyBank #Nifty50 #IntradayTrading #TechnicalAnalysis #TradingTips #TradingSignals #NumroTrader #IndexTrading #ChartPatterns #DayTrading #MarketAnalysis #PriceAction #Trading

SANDUMAStock Overview: Sandur Manganese & Iron Ores Ltd (SANM), NSE, Current Price: ₹448.35. The company is engaged in the mining and sale of manganese and iron ores, supplying key raw materials for the metal industry.
Key Levels:
Support (yellow zone): ₹323.10
Swing Zone (green zone): ₹389.75 - ₹450.90
Target Levels (T):
Target 1: ₹582.25
Target 2: ₹648.90
Target 3: ₹733.75
Final Target: ₹978.80
Technical Indicators:
RSI (Relative Strength Index): At 51.01, the RSI indicates neutral momentum—neither overbought nor oversold.
Volume: Trading volume is 335.11K, reflecting moderate market participation.
MA (Moving Average): The 200-period SMA stands at ₹435.57, aligning with a long-term uptrend.
Sector and Market Context: Operating within the mining sector, Sandur Manganese & Iron Ores Ltd's performance correlates with commodity prices and industrial demand. The sector is moderately gaining traction amidst a recovering global economic environment. Additionally, there's optimism regarding metal demand due to infrastructure and renewable energy projects.
Risk Considerations:
Potential volatility in commodity prices due to global economic uncertainties.
Regulatory policies and tariffs impacting mining operations.
Geopolitical events or changes in market conditions could affect demand for manganese and iron ores.
Analysis Summary: Sandur Manganese & Iron Ores Ltd exhibits neutral momentum with defined support and swing zones. Its upward targets suggest potential for price movement, contingent upon sector trends and market stability. While there are growth opportunities, risks from economic fluctuations and external factors should be cautiously monitored.

Gold silver update next Our Spot #Gold Range Prediction from 31/03/2025 to 04/04/2025 is as under.
Gold Spot : 3023$-3126$
Gold INR : 88100-91050
Our Spot #Silver Range prediction from 31/03/2025 to 04/04/2025 is as under.
Silver Spot: 33.44$-35.05$
Silver INR: 98400-103200
It must be remembered that price of precious metal depends on so many world wide factors like inflation, Fed interest rate, trade barrier, geopolitical tension, demand, supply, bond yield, dollar index , GDP, payroll data, CPI, currency fluctuation, debt ceiling , expected tax & duty changes, other commodity price crude oil etc. etc. and hence there can not be any accurate barometer of predicting precious metal price.
Gold INR has been calculated taking Gold Spot international price and converting the same assuming fixed Indian rupee rate. However, this is not accurate method as change in rupee value to dollar can substantially impact Gold INR price. Pl. note that price of commodity doesn't depend upon performence of company but depend upon performence of world economy, hence it is extremely risky to trade in commodities. Commodities market also become more volatile during contract expiry.
These are not a recommendation for buy or sell. This view is only for educational purpose. You are requested to consult your financial advisor before entering in to any trade.

Gold silver update Our Spot #Gold Range Prediction from 31/03/2025 to 04/04/2025 is as under.
Gold Spot : 3023$-3126$
Gold INR : 88100-91050
Our Spot #Silver Range prediction from 31/03/2025 to 04/04/2025 is as under.
Silver Spot: 33.44$-35.05$
Silver INR: 98400-103200
It must be remembered that price of precious metal depends on so many world wide factors like inflation, Fed interest rate, trade barrier, geopolitical tension, demand, supply, bond yield, dollar index , GDP, payroll data, CPI, currency fluctuation, debt ceiling , expected tax & duty changes, other commodity price crude oil etc. etc. and hence there can not be any accurate barometer of predicting precious metal price.
Gold INR has been calculated taking Gold Spot international price and converting the same assuming fixed Indian rupee rate. However, this is not accurate method as change in rupee value to dollar can substantially impact Gold INR price. Pl. note that price of commodity doesn't depend upon performence of company but depend upon performence of world economy, hence it is extremely risky to trade in commodities. Commodities market also become more volatile during contract expiry.
These are not a recommendation for buy or sell. This view is only for educational purpose. You are requested to consult your financial advisor before entering in to any trade.
