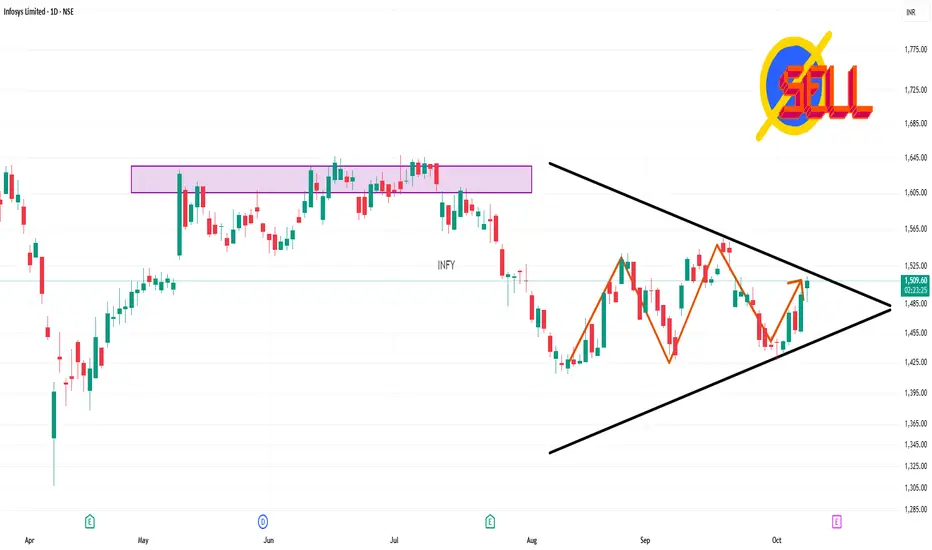
INFY 1 Day Time Frame 📈 Technical Overview (1-Day Timeframe)
Support & Resistance Levels
Immediate Support: ₹1,487.00
Immediate Resistance: ₹1,509.40
Pivot Point: ₹1,498.20
These levels are based on the current day's trading range and can serve as intraday reference points.
Moving Averages
5-Day: ₹1,453.10 (Buy)
10-Day: ₹1,463.10 (Sell)
20-Day: ₹1,491.33 (Sell)
50-Day: ₹1,480.74 (Sell)
100-Day: ₹1,534.03 (Sell)
200-Day: ₹1,614.71 (Sell)
The short-term moving averages indicate a bullish trend, while the longer-term averages suggest a bearish outlook.
Technical Indicators
Relative Strength Index (RSI): 43.75 — Neutral
Stochastic RSI: 25.04 — Neutral
MACD: -11.87 — Bearish
Rate of Change (ROC): -3.66 — Bearish
Commodity Channel Index (CCI): -63.85 — Neutral
These indicators suggest a neutral to slightly bearish momentum.
🔍 Market Sentiment
Infosys has become one of the most actively traded stocks today, particularly in call options, with significant volumes in various strike prices. The stock reached an intraday high, outperforming its sector. However, investor participation has declined, as evidenced by a notable drop in delivery volume.
⚠️ Summary
Infosys Ltd is currently experiencing a neutral to slightly bearish phase on the daily chart. While short-term support holds, the stock faces resistance near ₹1,509.40. Technical indicators like the MACD and ROC suggest downward momentum, and moving averages are predominantly signaling a sell. Traders should monitor the ₹1,509.40 resistance level closely; a breakout above this could shift the bias to bullish.
Search in ideas for "COMMODITY"
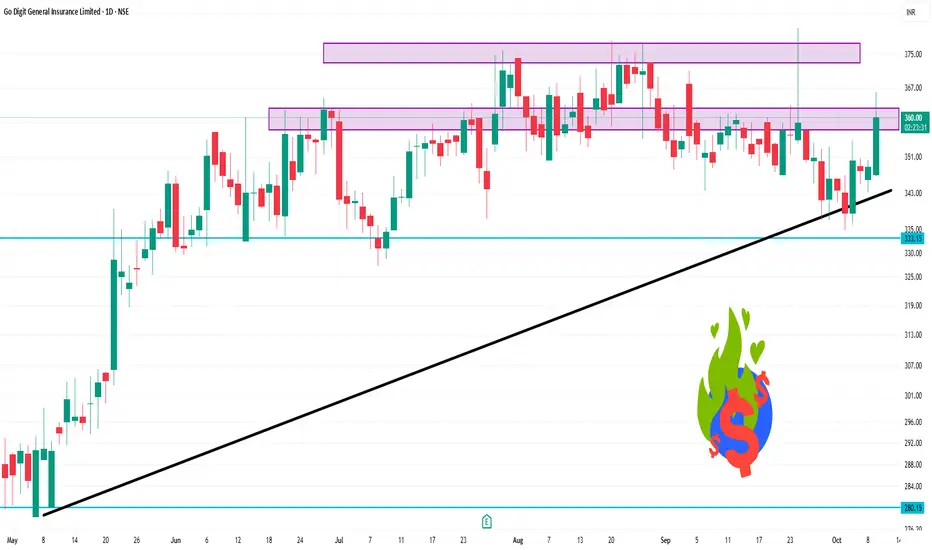
GODIGIT 1 Day Time Frame📊 Intraday Price Movement
Day’s Range: ₹346.65 – ₹350.15
Opening Price: ₹347.10
Closing Price (Previous Day): ₹348.80
Volume Traded: Approximately 55,201 shares
📈 Technical Indicators (1-Day Time Frame)
Relative Strength Index (RSI): 35.92 — indicates a neutral stance
Moving Averages:
5-Day EMA: ₹343.23 (Sell)
10-Day EMA: ₹346.88 (Sell)
20-Day EMA: ₹350.54 (Sell)
50-Day EMA: ₹351.97 (Sell)
100-Day EMA: ₹345.69 (Sell)
200-Day EMA: ₹334.59 (Buy)
MACD: -3.83 — suggests a potential buying opportunity
Commodity Channel Index (CCI): -206.91 — indicates a buying signal
Ultimate Oscillator: 28.51 — suggests a sell signal
Price Rate of Change (ROC): -5.88 — indicates a downward trend
🔍 Summary
The stock is exhibiting a neutral to slightly bearish trend in the short term, with several moving averages signaling a sell. However, indicators like MACD and CCI suggest potential buying opportunities. Investors should monitor for a sustained break above ₹350.00 for a more bullish outlook.
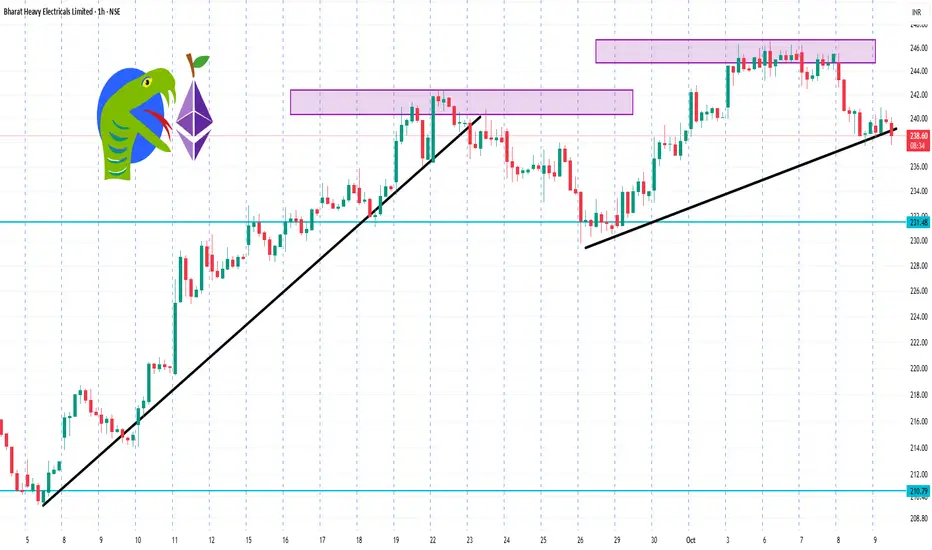
BHEL 1 Hour Time Frame 📉 1-Hour Technical Analysis Summary
Overall Signal: Strong Sell
Relative Strength Index (RSI): 41.43 — approaching oversold territory
MACD: -0.58 — indicating downward momentum
Stochastic Oscillator: 21.78 — confirming bearish bias
Average Directional Index (ADX): 54.36 — suggesting a strong trend
Williams %R: -76.66 — indicating oversold conditions
Commodity Channel Index (CCI): -68.24 — supporting bearish outlook
Pivot Levels:
Support: S1 = ₹238.45
Resistance: R1 = ₹240.85
These indicators collectively suggest a continuation of the current downtrend.
🔍 Key Price Levels
Intraday Support: ₹236.19
Intraday Resistance: ₹243.64
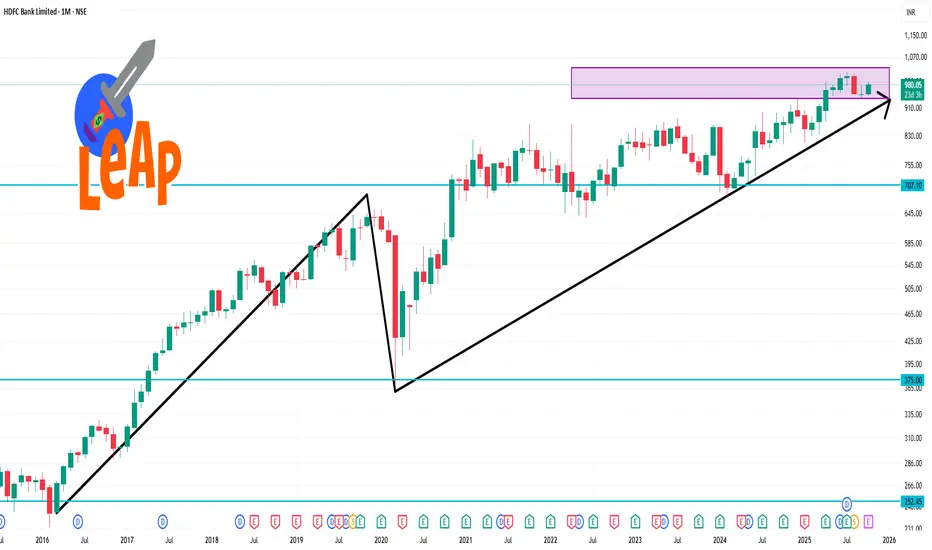
HDFCBANK 1 Month Time Frame 📊 1-Month Technical Outlook
Technical Rating: Strong Buy
Pivot Points:
Classic: Pivot: ₹960.28 | Support: ₹937.03, ₹951.12 | Resistance: ₹974.37, ₹983.53, ₹997.62
Fibonacci: Pivot: ₹960.28 | Support: ₹945.91, ₹951.40 | Resistance: ₹974.65, ₹983.53
Camarilla: Pivot: ₹961.30 | Support: ₹961.09, ₹963.80 | Resistance: ₹967.85, ₹969.21
Moving Averages:
Short-Term (MA5, MA10, MA20): Buy
Medium-Term (MA50): Sell
Long-Term (MA100, MA200): Buy
Relative Strength Index (RSI): 50.54 (Neutral)
MACD: -4.82 (Sell)
Average True Range (ATR): 13.27 (Moderate Volatility)
ADX (Trend Strength): 19.12 (Weak Trend)
Williams %R: -36.70 (Buy)
Commodity Channel Index (CCI): -13.66 (Neutral)
Rate of Change (ROC): -0.22 (Sell)
🔍 Summary
HDFC Bank's stock shows a bullish trend over the past month, with positive technical indicators and a strong buy signal. However, the neutral RSI and sell signal from the MACD suggest caution. Investors should monitor these indicators closely for potential shifts in market sentiment.
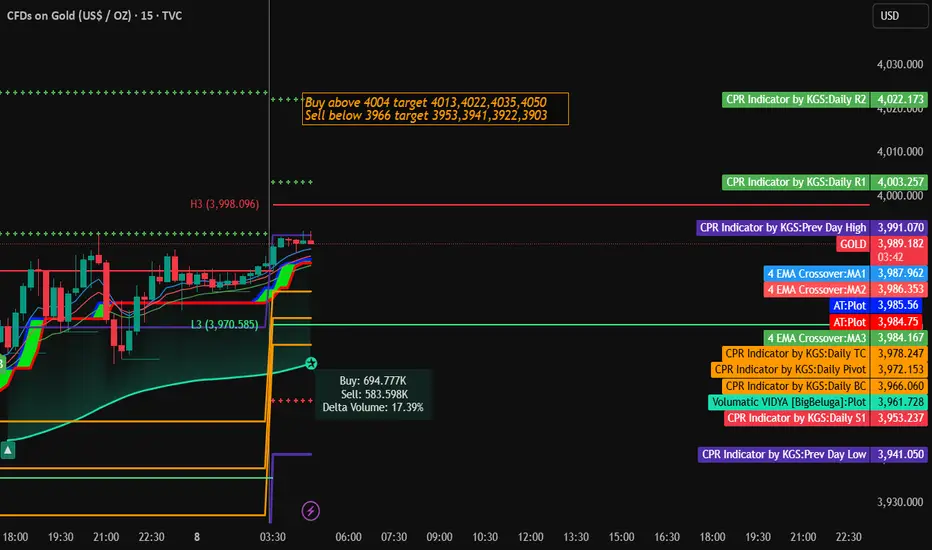
Gold Trading Strategy for 08th October 2025🟡 GOLD (XAUUSD) – INTRADAY TRADE SETUP 💰
📊 Strategy: Trade based on 5-Min Candle Breakout
🟢 BUY Setup
💵 Buy Above: High of 5-min candle closing above $4004
🎯 Targets:
1️⃣ $4013
2️⃣ $4022
3️⃣ $4035
4️⃣ $4050
🛡️ Stop Loss:
Place below the low of the previous 3 candles from the entry point.
🔴 SELL Setup
💵 Sell Below: Low of 5-min candle closing below $3966
🎯 Targets:
1️⃣ $3953
2️⃣ $3941
3️⃣ $3922
4️⃣ $3903
🛡️ Stop Loss:
Place above the high of the previous 3 candles from the entry point.
⚖️ Disclaimer:
📢 This setup is for educational and informational purposes only. It is not financial advice. Trading in Gold, Forex, or any commodity involves high risk. Please use proper risk management and consult your financial advisor before trading.
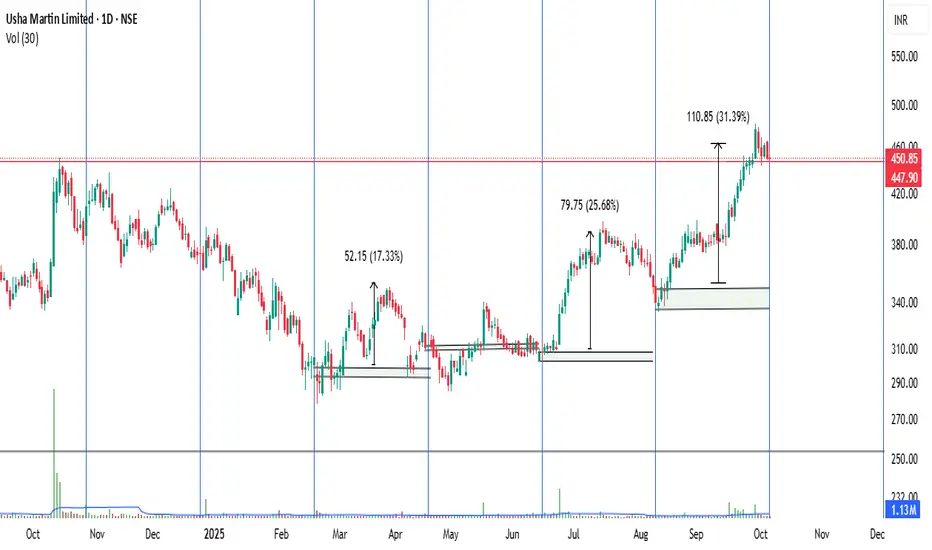
Usha Martin Ltd (USHAMART)Usha Martin Ltd (NSE: USHAMART) is an established Indian company primarily engaged in manufacturing steel wires, strands, wire ropes, cords, and related accessories, with additional involvement in optical fiber cables and other telecom products. Founded in 1960 and headquartered in Kolkata, it serves key sectors like infrastructure, automotive, mining, elevators, and offshore oil & gas. As of October 2025, the stock trades around ₹450–₹462, with a market cap of approximately ₹13,800–14,000 crore. While stock investing involves risks and isn't a recommendation, here are substantiated reasons why analysts and investors might view it as a compelling buy, based on recent financials, market trends, and technical signals.
Strong Financials: ₹403 Cr profit in FY25, 23% EPS growth, low debt (0.05 D/E), 14.8% ROE.
Technical Breakout: Bullish patterns, support at ₹425–₹440, targets ₹500–₹590.
Growth Drivers: Infrastructure, auto, EV, and telecom demand; export growth.
Risks: Commodity volatility, modest sales growth (10% 5Y).
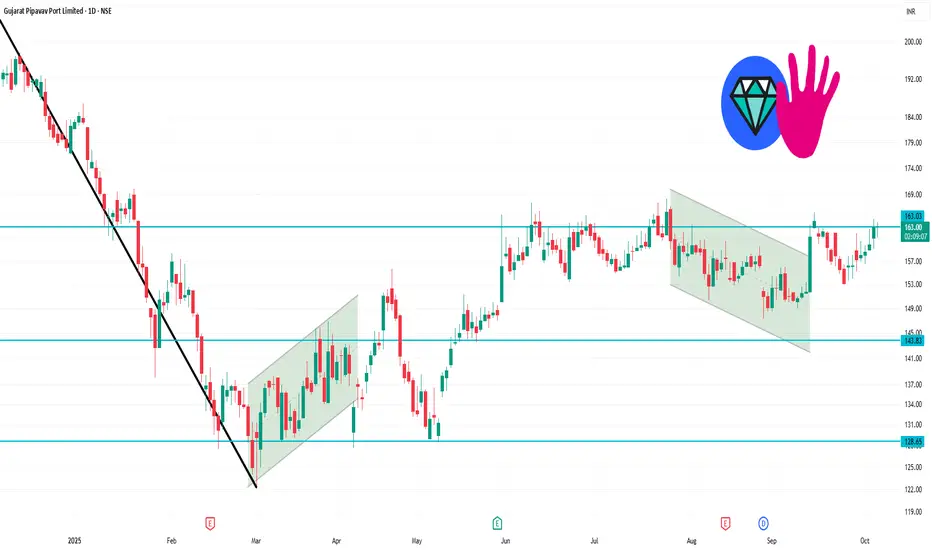
GPPL 1 Day Time Frame 📊 Support & Resistance Levels
Classic Pivot Points:
Support (S1): ₹156.60
Resistance (R1): ₹163.20
Pivot Point (PP): ₹158.45
Fibonacci Levels:
Support: ₹157.19 (50% retracement)
Resistance: ₹160.49 (61.8% retracement)
Camarilla Levels:
Support (S1): ₹161.58
Resistance (R1): ₹164.56
These levels are calculated based on the previous day's high, low, and close prices.
Top Stock Research
📈 Technical Indicators
Relative Strength Index (RSI): 58.6 — Indicates a neutral stance, neither overbought nor oversold.
Moving Average Convergence Divergence (MACD): 1.04 — Suggests a buy signal, indicating potential bullish momentum.
Average Directional Index (ADX): 13.98 — Reflects a weak trend, suggesting indecision in the market.
Commodity Channel Index (CCI): 75.98 — Neutral, showing no strong trend direction.
Rate of Change (ROC): -0.84 — Indicates a slight bearish momentum.
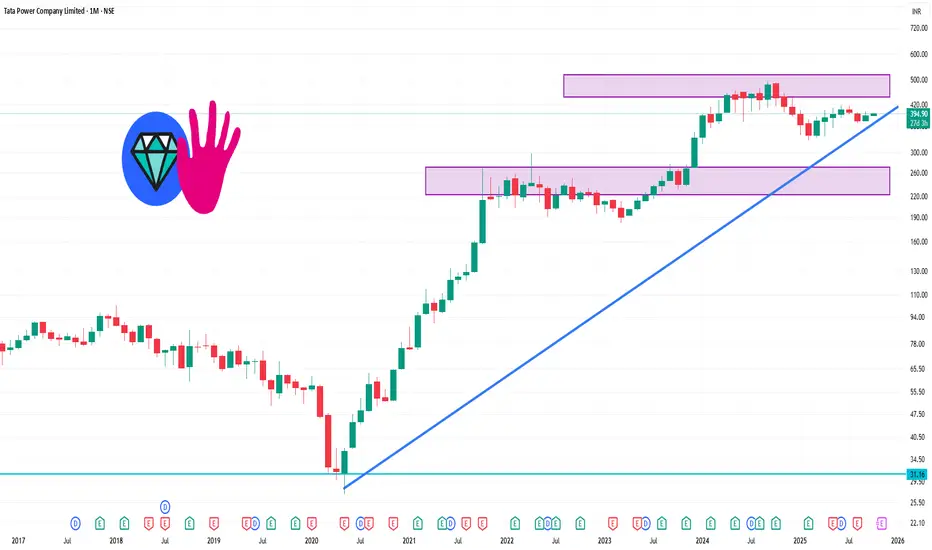
TATAPOWER 1 Month Time frame 📊 1-Month Technical Overview
Over the past month, the stock has shown a modest upward movement of approximately 1.90%
TradingView
.
🔄 Pivot Points (Monthly)
Support Levels: ₹387.57, ₹375.23, ₹361.82
Resistance Levels: ₹413.32, ₹426.73, ₹440.14
The central pivot point stands at ₹400.98
📊 Technical Indicators
Relative Strength Index (RSI): 56.79 (Neutral)
Moving Average Convergence Divergence (MACD): 0.06 (Bullish)
Commodity Channel Index (CCI): -482.5 (Bullish)
Ultimate Oscillator: 80.16 (Bullish)
Simple Moving Averages (SMA): 20-day: ₹394.82, 50-day: ₹394.90, 200-day: ₹393.54 (All Bullish)
Exponential Moving Averages (EMA): 20-day: ₹394.92, 50-day: ₹394.79, 200-day: ₹393.68 (All Bullish)
🧠 Summary
Tata Power's stock is exhibiting a bullish trend over the past month, supported by positive technical indicators and sustained upward momentum. The current price is approaching key resistance levels, suggesting potential for further gains if these levels are breached. However, investors should remain cautious of broader market conditions and sector-specific challenges that could impact performance.
ARKADE📊 Current Price & Key Levels
Last Traded Price (LTP): ₹170.08
Pivot Point: ₹171.40
Support Levels:
S1: ₹166.79
S2: ₹163.51
S3: ₹158.90
Resistance Levels:
R1: ₹174.68
R2: ₹179.29
R3: ₹182.57
📉 Technical Indicators Overview
Relative Strength Index (RSI): 30.98 – Indicates a neutral trend.
MACD: -3.47 – Suggests a bearish momentum.
Stochastic RSI: 8.55 – Indicates oversold conditions.
Commodity Channel Index (CCI): -236.51 – Reflects a strong downtrend.
Money Flow Index (MFI): 37.48 – Indicates a downtrend.
📌 Summary
Trend: The stock is currently in a downtrend.
Key Support: ₹166.79
Key Resistance: ₹174.68
Outlook: Short-term bearish with potential for consolidation.

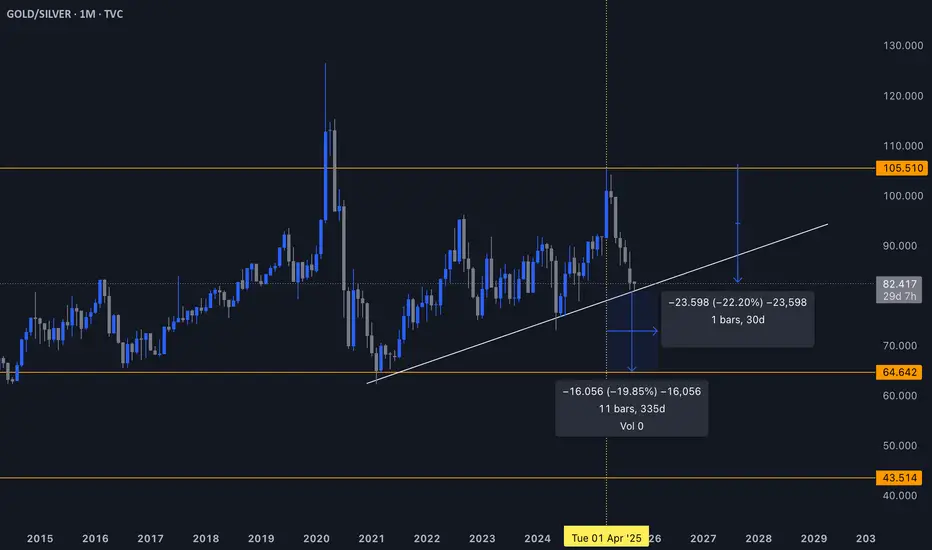
The Gold/Silver Ratio: Why It Matters So Much?The Gold/Silver ratio (GSR) measures how many ounces of silver it takes to buy one ounce of gold. It’s one of the oldest indicators in commodity markets, with data going back centuries.
Long-term average: ~65
Extreme high: 105 in 2020 (COVID panic, gold as pure safe-haven while silver crashed)
Current level: ~80
1. Why the Ratio Is So Powerful
When the GSR is high (above 90–100), it means silver is undervalued relative to gold.
When the GSR falls, it signals that silver is outperforming gold – usually during the most explosive parts of precious metals cycles.
In simple terms:
👉 High ratio = silver cheap
👉 Falling ratio = silver catching up/outperforming
2. The Recent Move
At the 105 peak (2020), silver was ignored and gold was everyone’s safe-haven. That extreme stretched the ratio to historic highs.
Since then, the ratio has broken down to ~80. This collapse in the ratio coincided with silver’s recent 48–50% rally since April 2025.
So there’s already a tight correlation between GSR falling and silver surging.
3. Forward Projection
If we assume the ratio continues mean-reverting towards its historical average (~65):
From 80 → 65 = a ~20% decline in the ratio.
Given how silver has tracked ratio moves so far, that could translate to another ~50% upside.
🖊️ That math gives me:
Current silver ~$50 → my target range $70–73
Which also aligns with the inflation-adjusted 2011 top of Quarterly Silver chart
This alignment across technical (Cup & Handle), ratio math, and inflation-adjusted targets strengthens the conviction.
4. Where This Gets Interesting
The GSR chart you provided shows a trendline break risk:
If the ratio decisively breaks down from ~80, it confirms silver is in outperformance mode.
A breakdown projects to ~65 (mean), and potentially overshoot lower if momentum builds.
Historically, when the GSR enters a sustained downtrend, silver rallies parabolically.
🎈 Key Takeaway:
The Gold/Silver ratio is not just a technical indicator here – it’s the bridge linking your macro thesis (ETF demand, industrial pull, Fed distrust) with your chart targets.
The ratio tells us that:
Silver’s catch-up has already started.
There’s room for another 50% upside.
This lands silver in the $70–73 zone – exactly where the inflation-adjusted 2011 high sits.
NATIONALUM Price ActionNational Aluminium Company Ltd (NATIONALUM) closed today at ₹213.87. The stock rallied strongly, rising nearly 5% during the session and trading in a range between ₹204.20 and ₹215.40. Today’s large volume signals solid investor participation and bullish momentum, while the price sits near the upper end of the daily band.
Technically, NATIONALUM remains in a clear short-term uptrend, outperforming its sector with recent moving average crossovers strengthening the bullish case. The key support is now located near ₹204, which was today’s low, and resistance lies at ₹224—the stock’s upper circuit limit. Momentum indicators are in positive territory, reflecting strong buying interest, but short-term traders should be aware that overbought readings could invite some consolidation or profit booking.
On the fundamental side, the company’s financials show robust quarterly revenue and profit growth, with strong operating margins and minimal debt. As a major aluminum producer, NATIONALUM benefits from stable commodity prices and high export demand. Overall sentiment is upbeat, suggesting potential for further gains if market conditions remain supportive and the company sustains its operational efficiency.

AUDCAD besrish ( Sell )📌 Trade Plan (AUDCAD)
Sell Limit (Entry Zone):
0.91514
0.91493
Stop Loss (SL): Just above the marked “Caution” zone (around 0.91680–0.91700 area).
Take Profit (TP):
TP Liquidity: 0.90767
---
📌 Why Sell?
Price retesting supply zone (Caution area).
Wyckoff distribution + UTAD test confluence.
Sell limit aligned with imbalance/fair value gap.
Liquidity resting below recent lows (target 0.90767).
📌 News Support
CAD strength outlook from recent economic data.
AUD pressured by weaker commodity demand.
High-impact news could trigger liquidity run to downside.

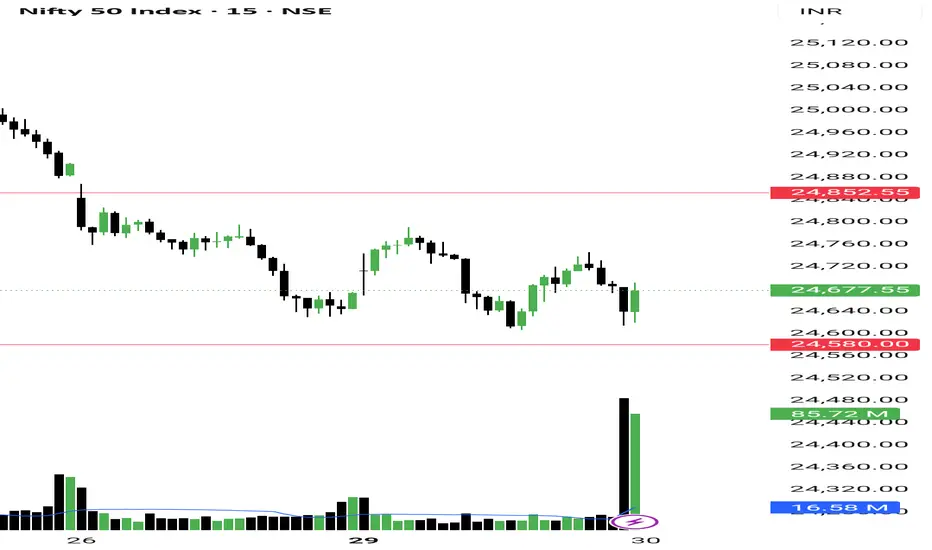
Nifty Down but Buyers Volume is Back! So as we studied, NSE:NIFTY gave a chance to Sell-on-Rise. The index went up to the day high and then dropped.
But here’s the interesting part – even though price fell, the candle closed red, and it ended below Friday’s low, the buyers’ volume was still higher by 60 million.
That’s a classic sign of accumulation!
So yes, I’ve entered the first batch of index longs. Even if it dips further, I’ll be accumulating more.
Now let’s check the data for tomorrow:
- Pivot is now at 24677, and PP is 0.17
- Retail index down but buyers’ volume up = classic sign of institutional accumulation!
My plan for tomorrow is simple – I’ll add more to the longs I bought today if Nifty opens above the pivot.
The upside target is resistance at 24850.
Support is at 24580.
On the equity side – yes, we saw a sell-off on Friday and swing supports were broken. But today, stocks didn’t get any strong follow-up. I see this as manipulation and liquidity grabbing.
That’s why I didn’t sell anything yet. In fact, I’ve added more to my holdings – NSE:KROSS and NSE:HINDZINC .
For tomorrow, I’ll be focusing on #Commodity sector. And from now on, I’ll also start hunting for my Earning Pivot setups since quarterly results are here.
That’s all for the day. Take care and have a profitable tomorrow.
---
📊 Levels at a glance:
Pivot: 24677
Support: 24580
Resistance: 24850
Pivot Percentile: 0.17 (supports accumulation view)
Bias: Long buildup, add more if above pivot
Sectors to watch: Commodities, Earnings Pivot setups
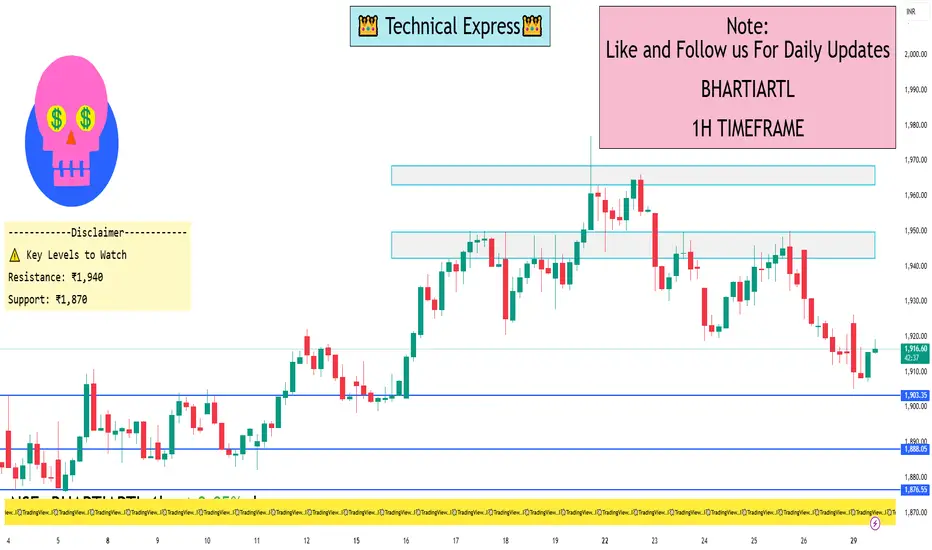
BHARTIARTL 1 Hour View📊 Key Technical Indicators
Relative Strength Index (RSI): 47.96 – Neutral, indicating neither overbought nor oversold conditions.
MACD: 6.55 – Strong bearish, suggesting downward momentum.
Average Directional Index (ADX): 17.09 – Neutral, indicating a weak trend.
Super Trend: ₹1,870.13 – Mild bullish, suggesting a slight upward trend.
Williams %R: -67.16 – Neutral, indicating no extreme overbought or oversold conditions.
Commodity Channel Index (CCI): -1.48 – Neutral, suggesting no strong trend.
📈 Moving Averages Analysis
Exponential Moving Averages (EMA):
5-period: ₹1,924.98 – Strong bearish.
15-period: ₹1,924.34 – Strong bearish.
50-period: ₹1,913.43 – Strong bearish.
100-period: ₹1,884.82 – Mild bullish.
Simple Moving Averages (SMA):
5-period: ₹1,927.04 – Mild bullish.
15-period: ₹1,925.39 – Mild bullish.
50-period: ₹1,909.92 – Mild bullish.
200-period: ₹1,792.48 – Mild bullish.
The alignment of moving averages indicates a generally bullish sentiment in the short term.
🔄 Trend and Volume Insights
Trend: The stock is exhibiting a mild bullish trend, supported by the Super Trend indicator and the alignment of moving averages.
Volume: An increase in trading volume could confirm the strength of the current trend.
⚠️ Key Levels to Watch
Resistance: ₹1,940 – a potential barrier if the stock continues its upward movement.
Support: ₹1,870 – a level to watch for potential price rebounds.
✅ Summary
Bharti Airtel Ltd. is currently in a mild bullish phase on the 1-hour timeframe, with supportive indicators and moving averages. However, the ADX suggests weak trend strength, indicating potential consolidation. Traders should monitor key levels and volume changes for confirmation of trend continuation.
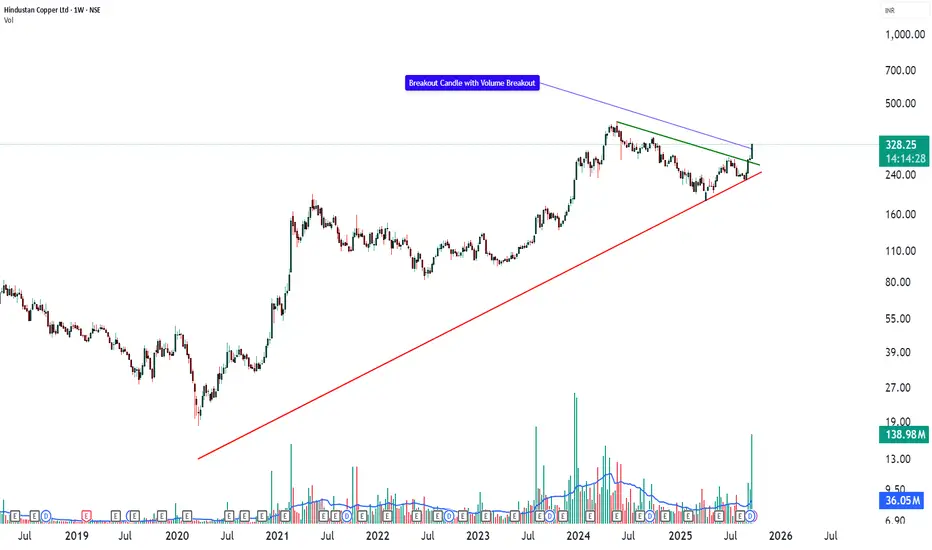
HINDCOPPER _ Multi-Year Triangle BreakoutHindustan Copper (HINDCOPPER) – Multi-Year Triangle Breakout with Educational Trade Analysis
Hindustan Copper Ltd. (CMP: ₹328) has delivered a decisive breakout on the weekly chart. The stock had been compressing within a multi-year symmetrical triangle formed by a rising trendline from the 2020 lows (red) and a descending resistance from the 2022 highs (green). The most recent candle shows a sharp +16% surge with strong volume, pushing price above the descending trendline and signaling a potential continuation of the long-term uptrend.
From a technical perspective, ₹250–260 remains a key support zone, while the next major resistance cluster lies near ₹400–420, which aligns with the measured-move projection from the triangle’s height. This price structure sets up an instructive case study in pattern breakouts for market participants.
Fundamentally, Hindustan Copper enjoys a unique monopoly as India’s only fully integrated copper producer, covering mining through to refined products. It commands a vast resource base of roughly 755 million tonnes of copper ore, providing decades of visibility. Management is working to ramp mining capacity from 4 MTPA to 12.2 MTPA, led by the historic Rakha mine restart and multiple underground expansions. FY25 was a landmark year with ₹2,071 crore revenue and ₹469 crore PAT, and Q1 FY26 has already delivered an ~18 % YoY PAT growth. The balance sheet is healthy and nearly debt-free, offering flexibility to fund expansion.
On the macro side, global copper demand is in a structural uptrend, driven by EV adoption, renewable energy installations, and power-grid upgrades. Supply disruptions at major global mines have tightened the market, creating a favorable price backdrop for Hindustan Copper.
📝 Educational Trade Analysis
For traders studying breakouts, this setup offers a clear example of blending chart structure with fundamental support. A typical learning plan could observe a hypothetical entry zone on a sustained close above ₹335–340, with illustrative targets near ₹400 and ₹450, which correspond to the pattern’s measured move. A protective stop for case-study purposes might be placed around ₹295, just below the breakout and the 50-week moving average.
These levels are for educational illustration only—not a recommendation to buy or sell.
This integrated perspective shows how a commodity-backed PSU with strong fundamentals and an expansion pipeline can align with a technically significant breakout, offering a valuable lesson in combining price action with fundamental drivers.
⚠️ Disclosure & Disclaimer – Please Read Carefully
I/we have no financial interest or position in Hindustan Copper at the time of writing.
The information shared here is meant purely for learning and awareness. It is not a buy or sell recommendation and should not be taken as investment advice. I am not a SEBI-registered investment adviser, and all views expressed are based on personal study, chart patterns, and publicly available market data.
Trading—whether in stocks or options—carries risk. Markets can move unexpectedly, and losses can sometimes exceed the money you have invested. Past performance or past setups do not guarantee future results.
If you are a beginner, treat this as a guide to understand how the market works and practice on paper trades before risking real money. If you are experienced, always assess your own risk, position sizing, and strategy suitability before entering trades.
Consult a SEBI-registered financial adviser before making any real trading decision. By engaging with this content, you acknowledge full responsibility for your trades and investments.
💬 Found this useful?
🔼 Give this post a Boost to help more traders discover clean, structured learning.
✍️ Drop your thoughts, questions, or setups in the comments — let’s grow together!
🔁 Share with fellow traders and beginners to spread awareness.
👉 “If you liked this breakdown, follow for more clean, structured setups with discipline at the core.”
🚀 Stay Calm. Stay Clean. Trade With Patience.
Trade Smart | Learn Zones | Be Self-Reliant 📊
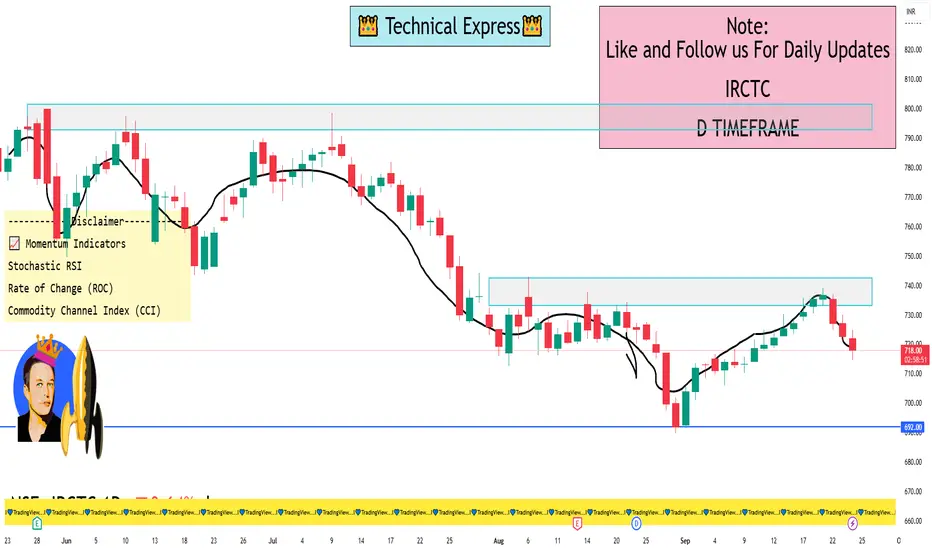
IRCTC 1 Day View📈 Key Intraday Levels
Opening Price: ₹722.05
Day’s High: ₹724.85
Day’s Low: ₹714.60
Closing Price: ₹719.20
🔍 Technical Indicators
Support Level: ₹719.20 – This level is backed by accumulated volume, suggesting it may act as a reliable support point.
Resistance Level: ₹729.30 – The short-term moving average indicates this as a potential resistance point.
Volatility: The stock exhibited a 1.25% intraday range, with average daily volatility around 1.12%, indicating relatively stable movements.
📊 Momentum Indicators
Stochastic RSI: Currently in a neutral zone, suggesting neither overbought nor oversold conditions.
Rate of Change (ROC): Indicates a neutral condition, with no strong momentum in either direction.
Commodity Channel Index (CCI): Also in a neutral range, reflecting a lack of strong trend.
🛡️ Risk Management
Suggested Stop-Loss: ₹683.68 – Given the stock's low daily volatility, this stop-loss level offers a conservative risk management approach.
📌 Summary
IRCTC's stock is currently trading within a defined range, with support at ₹719.20 and resistance around ₹729.30. Momentum indicators suggest a neutral stance, indicating a wait-and-watch approach may be prudent for short-term traders. For those considering a longer-term perspective, the stock's low volatility and established support levels could present opportunities for accumulation, especially if it maintains above the ₹719.20 support.
SILVERHello & welcome to this analysis
Silver in daily time frame appears to be in its 5th wave.
The larger impulse could end anywhere between $43.50 - 45 / INR 125000 - 129000. From there I expect it to retrace to $38 /INR 116000
MCX Silver will depend largely on $:INR movement.
Silver remains a strong commodity for medium to long term and all dips should be used to add.
All the best

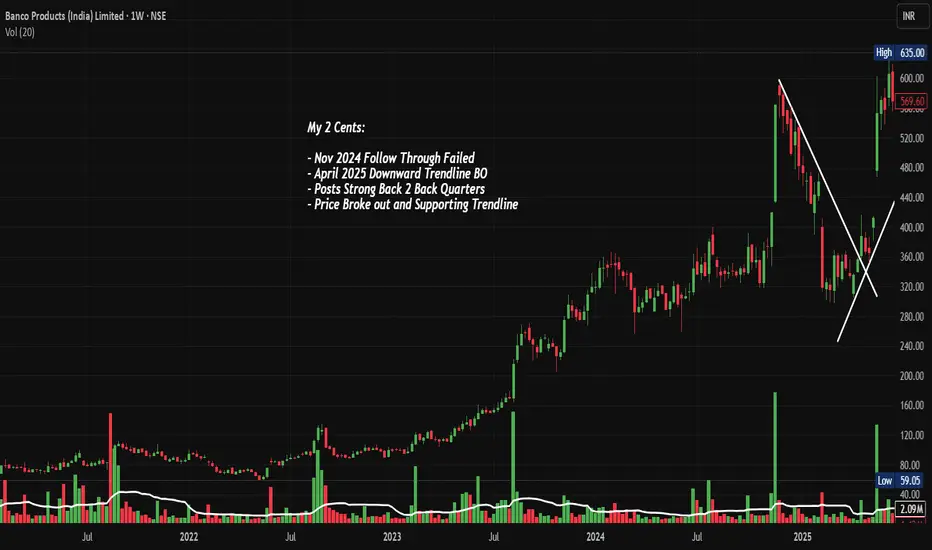
BANCOINDIA: BO after Consolidation, Chart of the WeekBanco Products Broke Out From a Consolidation, Continuing Its Massive Bull Run. Let's analyse in "Chart of the Week"
As per the Latest SEBI Mandate, this isn't a Trading/Investment RECOMMENDATION nor for Educational Purposes; it is just for Informational purposes only. The chart data used is 3 Months old, as Showing Live Chart Data is not allowed according to the New SEBI Mandate.
Disclaimer: "I am not a SEBI REGISTERED RESEARCH ANALYST AND INVESTMENT ADVISER."
This analysis is intended solely for informational purposes and should not be interpreted as financial advice. It is advisable to consult a qualified financial advisor or conduct thorough research before making investment decisions.
Price Action Analysis:
- Banco Products has completed a consolidation phase
- The stock has demonstrated exceptional momentum with a breakout above the ₹400 levels in April 2024
- Current trading price of ₹835.60 represents a gain of over 100% from the breakout point
- Price action shows strong institutional accumulation with increasing volumes during upward moves
Volume Spread Analysis
- Volume spikes are clearly visible during key breakout moments, particularly in Q2 2024
- The highest volume bars (green) coincide with price advances, indicating genuine buying interest
- Recent volume of 36.75M shares traded shows sustained institutional participation
- Volume patterns suggest smart money accumulation rather than retail speculation
Key Technical Levels:
Base Formation:
- Multi-year base formed between ₹100-400 levels from 2022 to early 2024
- This represents a classic cup and handle pattern on the weekly timeframe
- The base provided strong support and allowed for institutional accumulation
- Depth of base (approximately 18 months) suggests a strong foundation for future moves
Support Levels:
- Primary Support: ₹650-680 (previous resistance turned support)
- Secondary Support: ₹550-580 (50% retracement of recent rally)
- Major Support: ₹400-420 (breakout zone)
- Ultimate Support: ₹300 (top of multi-year base)
Resistance Levels:
- Immediate Resistance: ₹850-870 (current highs)
- Next Resistance: ₹950-1000 (psychological round number)
- Extended Resistance: ₹1200-1250 (measured move from base)
Position Sizing:
- Allocate a maximum of 3-5% of the portfolio to a single stock
- Use the pyramiding approach: 50% on initial entry, 25% on confirmation, 25% on extension
- Risk per trade should not exceed 2% of total capital
Risk Management Rules:
- Honour stop-losses strictly without emotional interference
- Book partial profits at predetermined levels
- Reduce position size if the stock shows signs of distribution
- Monitor sector rotation and overall market conditions
Sectoral and Fundamental Backdrop:
Auto Components Sector Overview:
- India's auto component industry is driving macroeconomic growth, with the market estimated to grow by USD 259.03 billion from 2025 to 2029 at a CAGR of 37%
- The auto components sector achieved 32.8% growth in FY24, with optimism for continued strong performance
- Export revenues could soar to $100 billion by 2030 from $21 billion in 2024, at a 30% CAGR
Fundamental Strengths of Banco Products:
- Market Cap of ₹11,952 crores with revenue of ₹3,379 crores and profit of ₹433 crores
- Leading manufacturer and exporter of automotive and industrial gaskets, heat shields, and sealing solutions since 1961
- Promoter holding at 67.88% shows strong management confidence
Growth Catalysts:
- Expanding electric vehicle segment creating new opportunities
- Sector attracted ₹2,45,771 crore FDI between April 2000 and December 2024
- Export potential with global OEM partnerships
- Various Indian auto component manufacturers are entering joint ventures with foreign companies for domestic production
Risks and Challenges:
- Commodity price fluctuations affecting margins
- Global economic slowdown impacting export demand
- Competition from Chinese manufacturers
- Trading at 9.17 times book value indicates a premium valuation
Market Outlook:
Short-term Outlook (1-3 months):
- Expect consolidation in the ₹750-870 range
- Watch any dip below ₹700
- Watch for a breakout above ₹870 for the next leg up
Medium-term Outlook (3-12 months):
- Sustained institutional interest expected
- Earnings growth should support price appreciation
Long-term Outlook (1-3 years):
- Export opportunities provide additional upside
- EV transition could create new revenue streams
- Sector leadership position makes it a preferred play in the auto components space
Full Coverage on my Newsletter this Week
Keep in the Watchlist and DOYR.
NO RECO. For Buy/Sell.
📌Thank you for exploring my idea! I hope you found it valuable.
🙏FOLLOW for more
👍BOOST if you found it useful.
✍️COMMENT below with your views.
Meanwhile, check out my other stock ideas on the right side until this trade is activated. I would love your feedback.
As per the Latest SEBI Mandate, this isn't a Trading/Investment RECOMMENDATION nor for Educational Purposes; it is just for Informational purposes only. The chart data used is 3 Months old, as Showing Live Chart Data is not allowed according to the New SEBI Mandate.
Disclaimer: "I am not a SEBI REGISTERED RESEARCH ANALYST AND INVESTMENT ADVISER."
This analysis is intended solely for informational purposes and should not be interpreted as financial advice. It is advisable to consult a qualified financial advisor or conduct thorough research before making investment decisions.
Tata SteelTata Steel in the verge of the breakout. Can go long. If it breaks the channel on the upside. and commodity is cycle business it needs other global market support.
Wait for breakout or breakdown.
This is for educational purposes

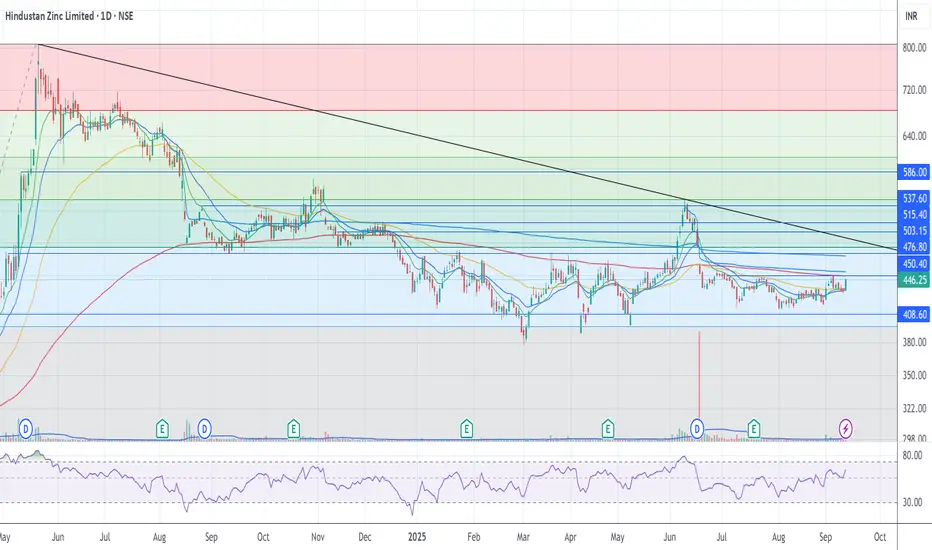
HINDUSTAN Zinc - 3rd largest silver producer in the world Did you know Hindustan Zinc is the 3rd largest producer of Silver in the world?
Along with a 75% market share of ZInc in India..they also produce Silver.
With the underlying commodity moving up..
Long if it can retest and bounce from 455 with a Stoploss below 445.

Hindustan Zinc – 200 DEMA Crossover ProjectionCurrent price is ~ ₹450-₹451.
50-day SMA is ~ ₹432.6.
200-day SMA is ~ ₹446.6.
52-week high ~ ₹575.40, low ~ ₹378.15.
Support zones: ₹444-₹447
Close to 200-day SMA/DEMA, this is key support. If price stays above this, bullish bias strengthens.
₹432-₹435
Next lower support (50-day SMA ~432.6) and previous consolidation
Resistance zones
₹455-₹460
Short-term resistance (recent highs).
₹472-₹475
Stronger resistance ahead. Pivot / Fibonacci levels suggest resistance around here.
₹500
Major psychological / historical resistance. If break above, room for more upside.
Outlook: Projection (with 200-DEMA Crossover)
If price manages to break & hold above the 200-day DEMA/SMA (~₹446-₹447):
Short term (1-3 weeks):
Expect retests of ₹460-₹465 if momentum continues. Failure to hold above ~₹446-₹447 could lead to retests of support ~₹432-₹435.
Medium term (1-3 months):
Potential for move toward ₹500, provided strong volume & favorable commodity/metals environment. Resistance in the ₹472-₹500 range likely to slow the move unless clear catalysts appear.
Long term (6+ months):
If macro + fundamentals stay supportive (zinc prices, cost structure, demand), breakout above ₹500 could lead toward ₹550-₹600 zone — though that would require strong conviction.
Disclaimer: lnkd.in

Hind Zinc - Commodity tailwindsWith its underlying commodities moving..the stock should move back above the 200EMA.
Long above 450 with a Stoploss below 430.
There is a small H&S pattern on the smaller timeline. There could also be a potential phase shift.
There is a gap fill upto 480 which could potentially get filled.
BUY GBPNZD📊 Trade Idea: BUY GBPNZD
The GBP is showing resilience supported by strong economic outlook, while NZD remains under pressure from weaker global risk sentiment and softer commodity demand. This creates a bullish setup for GBPNZD.
🔹 Technical Outlook:
Price is trading above the 2.26756 support zone, keeping the bullish structure intact.
Higher highs and higher lows indicate continued upside momentum.
🔹 Trading Bias: Bullish
Entry Zone: 2.26456-2.26056
Targets: 🎯2.34384
Stop Loss: 2.24132
⚠️ Risk management is crucial as GBPNZD is a high-volatility pair.
