SKM EGG PRODUCTS technical analysisSKM Egg Products Export (India) Ltd. (NSE: SKMEGGPROD) is currently trading at INR 199.71. The company specializes in the production and export of processed egg products, catering to both domestic and international markets.
Key Levels
Support Level: INR 135.65
Swing Level: INR 226.43
Possible Upside Levels: INR 487.95, INR 578.75, INR 694.40
Technical Indicators
RSI: The Relative Strength Index (RSI) is currently at 46.54, suggesting neutral momentum. RSI indicates whether a stock is overbought or oversold, with values above 70 signaling overbought conditions and below 30 indicating oversold levels.
Volume: The trading volume is moderate, showing stable investor participation. Increased volume near key levels may confirm potential price action in either direction.
Sector and Market Context
SKM Egg Products operates within the food processing and export sector, which benefits from rising global demand for protein-based nutrition and processed food products. The industry is influenced by exchange rate fluctuations, commodity pricing, and regulatory changes in export policies. Additionally, increased consumer awareness of health-focused diets has contributed to sector growth, benefiting companies offering specialized products like SKM Egg. However, broader market trends, including inflation, global trade agreements, and supply chain efficiency, may affect stock performance.
Latest News and Development
Recent reports indicate SKM Egg has maintained steady export volumes, with increasing demand from European and Asian markets.
Analysts highlight potential expansion into newer geographic regions, which could drive revenue growth in the upcoming quarters.
The latest quarterly results show stable margins, though raw material costs have increased slightly, impacting operational efficiency.
SKM Egg Products has not declared a dividend in the recent quarter, reflecting a reinvestment strategy for expansion and production capacity enhancement.
Analysis Summary
SKM Egg Products exhibits balanced technical momentum, with key levels identified to gauge future price movements. While RSI suggests neutral sentiment, sector dynamics and export trends remain favorable for long-term growth. The company’s strategic expansion and steady demand support its outlook, though macroeconomic factors and industry-specific risks should be monitored.
Search in ideas for "COMMODITY"

Share Ind Securities Ltd Share India Securities Ltd. is a prominent technology-driven financial services company in India, established in 1994. The company offers a wide range of services, including equity and derivatives broking, commodity and currency trading, portfolio management, mutual fund distribution, and investment advisory services. With a strong emphasis on algorithmic trading and fintech solutions, Share India aims to provide advanced trading platforms to its clients.
**Company Overview:**
* **Founded:** 1994
* **Headquarters:** Noida, Uttar Pradesh, India
* **Chairman & Managing Director:** Parveen Gupta
* **CEO & Whole-Time Director:** Sachin Gupta
* **Managing Director:** Kamlesh Vadilal Shah
* **Employee Strength:** Over 3,700 employees
* **Branch Network:** Presence in 16 states with a network of 729 branches
**Key Services:**
* **Trading Services:** Equity, derivatives (F\&O), commodities, and currencies
* **Investment Services:** Portfolio management, mutual fund advisory, and investment research
* **Technology Solutions:** Algorithmic trading platforms with AI and machine learning capabilities
* **Online Platforms:** Web-based trading terminal and mobile application for seamless trading experiences
**Financial Highlights (Fiscal Year Ending March 2024):**
* **Revenue:** ₹16.57 billion
* **Gross Profit:** ₹8.81 billion
* **Operating Income:** ₹6.58 billion
* **Income Before Tax:** ₹6.58 billion 
**Stock Information:**
* **Ticker Symbol:** SHAREINDIA
* **Listed On:** National Stock Exchange (NSE) and Bombay Stock Exchange (BSE)

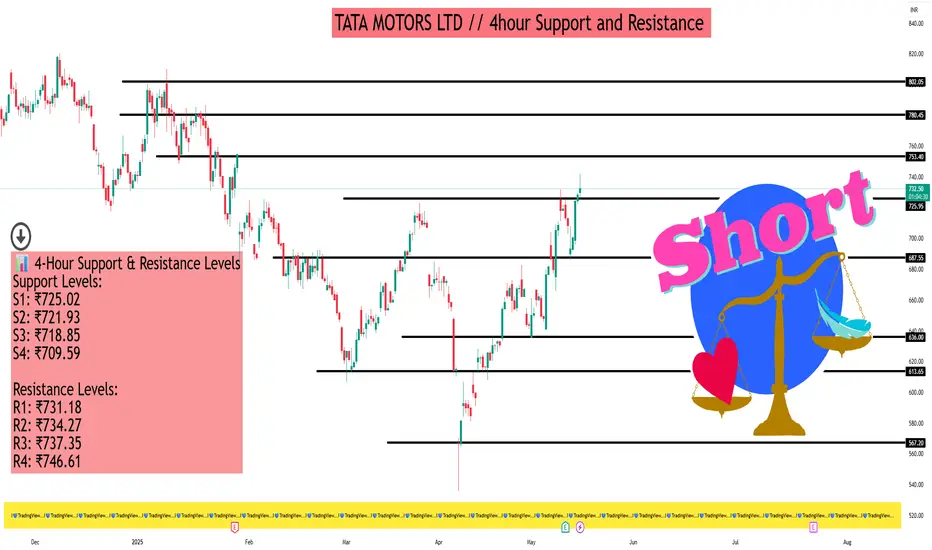
TATA MOTORS LTD // 4hour Support and Resistance As of May 16, 2025, Tata Motors Ltd. (NSE: TATAMOTORS) is trading at approximately ₹735.00. Here's a detailed analysis of its support and resistance levels on the 4-hour timeframe, along with insights from technical indicators and chart patterns.
📊 4-Hour Support & Resistance Levels
Support Levels:
S1: ₹725.02
S2: ₹721.93
S3: ₹718.85
S4: ₹709.59
Resistance Levels:
R1: ₹731.18
R2: ₹734.27
R3: ₹737.35
R4: ₹746.61
These levels are derived from Camarilla pivot calculations and provide key price points where the stock may experience buying or selling pressure.
📈 Technical Indicators Overview
Relative Strength Index (RSI): 68.4 — approaching overbought territory, suggesting potential for a short-term pullback.
MACD (12,26): 8.69 — indicates bullish momentum.
Average Directional Index (ADX): 42.07 — reflects a strong trend strength.
Stochastic Oscillator: 76.29 — nearing overbought levels, which may signal a potential reversal.
Commodity Channel Index (CCI): 103.31 — suggests the stock is in a strong uptrend.
These indicators collectively point towards a bullish trend, but caution is advised due to overbought signals.
🔍 Chart Patterns & Price Action
Recent analyses indicate that Tata Motors has formed a Shark pattern, with potential resistance in the ₹850 to ₹900 range. Short-term targets include ₹700, ₹750, ₹780, ₹820, ₹860, and ₹900. A weekly candle close above ₹900 could signal further upside potential.
Additionally, Elliott Wave analysis suggests that the stock may have completed a Wave (5) near ₹1180, with a potential decline towards the ₹850 level as part of a corrective phase.
🧭 Trading Strategy Insights
Bullish Scenario: If the stock sustains above ₹737.35 (R3), it may target higher resistance levels, with ₹746.61 (R4) being a key level to watch.
Bearish Scenario: A break below ₹725.02 (S1) could lead to further downside, with support at ₹709.59 (S4) potentially being tested.
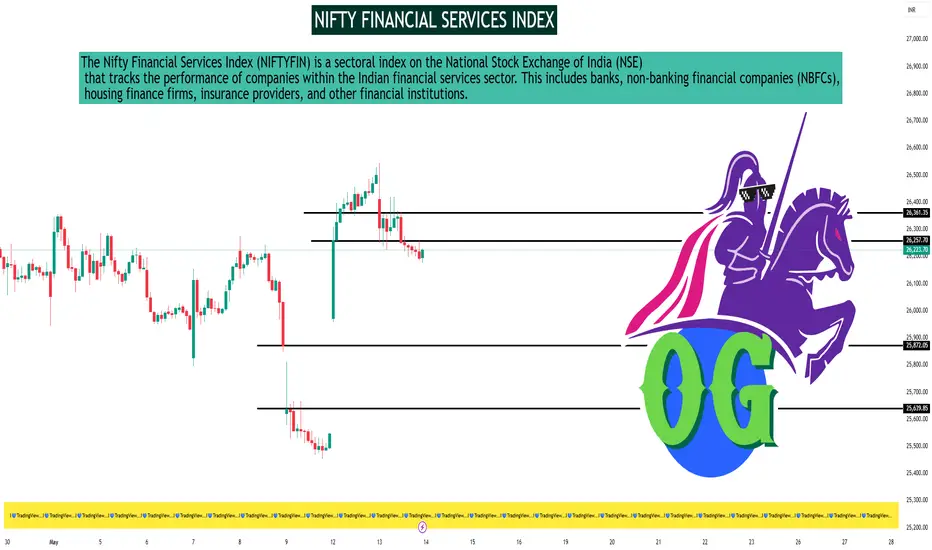
NIFTY FINANCIAL SERVICES INDEXAs of May 13, 2025, the Nifty Financial Services Index (NIFTYFIN) closed at 26,206.00, reflecting a decline of 1.10% for the day.
📊 30-Minute Timeframe Technical Overview
Key Support and Resistance Levels:
Support: Approximately 25,245.07
Resistance: Approximately 26,562.40
These levels are derived from recent price actions and are crucial for traders monitoring short-term movements.
Technical Indicators Summary:
Relative Strength Index (RSI 14): 52.33 – Neutral
Stochastic Oscillator (9,6): 98.35 – Overbought
Stochastic RSI (14): 2.60 – Oversold
MACD (12,26): 54.67 – Buy
Average Directional Index (ADX 14): 15.72 – Neutral
Williams %R: -1.94 – Overbought
Commodity Channel Index (CCI 14): -48.30 – Neutral
Average True Range (ATR 14): 166.29 – Indicates lower volatility
Rate of Change (ROC): 2.80 – Buy
Bull/Bear Power (13): -19.22 – Sell
Interpretation:
The technical indicators present a mixed outlook. While the MACD and ROC suggest bullish momentum, the overbought readings from the Stochastic Oscillator and Williams %R indicate potential for a short-term pullback. The neutral RSI and ADX values suggest a lack of strong directional momentum.
📈 Accessing 30-Minute Charts
For real-time 30-minute interval charts and advanced technical analysis tools, consider the following platforms:
TradingView – Nifty Financial Services Index
Investing.com – Nifty Financial Services Chart
Groww Terminal – Nifty Financial Services
These platforms offer customizable charts with various indicators to assist in your analysis.
Patanjali for 2000Patanjali Foods: A Bullish Outlook
Patanjali Foods has undergone a significant transformation since its acquisition by the Patanjali Group, evolving from primarily an edible oil company (Ruchi Soya) into a diversified FMCG and food powerhouse. Your bullish stance appears well-supported by several factors:
**1. Strong Fundamentals & Business Model
* **Diversified Product Portfolio:**
* **Edible Oils:** Still a core business with strong brands like Nutrela, Mahakosh, Sunrich, Ruchi Gold, and now Patanjali oils. This segment benefits from consistent household demand.
* **FMCG Expansion:** Leveraging the Patanjali brand, they've aggressively expanded into biscuits (Patanjali Biscuits), noodles, breakfast cereals, atta (flour), juices, and other food products. This is a high-growth area.
* **Food & Nutraceuticals:** Products like Nutrela Soya Chunks, other Nutrela high-protein items, and Patanjali's health-focused food items tap into the growing health and wellness trend.
* **Palm Oil Plantations:** One of India's largest palm oil plantation companies, aligning with the government's push for self-sufficiency in edible oils. This provides backward integration and control over raw material to some extent.
* **Brand Strength & Distribution:**
* **Patanjali Brand Equity:** The Patanjali name carries immense trust, particularly in Tier-2, Tier-3 cities, and rural India, associated with "swadeshi" (indigenous) and natural products.
* **Ruchi Soya's Legacy:** Established distribution network and brand recognition from Ruchi Soya, especially in the edible oil segment.
* **Synergistic Network:** The combined entity benefits from Patanjali's vast network of stores (Patanjali Chikitsalayas, Arogya Kendras, Swadeshi Kendras) alongside traditional retail channels.
* **Management & Vision:** Driven by Baba Ramdev and Acharya Balkrishna, the company has an aggressive growth vision, focusing on capturing a larger share of the Indian FMCG market.
* **Debt Reduction:** Post-acquisition, a key focus has been on deleveraging the balance sheet, which improves financial health and profitability.
**2. "Good Results" - Financial Performance:**
Your observation of "good results" likely points to:
* **Revenue Growth:** Driven by volume growth in existing categories and expansion into new FMCG segments.
* **Improved Profitability:** Synergies from the acquisition (cost optimization, better procurement), focus on higher-margin FMCG products, and potentially better operational efficiencies contributing to improved EBITDA and Net Profit margins.
* **Healthy Cash Flows:** Stronger operational performance leading to better cash generation.
* **Return Ratios:** Improving Return on Equity (ROE) and Return on Capital Employed (ROCE) as profitability and asset utilization get better.
**3. "Strong Chart" & "Uptrend" with "Good Volumes": Technical Perspective**
From a technical standpoint, your observations are key bullish indicators:
* **Uptrend:** The stock is likely exhibiting a pattern of higher highs and higher lows on various timeframes (daily, weekly). This indicates sustained buying interest.
* **Good Volumes:** Price increases accompanied by rising volumes suggest strong participation and conviction behind the move. It validates the uptrend, indicating that institutional and retail interest is robust. Low volume rallies are often less reliable.
* **Breakouts:** The "strong chart" might show breakouts from key resistance levels, consolidation patterns (like flags, pennants, or triangles), or moving average crossovers (e.g., 50-day MA crossing above 200-day MA – a "golden cross").
* **Support Levels:** During pullbacks, the stock likely finds support at previous resistance levels (now acting as support) or key moving averages, which is characteristic of a strong uptrend.
* **Relative Strength:** The stock might be outperforming the broader market indices or its peers in the FMCG sector, indicating superior strength.
**Investment Strategy: "Take SL and Ride the Trend"**
This is a classic trend-following approach, well-suited for stocks exhibiting the characteristics you've described:
* **Entry:** You've likely already entered or are looking for entry points on minor dips within the larger uptrend.
* **Stop-Loss (SL):**
* **Crucial for Risk Management:** This is your safety net. If the trend unexpectedly reverses, the SL will limit your potential losses.
* **Placement:** A logical SL could be placed below a recent significant swing low, a key support level, or a certain percentage below your entry based on your risk tolerance and the stock's volatility (e.g., using Average True Range - ATR).
* **Trailing Stop-Loss:** As the stock moves in your favor, you can trail your stop-loss upwards. This locks in profits while still giving the stock room to fluctuate within its uptrend. For example, if the stock makes a new swing high and then pulls back to form a new swing low (which is higher than the previous one), you could move your SL below this new swing low.
* **Riding the Trend:**
* **Patience:** The goal is to stay with the trend as long as it remains intact, capturing a significant portion of the upward move. Avoid getting shaken out by minor corrections.
* **Monitoring:** Keep an eye on the price action, volumes, and key support levels. Weakness (e.g., breaking below a key moving average on high volume, or forming lower highs and lower lows) would be a signal to reconsider your position or tighten your SL.
* **Profit Taking:** While riding the trend, you might consider partial profit booking at predefined targets or if the stock becomes extremely overbought, but the core idea is to let winners run.
Potential Catalysts for Continued Upside:
* Further successful launches in new FMCG categories.
* Continued improvement in margins and debt reduction.
* Positive developments in the palm oil business, especially with government support.
* Strong overall consumption trends in India.
**Important Considerations (Even in a Bullish Scenario):**
* **Market Volatility:** Broader market sentiment can impact even strong stocks.
* **Competition:** The FMCG sector is highly competitive with established players.
* **Raw Material Prices:** Volatility in agri-commodity prices (especially edible oils) can impact margins if not managed well.
* **Valuation:** While fundamentals are good, always keep an eye on whether the stock price has run too far ahead of its earnings potential.
**Conclusion:**
Your bullish assessment of Patanjali Foods, based on strong fundamentals, positive results, a clear uptrend backed by good volumes, and a robust chart structure, seems well-founded. The strategy to "take SL and ride the trend" is a disciplined approach to capitalize on such opportunities. Remember to adjust your stop-loss as the trend progresses to protect profits and manage risk effectively.

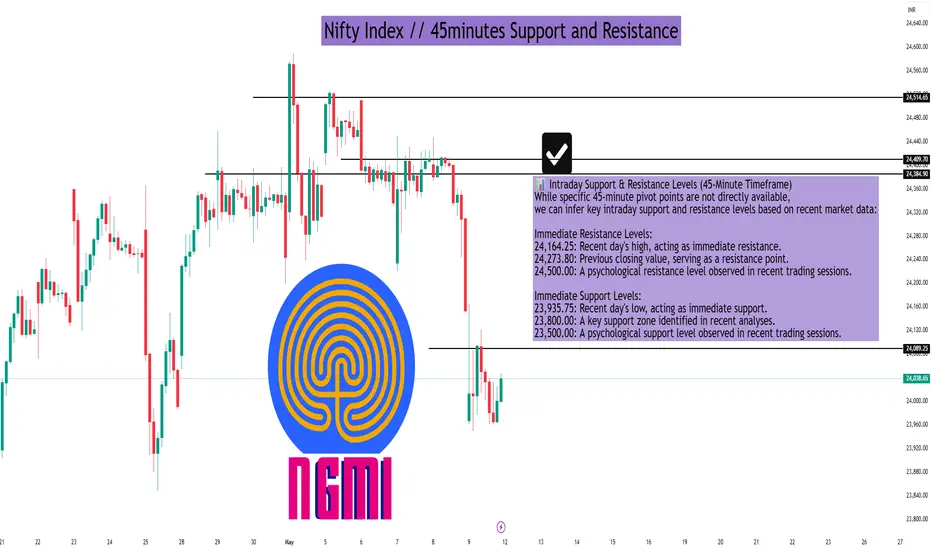
Nifty Index // 45minutes Support and ResistanceAs of the market close on May 9, 2025, the Nifty 50 index stood at 24,008.00, marking a decline of 265.80 points (-1.10%) for the day.
📊 Intraday Support & Resistance Levels (45-Minute Timeframe)
While specific 45-minute pivot points are not directly available, we can infer key intraday support and resistance levels based on recent market data:
Immediate Resistance Levels:
24,164.25: Recent day's high, acting as immediate resistance.
24,273.80: Previous closing value, serving as a resistance point.
24,500.00: A psychological resistance level observed in recent trading sessions.
Immediate Support Levels:
23,935.75: Recent day's low, acting as immediate support.
23,800.00: A key support zone identified in recent analyses.
23,500.00: A psychological support level observed in recent trading sessions.
🔍 Technical Indicators Summary
As per the latest technical analysis:
Relative Strength Index (RSI): 30.201 – Indicates a bearish condition.
Stochastic Oscillator (9,6): 97.279 – Suggests an overbought condition.
MACD (12,26): -105.46 – Indicates a bearish signal.
Average Directional Index (ADX): 47.759 – Suggests a strong trend.
Commodity Channel Index (CCI): -86.2237 – Indicates a bearish condition.
These indicators collectively suggest a bearish outlook for the Nifty 50 index in the short term.
📈 Trading Insights
Resistance Zone: The index faces resistance around the 24,164.25 to 24,273.80 range. A break above this zone could signal bullish momentum.
Support Zone: Support is observed around the 23,935.75 to 23,800.00 range. A breach below this zone may indicate further downside potential.
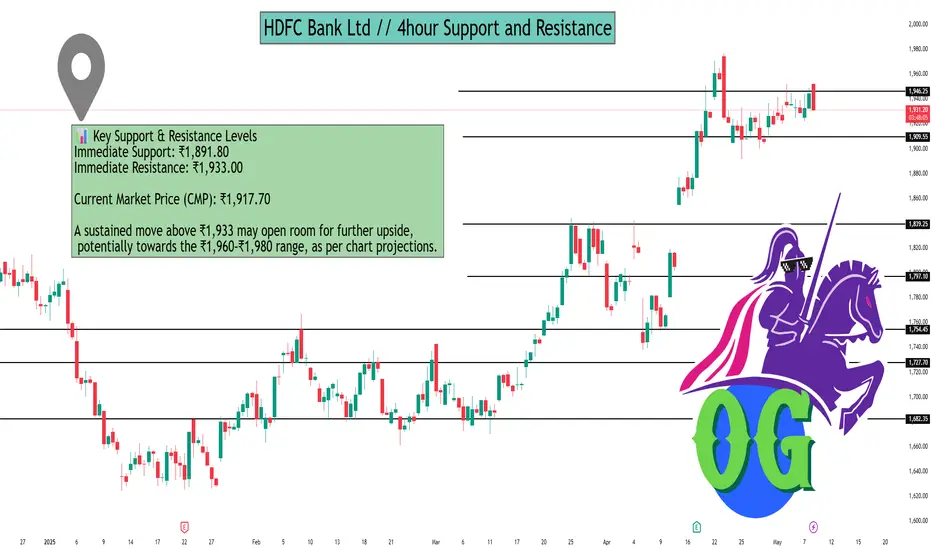
HDFC Bank Ltd // 4hour Support and ResistanceAs of May 8, 2025, here are the key 4-hour support and resistance levels for HDFC Bank Ltd (NSE: HDFCBANK), based on recent technical analyses and pivot point calculations:
📊 Key Support & Resistance Levels
Immediate Support: ₹1,891.80
Immediate Resistance: ₹1,933.00
Current Market Price (CMP): ₹1,917.70
A sustained move above ₹1,933 may open room for further upside, potentially towards the ₹1,960–₹1,980 range, as per chart projections.
🔁 Pivot Point Levels (Daily)
Pivot Type Support Levels Resistance Levels
Classic S1: ₹1,938.90S2: ₹1,929.10S3: ₹1,912.60 R1: ₹1,965.20R2: ₹1,981.70R3: ₹1,991.50
Fibonacci S1: ₹1,938.90S2: ₹1,928.85S3: ₹1,912.60 R1: ₹1,955.15R2: ₹1,965.20R3: ₹1,981.70
Camarilla S1: ₹1,943.19S2: ₹1,940.78S3: ₹1,938.37 R1: ₹1,948.01R2: ₹1,950.42R3: ₹1,952.83
Woodie S1: ₹1,940.57S2: ₹1,932.45 R1: ₹1,958.75R2: ₹1,966.87
Demark S1: ₹1,934.00 R1: ₹1,960.30
📈 Technical Indicators
Relative Strength Index (RSI): 72.46 (Strong Uptrend)
Stochastic RSI: 0.92 (Strong Uptrend)
Commodity Channel Index (CCI): 130.18 (Strong Uptrend)
Money Flow Index (MFI): 86.61 (Strong Uptrend)
These indicators suggest a strong bullish momentum, indicating potential upward movement if buying interest continues.
📌 Trading Insights
Bullish Scenario: A decisive breakout above ₹1,933 could lead to a rally towards ₹1,960–₹1,980.
Bearish Scenario: If the price falls below ₹1,891.80, it may test lower support levels around ₹1,870.69.
Neutral Zone: The area between ₹1,891.80 and ₹1,933 is critical; price action within this range may indicate consolidation before the next significant move.
Gold surges thanks to China buying goods, waiting for FED waveInternational gold prices jumped to 3,332 USD/ounce, up more than 72 USD compared to the bottom of last night's session. The main driving force came from the wave of gold buying in China, when concerns about the weakening economy caused people to massively turn to gold as a safe haven. The H4 chart shows a strong increase, EMA34 has crossed EMA89, establishing a clear short-term uptrend. If gold surpasses 3,340 USD, it is likely to head towards the old peak around 3,420–3,500 USD.
Crude oil prices are still fluctuating strongly around 57.2 USD/barrel, creating an unstable foundation for the commodity market. The FED will announce its policy in the early morning of May 8. Although it is expected to not change interest rates, any statement can move the market. This will be the next big catalyst for gold.

INDUSIND Bank // 1month Support and ResistanceAs of May 5, 2025, here are the key 1-Month Support and Resistance levels for IndusInd Bank Ltd. (NSE: INDUSINDBK) based on recent technical analyses:
📊 Monthly Support and Resistance Levels
Level Value (₹)
S3 809.77
S2 888.08
S1 941.97
Pivot 1,015.58
R1 1,074.17
R2 1,152.48
R3 1,206.37
These levels are derived from the previous month's price range and are commonly used to identify potential reversal points in the market.
📈 Technical Indicators
Relative Strength Index (RSI): 44 (Neutral)
Moving Average Convergence Divergence (MACD): 5.16 (Sell)
Average Directional Index (ADX): 25.44 (Weak Trend)
Commodity Channel Index (CCI): -61.09 (Downtrend)
Money Flow Index (MFI): 26.16 (Strong Downtrend)
These indicators suggest a neutral to slightly bearish momentum, indicating potential downward movement if selling pressure increases.
📌 Summary
Immediate Support: ₹809.77
Immediate Resistance: ₹1,074.17
Medium-Term Outlook: Neutral to slightly bearish, with mixed signals from moving averages and momentum indicators.
Please note that technical analysis is subject to change based on market conditions. It's advisable to monitor these levels regularly and consider consulting with a financial advisor for personalized investment advice.

HDFC Bank ltd // 3hour Support and ResistanceAs of May 5, 2025, here are the key support and resistance levels for HDFC Bank Ltd. (NSE: HDFCBANK) based on the 3-hour chart:
📊 3-Hour Pivot Points
Level Value (₹)
S3 1,689.18
S2 1,701.12
S1 1,714.03
Pivot 1,725.97
R1 1,738.88
R2 1,750.82
R3 1,763.73
These levels are calculated based on the previous day's high, low, and close prices and are used to identify potential support and resistance zones.
📈 Technical Indicators
Relative Strength Index (RSI): 72.46 (Strong Uptrend)
Stochastic RSI: 0.92 (Strong Uptrend)
Commodity Channel Index (CCI): 130.18 (Strong Uptrend)
Money Flow Index (MFI): 86.61 (Strong Uptrend)
These indicators suggest a strong bullish momentum, indicating potential upward movement if buying interest continues.
📌 Summary
Immediate Support: ₹1,689.18
Immediate Resistance: ₹1,738.88
Medium-Term Outlook: Bullish, with strong momentum indicators and positive moving averages.
Please note that technical analysis is subject to change based on market conditions. It's advisable to monitor these levels regularly and consider consulting with a financial advisor for personalized investment advice.

Bharti Airtel Ltd // 2hour Support and ResistanceAs of May 3, 2025, here are the key 2-hour support and resistance levels for Bharti Airtel Ltd (NSE: BHARTIARTL):
📊 2-Hour Support and Resistance Levels
Level Price (₹) Type
Support 1 1,590.27
Support 2 1,561.57
Support 3 1,549.38
Resistance 1 1,618.97
Resistance 2 1,606.78
Resistance 3 1,635.48
These levels are derived from the classic pivot point method and are crucial for traders to monitor, as movements beyond these points may indicate potential changes in the stock's trend.
🔍 Technical Indicators
As of the latest available data:
Relative Strength Index (RSI): 39.84, indicating neutral momentum.
Stochastic RSI: 11.36, suggesting potential for upward movement.
Commodity Channel Index (CCI): -155.75, reflecting bearish momentum.
Money Flow Index (MFI): 62.2, indicating an uptrend.
These indicators suggest a neutral to slightly bullish outlook for the stock.
📈 Strategy Considerations
Bullish Scenario: If the stock price maintains above the support levels, particularly Support 1 at ₹1,590.27, it may continue its upward movement towards Resistance 1 at ₹1,618.97.
Bearish Scenario: A drop below Support 1 could signal a potential reversal or consolidation phase.
Please note that these levels are based on historical data and should be used in conjunction with other technical analysis tools and market conditions.

Tata Power Corporation Ltd // 3hour Support and ResistanceAs of May 3, 2025, here are the key 3-hour support and resistance levels for Tata Power Company Ltd (NSE: TATAPOWER):
📊 3-Hour Support and Resistance Levels
Level Price (₹) Type
Support 1 349.81
Support 2 348.43
Support 3 346.76
Resistance 1 352.86
Resistance 2 354.53
Resistance 3 355.91
These levels are derived from the classic pivot point method and are crucial for traders to monitor, as movements beyond these points may indicate potential changes in the stock's trend.
🔍 Technical Indicators
As of the latest available data:
Relative Strength Index (RSI): 44.03, indicating neutral momentum.
Stochastic RSI: 0, suggesting oversold conditions.
Commodity Channel Index (CCI): -133.29, reflecting bearish momentum.
Money Flow Index (MFI): 56.07, indicating neutral buying and selling pressure.
These indicators suggest a neutral to slightly bearish outlook for the stock.
📈 Strategy Considerations
Bullish Scenario: If the stock price maintains above the support levels, particularly Support 1 at ₹349.81, it may continue its upward movement towards Resistance 1 at ₹352.86.
Bearish Scenario: A drop below Support 1 could signal a potential reversal or consolidation phase.
Please note that these levels are based on historical data and should be used in conjunction with other technical analysis tools and market conditions.

Tata Motors Ltd //1day Supoort and ResistanceAs of May 3, 2025, here are the key 1-day support and resistance levels for Tata Motors Ltd (NSE: TATAMOTORS):
📊 1-Day Support and Resistance Levels
Level Price (₹) Type
Support 1 703
Support 2 690
Support 3 683
Resistance 1 724
Resistance 2 731
Resistance 3 744
These levels are derived from the classic pivot point method and are crucial for traders to monitor, as movements beyond these points may indicate potential changes in the stock's trend.
🔍 Technical Indicators
As of the latest available data:
Relative Strength Index (RSI): 47.9, indicating neutral momentum.
Stochastic RSI: 0.33, suggesting a downtrend.
Commodity Channel Index (CCI): 32.01, reflecting neutral momentum.
Money Flow Index (MFI): 65.42, indicating an uptrend.
These indicators suggest a neutral to slightly bullish outlook for the stock.
📈 Strategy Considerations
Bullish Scenario: If the stock price maintains above the support levels, particularly Support 1 at ₹703, it may continue its upward movement towards Resistance 1 at ₹724.
Bearish Scenario: A drop below Support 1 could signal a potential reversal or consolidation phase.
Please note that these levels are based on historical data and should be used in conjunction with other technical analysis tools and market conditions.

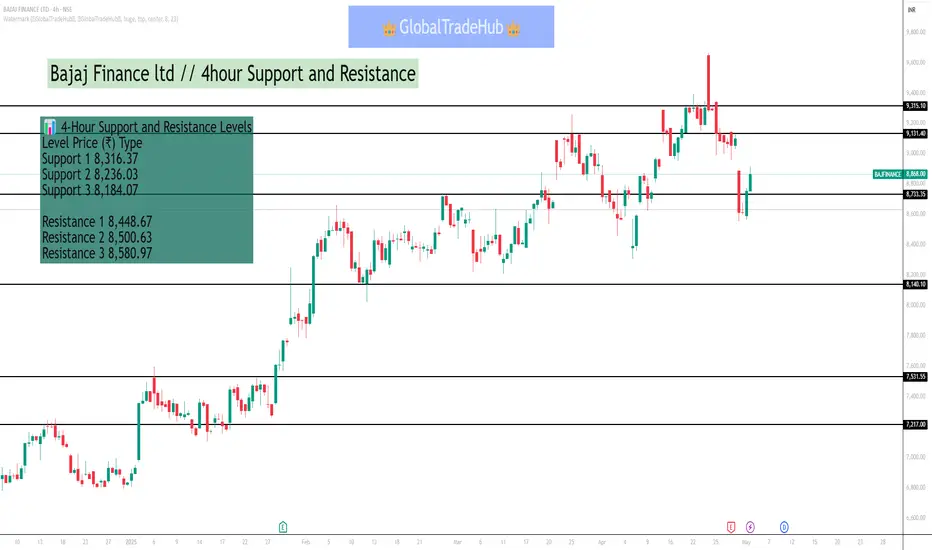
Bajaj Finance ltd // 4hour Support and ResistanceAs of May 3, 2025, Bajaj Finance Ltd (NSE: BAJFINANCE) is exhibiting the following key support and resistance levels on a 4-hour timeframe:
📊 4-Hour Support and Resistance Levels
Level Price (₹) Type
Support 1 8,316.37
Support 2 8,236.03
Support 3 8,184.07
Resistance 1 8,448.67
Resistance 2 8,500.63
Resistance 3 8,580.97
These levels are derived from the classic pivot point method and are crucial for traders to monitor, as movements beyond these points may indicate potential changes in the stock's trend.
🔍 Technical Indicators
As of the latest available data:
Relative Strength Index (RSI): 64.48, indicating an uptrend.
Stochastic RSI: 0.6, suggesting upward momentum.
Commodity Channel Index (CCI): 199.12, reflecting a strong uptrend.
Money Flow Index (MFI): 75.33, indicating strong buying pressure.
These indicators suggest a bullish trend, with the stock trading above its 20-day and 50-day Simple Moving Averages (SMA), and the 100-day and 200-day SMAs indicating an uptrend.
📈 Strategy Considerations
Bullish Scenario: If the stock price maintains above the support levels, particularly Support 1 at ₹8,316.37, it may continue its upward movement towards Resistance 1 at ₹8,448.67.
Bearish Scenario: A drop below Support 1 could signal a potential reversal or consolidation phase.
Please note that these levels are based on historical data and should be used in conjunction with other technical analysis tools and market conditions.
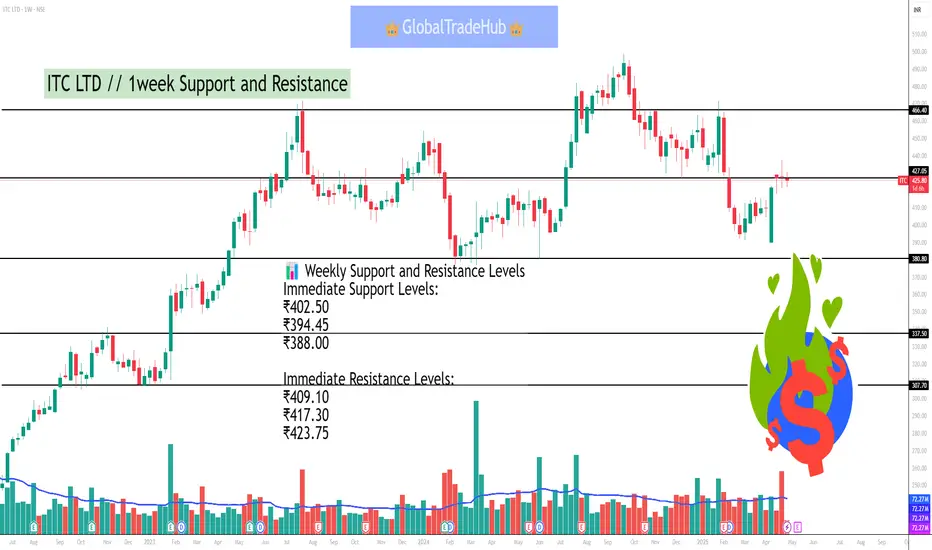
ITC LTD // 1week Support and ResistanceAs of May 1, 2025, at 10:20 AM IST, ITC Ltd (NSE: ITC) is trading at ₹403.05. Based on recent technical analysis, here are the key support and resistance levels for the stock on a weekly (1W) chart:
📊 Weekly Support and Resistance Levels
Immediate Support Levels:
₹402.50
₹394.45
₹388.00
Immediate Resistance Levels:
₹409.10
₹417.30
₹423.75
These levels suggest that if the stock price declines below ₹402.50, it may find support around ₹394.45 and ₹388.00. Conversely, if the price rises above ₹409.10, it could encounter resistance near ₹417.30 and ₹423.75.
🔍 Technical Indicators
ADX (Average Directional Index): 29.19 – indicates a trending market.
RSI (Relative Strength Index): 47.4 – suggests neutral momentum.
MACD (Moving Average Convergence Divergence): -4.66 – indicates a negative trend.
CCI (Commodity Channel Index): 2.74 – suggests neutral momentum.
These indicators suggest a neutral to slightly bearish outlook for ITC in the short term.
📈 Summary
ITC is currently trading near its immediate support levels. A break below ₹402.50 could lead to a decline towards ₹394.45 and ₹388.00. On the upside, resistance is observed at ₹409.10, ₹417.30, and ₹423.75. Traders should monitor these levels closely, as a decisive move beyond these support or resistance levels could signal the next directional move.
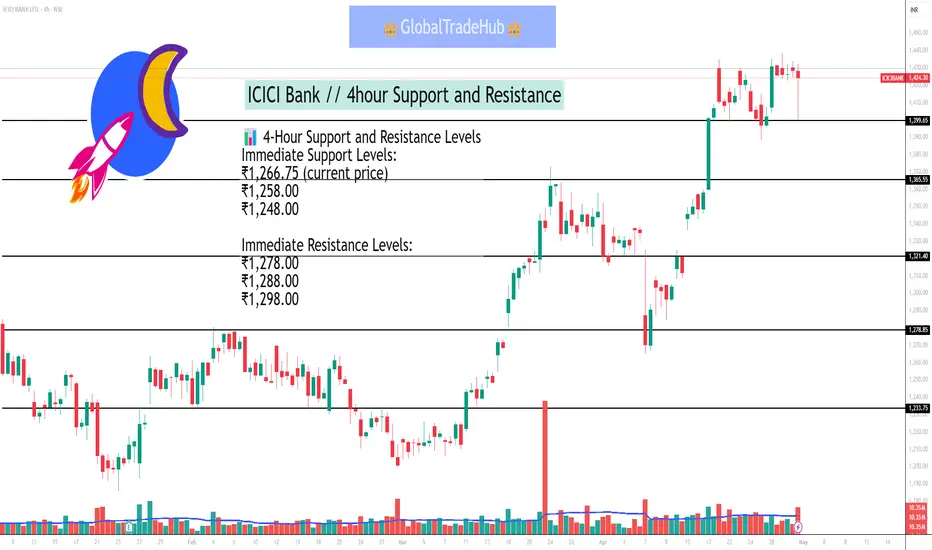
ICICI Bank // 4hour Support and ResistanceAs of May 1, 2025, at 10:08 AM IST, ICICI Bank Ltd (NSE: ICICIBANK) is trading at ₹1,266.75. Based on recent technical analysis, here are the key support and resistance levels for the stock on a 4-hour (4H) chart:
📊 4-Hour Support and Resistance Levels
Immediate Support Levels:
₹1,266.75 (current price)
₹1,258.00
₹1,248.00
Immediate Resistance Levels:
₹1,278.00
₹1,288.00
₹1,298.00
These levels suggest that if the stock price declines below ₹1,266.75, it may find support around ₹1,258.00 and ₹1,248.00. Conversely, if the price rises above ₹1,278.00, it could encounter resistance near ₹1,288.00 and ₹1,298.00.
🔍 Technical Indicators
ADX (Average Directional Index): 17.73 – indicates a weak trend.
RSI (Relative Strength Index): 55.87 – suggests neutral momentum.
MACD (Moving Average Convergence Divergence): 11.45 – indicates a positive trend.
CCI (Commodity Channel Index): 88.61 – suggests the stock is in an uptrend.
These indicators suggest a neutral to slightly bullish outlook for ICICI Bank in the short term.
CASTROL technical analysisStock Overview: Castrol India Ltd, NSE, current price: INR 202.98. Castrol India Ltd is a prominent player in the manufacturing and marketing of automotive and industrial lubricants, greases, and related products, with a strong presence in the automotive sector.
Key Levels:
Support levels: INR 191.34, INR 169.85, INR 138.71.
Upside swing zone: INR 209.13.
Possible upside levels: INR 277.15, INR 308.30, INR 347.95.
Technical Indicators:
RSI (Relative Strength Index): The RSI is currently at 54.44, indicating a neutral stance. This suggests that the stock is neither overbought nor oversold, reflecting balanced momentum. Typically, RSI above 70 suggests overbought conditions, while below 30 indicates oversold zones.
Volume: The trading volume stands at 84.45M, showcasing active investor participation. Higher peaks in trading volume highlight periods of heightened investor interest, which may signal forthcoming price volatility or pivotal movements.
Sector and Market Context: Operating in the lubricants industry, Castrol India Ltd’s performance is closely tied to automotive production and industrial activity. The automotive sector, being sensitive to consumer demand, technological shifts, and regulatory influences, is currently witnessing a mix of recovery and innovation trends. The overall market reflects a cautious optimism, with moderate growth visible in some segments despite macroeconomic headwinds. Castrol's position as a lubricant leader aligns it well with the sector's evolving demands, though the sector remains subject to fluctuations tied to global oil prices and economic cycles.
Risk Considerations:
Market Volatility: Rapid shifts in market sentiment could lead to unpredictable price fluctuations.
Economic Dependency: Any downturn in industrial or automotive production could directly impact demand for lubricants.
Regulatory Policies: New environmental or industry regulations could pose challenges to operations.
Commodity Price Risks: Variability in crude oil prices could influence input costs, affecting margins.
Analysis Summary: Castrol India Ltd reflects a steady technical stance with firm support levels offering resilience. Its potential upside levels and a positive swing zone indicate opportunities for momentum-based movements. The RSI’s neutral position suggests balanced momentum, while trading volumes emphasize active investor engagement. Factoring in sector dynamics and broader market conditions, the stock holds a balanced outlook. However, potential investors should remain mindful of broader market trends, sector-specific developments, and potential risks before making any decisions. This analysis provides a comprehensive perspective without any direct buy or sell recommendations.

ITC Limited ( India’s largest diversified conglomerates )ITC Limited Overview
ITC Limited is one of India’s largest diversified conglomerates, headquartered in Kolkata. Established in 1910 as the Imperial Tobacco Company, it has transformed into a multi-business enterprise with a strong focus on sustainability and innovation.
Key Business Segments
FMCG (Fast-Moving Consumer Goods):
Branded Packaged Foods: Aashirvaad, Sunfeast, Bingo!, Yippee!, and Kitchens of India.
Personal Care: Savlon, Vivel, Fiama, and Engage.
Education & Stationery: Classmate and Paperkraft.
Lifestyle Retail : Wills Lifestyle and ITC Fiama Di Wills.
Hotels:
Luxury hospitality chain ITC Hotels (e.g., ITC Maurya, ITC Grand Chola) with over 120 properties.
Focus on "Responsible Luxury" with LEED-certified green buildings.
Paperboards, Paper & Packaging:
Leading manufacturer of sustainable packaging solutions.
Brands: PAPERKRAFT, ECOLEAF.
Agri Business:
Agri-commodity exports (soy, coffee, spices) and farm-to-fork value chains.
e-Choupal : Digital initiative empowering 4 million+ farmers with market access.
Information Technology:
ITC Infotech (subsidiary): Provides AI, cloud, and cybersecurity solutions globally.
Sustainability & ESG Leadership
Carbon Positive: 3x renewable energy use vs. consumption.
Water Positive: 2x water replenished vs. used.
Solid Waste Recycling Positive: 1.5 million+ metric tons recycled.
Social Impact: 12 million+ livelihoods supported through CSR initiatives.
Global Footprint
Exports to 90+ countries (agri-products, apparel, FMCG).
ITC Infotech operates in 30+ countries.
Leadership
Chairman: Sanjiv Puri (since 2020).
Known for driving diversification into non-tobacco businesses and ESG focus.

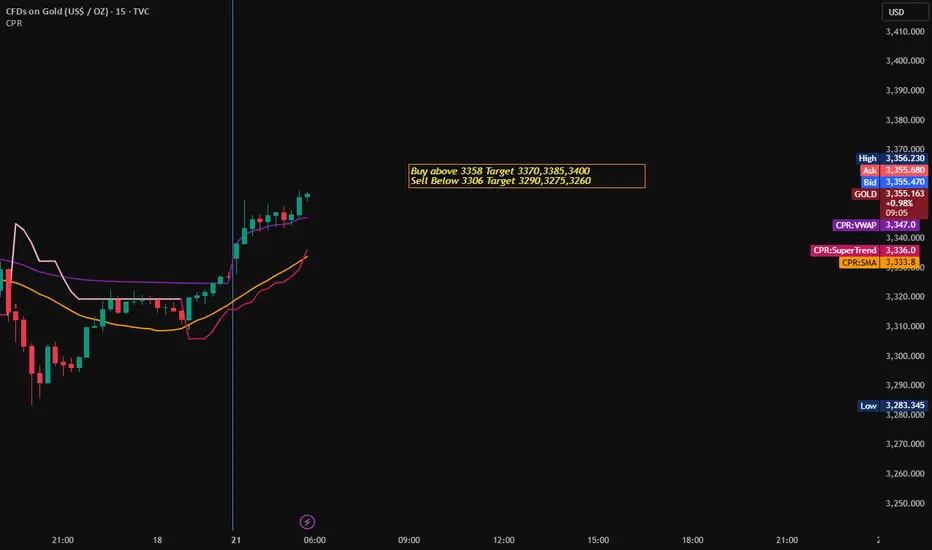
Gold Trading Strategy for 21st April 2025📊 Gold Intraday Trading Strategy – April 21, 2025
🔼 Buy Setup (Bullish Scenario)
Trigger: Buy only if the 15-minute candle closes above $3358.
Entry: After confirmation of a breakout above $3358 on a 15-minute candle close.
Targets:
Target 1: $3370
Target 2: $3385
Target 3: $3400
Stop Loss: Below the low of the breakout candle, or as per your risk management plan.
Tip: Avoid chasing a breakout candle if it’s unusually large. Wait for a pullback or a retest of $3358 for a safer entry.
🔽 Sell Setup (Bearish Scenario)
Trigger: Sell only if the 15-minute candle closes below $3306.
Entry: After confirmation of a breakdown below $3306 on a 15-minute candle close.
Targets:
Target 1: $3290
Target 2: $3275
Target 3: $3260
Stop Loss: Above the high of the breakdown candle, or based on your personal risk profile.
Tip: Ensure there’s momentum or volume supporting the breakdown to avoid false signals.
⚠️ Disclaimer:
This analysis is provided for educational purposes only and is not financial advice. Trading in gold or any commodity involves significant risk and may not be suitable for all investors. Always do your own research or consult a licensed financial advisor before making any investment decisions. Past performance is not indicative of future results. You are solely responsible for your own trades.
Amber Enterprises India Ltd. Air Conditioning & Electronics ManAmber Enterprises India Ltd incorporated in 1956, has a 23.6% share in the total Room Air Conditioner market and is a prominent solution provider for the Air conditioner OEM/ODM Industry in India.
Amber Enterprises is India’s largest player in the Room AC (RAC) outsourced manufacturing space, with:-
~60% market share in RAC contract manufacturing.
Clients include Daikin, LG, Voltas, Panasonic, Blue Star.
Expanding into components (PCB, motors), EV electronics, and solar modules.
Pros
A. AC Industry Boom in India
Penetration: Only 8% of Indian households have ACs (vs. 90% in US).
Demand Surge: Rising incomes + hotter climates → 15%+ annual AC market growth.
PLI Scheme Boost: Govt’s ₹6,238 cr PLI for AC manufacturing benefits Amber.
B. Expansion Beyond ACs
EV Components: Making battery cooling systems, power electronics for EVs.
Solar Inverters & Modules: Partnering with global firms for solar manufacturing.
Defense Electronics: Supplying thermal imaging & control systems.
C. Strong Financials (FY24)
Revenue: ₹6,500 cr+ (CAGR ~25% last 5 years).
Margins: ~7-8% (expected to improve with vertical integration).
Order Book: ₹3,000 cr+ (long-term contracts with OEMs).
** Potential to be a 5x stock by 2030 if EV/solar bets work.
Cons (Risks)
A. High Competition
New entrants (Dixon, Voltas in-house manufacturing).
Pricing pressure from Chinese imports.
B. Margin Pressures
Commodity price swings (copper, aluminum impact costs).
Low-margin business (OEM manufacturing typically has 5-8% margins)
C. Debt Concerns
Net debt of ~₹1,200 cr (used for expansions).
Interest costs could hurt if rates stay high.
Who Should Invest?
Believers in India’s AC & EV boom.
Long-term investors (3-5 years).

Dabur : Best avoided at the moment ? | Whats your view ?#dabur is taking a hit today after negative commentary on margin reduction & muted volume growth 📉.
🔴 Downside Alert: No strong support in sight even on the monthly chart, with the ₹420-400 zone as the first solid safety net.
🟢 Upside Hurdle: ₹525-540 is the key short-term resistance—only a strong breakout here can push it past ₹600, which looks unlikely for now.
📊 Fundamentals:
Trading at P/E ~46 vs. a 5-year avg of ~55. With muted growth outlook & rising commodity costs could keep margins under pressure 🚨
💡 Final Verdict: Sit tight! ⚠️ No clear revival signs yet—best to avoid unless sentiment improves. 👀
#StockMarket #dabur #Investing #MarketUpdate #Stocks #StocksToWatch #Stocks #stoxsense #learntradingwithsudhir 👇

### Maharashtra Seamless Ltd (MAHSEAMLES) Price Analysis
#### **Current Price and Trends**
- **Latest Price:** ₹704.55–₹736.85 (varies by source, reflecting intraday fluctuations)
- **52-Week Range:** ₹562.65 – ₹964.35
- **Market Cap:** ₹9,143–₹9,149 crore
#### **Recent Performance**
- **Q3 FY25 Results:**
- Revenue increased 2% YoY, driven by higher seamless pipe dispatches.
- Profit declined due to lower treasury returns
- **Order Book Stability:** ₹1,500–2,000 crore, supported by demand in oil/gas and manufacturing sectors
#### **Technical Outlook**
- **Risk Profile:** Moderate (2.72x volatility vs Nifty)
- **Entry Point:** Stock appears underpriced with P/B and P/E ratios below sector averages
#### **Strengths**
1. **Undervaluation:** P/E and P/B ratios are significantly lower than sector averages
2. **Dividend Consistency:** 1.47% yield, higher than sector average .
3. **Operational Resilience:** Stable order book and improved dispatches in Q3 FY25
#### **Weaknesses**
1. **Profit Decline:** PAT fell due to treasury returns and margin pressures
2. **Volatility:** Stock has seen significant price swings (52-week range: ~₹400 difference)
### Summary:
Maharashtra Seamless shows **value potential** with attractive valuation ratios and stable demand in core sectors. However, recent profit declines and market volatility warrant caution. Investors should monitor quarterly earnings (next announcement: April 29, 2025) and global commodity trends.

#ADANIPOWER
The chart represents the daily price action of Adani Power Ltd. on NSE, with a significant upward movement of +5.89%, closing at 497.80.
Key resistance levels are observed around 506.85 and 508.80 (previous sell signal), while support lies near 456.70 and 445.00.
The CCI (Commodity Channel Index) remains in negative territory, indicating weak overall trend strength despite today's positive move.
Traders should watch for price action near resistance and support levels for potential breakouts or reversals.
