Nickel (MCX) is Ready to Give Fresh Breakout RallyAscending Triangle with Consolidation at
Resistance Level (Breakout Level ) with Increasing Volume in Green Candles
Search in ideas for "COMMODITY"

Crude Oil-current contract for the daycrude ready for a breakout....u can watch..may give good movements....entry and exit are mentioned in the chart...if u have any doubt comment.
please like&support


MCX Gold Guinea price setting up for a big rallyU.S election result will come soon. Today, we have chances to see solid movements in MCX's bullion sector commodities. And Gold Guinea crossed 50 MA upper side.
Intraday & short-term traders can buy using this strategy to make some money. Targets: 41800 - 42200 - 43000+
If it closes below 50 MA , then don't hold your position in loss. I prefer to exit after it.
Do you want to know about MCX Gold? Go here:
Today, I'm going to update a detailed report on COPPER.

GOLD XAUUSD WEEKLY ANALYSISLast week , it ends up with the sideways movement , and it passed up over resistance line, If that resistance line turn into support .. then the Gold going to see the new high during this week. Analysis made based on pure price action.. not fundamentals

Gold - Study - Buy on dips upto 1492Gold has been in major uptrend, there is strong support at 1492 zone, Now Gold will be buy on dips upto 1492. Keep stop at 1430.

Natural Gas MCX Feb Future Analysis for 3 Feb, for F&O📊 Natural Gas - 27 Feb Fut Analysis 📈
Natural Gas 27 Feb Fut Levels : 📅 Day Range - 5.8 Point
Buy at 173.08 🚀
🎯 Target 1 - 177.48
🎯 Target 2 - 179.7
➕ Add one lot at 172.4
🛑 Buyer SL - 170.22
Sell at 171.72 📉
🎯 Target 1 - 170.32
🎯 Target 2 - 168.1
🛑 Seller SL - 174.58
Analysis:
Natural Gas's 27 Feb Fut levels suggest a buying opportunity at 173.08, aiming for targets of 177.48 and 179.7. Consider adding one lot at 172.4. On the selling side, 171.72 may lead to targets of 170.32 and 168.1. Exercise caution and adjust strategies based on market dynamics.
#NaturalGasAnalysis #FuturesTrading #CommodityMarket #GasFutures #DayTrading #MarketOutlook #TechnicalAnalysis #ProfitableTrading #CommodityAlerts #FinancialMarkets

Crude Oil MCX Feb Future Analysis for Today 3 Feb for Options
📊 Crude Oil - 17 Feb Fut Analysis 📈
Crude Oil 17 Feb Fut Levels : 📅 Day Range - 221 Point
Buy at 6115.58 🚀
🎯 Target 1 - 6166.58
🎯 Target 2 - 6251
➕ Add one lot at 6089.5
🛑 Buyer SL - 6053.42
Sell at 6063.42 📉
🎯 Target 1 - 5893.42
🎯 Target 2 - 5809
🛑 Seller SL - 6125.58
Analysis:
Crude Oil's 17 Feb Fut levels propose a buying opportunity at 6115.58, aiming for targets of 6166.58 and 6251. Consider adding one lot at 6089.5. On the selling side, 6063.42 may lead to targets of 5893.42 and 5809. Exercise caution and adjust strategies based on market dynamics.
#CrudeOilAnalysis #FuturesTrading #CommodityMarket #OilFutures #DayTrading #MarketOutlook #TechnicalAnalysis #ProfitableTrading #CommodityAlerts #FinancialMarkets

MCX Silver Complex Big PictureIn the last trading session, silver has gained +361 points. As we updated in previous newsletters, silver is flying with gold. Silver wings may cutoff after breaking out 60,000 levels and may fall till a hit of control price line. Hence, this breakout will lead the prices 59,000 to 58,000 . Don’t forget to keep your eyes peeled at 5 MA (orange).
Currently silver is running above 61K. As per this 4-hourly chart, we can expect continuous uptrend for the levels of 62,000 – 63,360 – 65,000+ . It could keep pushing upward until a crossover of 5 MA and 2 0 MA (blue). Further information I will update shortly.

Crude Short Sell LevelThe chart has the key level marked out. 85.70 will be a great level to short the commodity. The trend remains down though we have now reached a support and also the oscillators are oversold which will lead to some mean reversion. So best to wait for the level to be reached on the bounce and then short sell the commodity.

Upcoming Features on Dhan - AMJ 2023Hello Everyone,
Firstly, we hope all of you are doing well and are excited about Investing & Trading for the new Financial Year 2023-24. We are excited for the coming times, and with you, we continue to ensure that Dhan gets better every day.
For our incredible user experience and awesome customer service that Dhan is focussed on, the start of 2023 has been exciting for all of us. Jan, Feb, and March of 2023 have been great months as we continue to see the highest number of Traders & Investors on Dhan across all our platforms. We continue to build and ship things that matter to Traders & Investors and as always, your feedback, suggestions, and support help us build Dhan for you.
We continue with our tradition of building Dhan with our users - Super Traders and Long Term investors. Here is the list of things that we are building now and expect to launch in AMJ 2023.
1. Strategy Builder and Pre-Built Strategies for Commodity & Currency Traders
Dhan continues to witness a surge in commodity and currency traders - in the past month Commodity trades have grown > 10X and Currency trades have grown > 5X on Dhan. We doubled our commodity trades and traders in the last month, one of the reasons for this growth has been the incredible commodity trading experience we provide for Commodities 5, and we aim to take that further with the most requested feature by Commodity Traders on Dhan - Custom Strategy Builder and Pre-Built Strategies in Commodity and Currency Segment. This will be first made available on the Options Trader on the Web platform.
2. Mutual Fund Investments on Dhan
We have been working on this for a very long and are glad to inform our users that Mutual Fund Investments will soon be made available in private beta. We have finished building over 80% of this product and now are in the last phase of development where we are ensuring we provide a seamless and best-in-class experience for our users. Dhan will offer zero-commission Direct Mutual Funds to its users and at launch will be feature packed with everything that you could expect from a Mutual Fund investing platform.
3. Option Trading on TradingView.com
Many traders prefer to do their studies, analysis, research, indicators and signals on TradingView which is one of our favorite products as well. Dhan lets users trade directly from TradingView.com 2 and also is the only Stock Trading platform in India that provides Free Webhooks for Order Execution 9. While Options data is not available on TradingView, we are working towards making Options Trading super simple for our Super Traders. While we are behind schedule on this, we will soon launch Webhooks as a newer Order type, making it super simpler for our users to trade in Options (and any segment) directly based on your studies on TradingView. This will be launched on the Dhan Web platform. PS: Also in case you missed it, TradingView has awarded Dhan as one of the most Reliable Technology Brokers 5 across the world… Yay!
4. Trade Directly from TradingView Apps (iOS and Android)
Dhan is the first stockbroking platform in India to enable direct trading on TradingView.com 2 with its Connect through Trade Panel, later we extended this functionality to the TradingView app on iOS and very soon will be made available on TradingView’s Android App as well. Over 38,000 Super Traders on Dhan 1 have now connected their Dhan account with TradingView - all of them will soon be able to trade from their TradingView apps as well.
5. Trading Notes on Dhan
Trading may be easy, but making money from trading is not! We have interacted with many disciplined traders and based on our interactions have enhanced the journey of Super Traders on Dhan with Trader’s Diary 2 and Trader Controls 2. Very soon, we will introduce Trading Notes - where you will be able to add simple notes to every trade you make. Your Trading Notes will also be visible in your Trader’s Diary and Past Trades. Be a better & disciplined trader and manage your Risk while trading, only with Dhan!
6. Flash Trader on Dhan Web
Option Buyers already love using the Flash Trader 12 that we recently introduced on the Dhan app. We intend to extend this feature on Dhan Web as well, and eventually also bring this to Options Trader App and Web. Flash Trader helps traders quickly discover and trade in contracts that have the Highest Volumes, Highest Open Interest, and also are At-The-Money (ATM) on both Bullish or Bearish views.
7. Unified Login across all Web Platforms
Dhan currently operates three different web platforms - Dhan Web (web.dhan.co), TradingView console on Dhan (tv.dhan.co 2) and Options Trader Web (ot.dhan.co 6). We noticed that there is a significant overlap between users on our web platforms, and to make it further seamless and convenient for our users we will introduce a Unified Login across all Web Platforms.
8. Updating Primary Bank Account
In our priorities for the year 2023 we mentioned that we want to ensure all requests our Traders and Investors have should be made digital. With that thought process, we earlier introduced updating of Email Address, Mobile Number 2 and Nominations online 1, continuing with the same in this quarter we plan to introduce the functionality to Update Primary Bank Account as well to Dhan.
9. Glass Version: Options Trader App
We introduced our first release for 2023 - Dhan App Glass Version 18 and our Super Traders and Investors simply love it. We now aim to extend the same incredible Glass experience to Options Trader app and along with that also bring new features and capabilities to the Options Trader app 3. We will speak in detail more when we launch this - Option Traders would love this!
10. Enhanced Option Chain on Dhan
Option Traders love the real-time Option Chain experience 3 on Dhan and we have continued to improve the experience over the period with feedback and suggestions from our users. We also extended it across all platforms, including bringing an Advanced Option Chain 7 and also integrating it directly on Dhan’s TradingView console 5. We will introduce an enhanced version of Options Chain soon, which will be lighter, and faster and along with highlight some incredible insights for you on the Options Chain itself.
11. Enhanced Referral Experience on Dhan
One of the key reasons we are able to grow every month is simple - Word of Mouth. We speak with many of our users and know that they were introduced to Dhan by their friends and family. That aside, we have an incredible Referral program where our users get 20% of all brokerage generated by their friends whom they refer to Dhan - this is for a lifetime and users can withdraw the referral reward directly to their Bank Account! We recently introduced QR for fast & easy referral to Dhan, and we are working to make the overall Referral experience even better than today.
12. Delivery Volumes for Stocks
Over the past few months, we are witnessing more and more Intraday Trades in the Cash segment along with positional Swing Traders, many of whom today are using the Margin Trading Facility where Dhan offers up to 4X margin benefit on up to 950+ stocks. For short-term traders, Dhan does provide Technicals along with Technical Orders and more recently launched Forever Orders on Equity 1 enabled on top of DDPI 2 - another first one in the Stock Broking industry from Dhan. We are now considering enabling delivery volumes for such short-term traders and investors to track delivery v/s intraday trading volumes across all stocks.
13. Upcoming Corporate Actions
We introduced Corporate Actions 1 sometime back and it is already a very popular feature on Dhan along with Dividend Tracking 2 for Investors and Real-Time News 2. Some of our users had requested for introducing upcoming Corporate Actions and we expect to bring this on Dhan in a few weeks. We believe this should benefit a lot of Investors as well as Swing Traders on Dhan.
14. Market Feeds APIs
We know we are running behind schedule on this and there is a reason for the same - we want the Market Feeds APIs to be super fast. We internally are in the final stages of testing a new broadcast system that is visibly faster than the existing one on Dhan also what industry standards are. Dhan’s SuperFast Trading APIs are now consumed by over 500+ API-based traders for order execution, and also by 50+ partners including the likes of TradingView, Smallcase, Tata Capital, GoCharting, and many more. We will introduce Market Feed APIs for all API-based traders and Algo Traders in our suite of Dhan HQ SuperFast Trading APIs 3.
15. Updated Baskets Experience
It’s been a while since Dhan introduced Baskets across all our platforms - App, Web, and TradingView. With newer enhancements to our web platform (web.dhan.co) and deeper integrations on our Options Trader on the web platform (ot.dhan.co 6) - we have noticed an uptick in the usage of Baskets on Dhan. We aim to simplify the baskets experience from the existing ones and post that introduce more capabilities for Traders.
16. Statements Previews on the App & Web
Over the past few months, we have introduced multiple enhancements across Dhan to improve all statements experience - this includes the recent Quicko integration for tax filing 2, the introduction of Trader’s Diary 2 as Journal, and more. We continue to work further on this, and also introduce statement previews on App & Web in the coming weeks - this will be over and above the email-based statements we presently have on Dhan.
17. Scaling our Systems and Underlying Tech & Infrastructure
In the past year, Dhan has grown > 25X times in terms of transactions processed and 2X in just the past 45 days. We now have over 500+ API-based traders who are trading directly on top of DhanHQ SuperFast Trading APIs, and large traders who are executing over 100+ trades/day and some even doing over 1000+ trades/day. Our DhanHQ Super-fast trading APIs are consumed by over 50+ partners in multiple domains - a few of the partners are featured here. To support this scale and growth, we are changing the way our systems (Apps and Web Trading platforms) are handling and processing these large orders & high volume trades and at the same time - also ensuring our underlying APIs and technology infrastructure are scaling up to seamlessly process everything at a lightning-fast speed.
Is that all - definitely no! There is more that is happening under the radar at Dhan and all of us are working towards ensuring we bring to you Lightning-Fast Investing & Trading experience every day and at all times.
Keep Investing & Trading on Dhan, and help us build an incredible platform for you.
Thank you,
Pravin Jadhav
Founder & CEO - Dhan

HindalcoLet's analyze **Hindalco Industries Ltd.** from both a **fundamental** and **technical** perspective.
### **Fundamental Analysis of Hindalco Industries Ltd.**
#### **Overview of Hindalco Industries Ltd.**
- **Sector:** Metals, Mining, Aluminium, Copper
- **Industry:** Aluminium, Copper, and Metal Products
- **Founded:** 1958
- **Headquarters:** Mumbai, Maharashtra, India
- **Market Cap:** Approx. ₹90,000 crore (as per the latest data)
**Hindalco Industries Ltd.**, a part of the **Aditya Birla Group**, is one of the largest manufacturers of aluminium and copper products in India. The company is a leading player in the metal sector, with a diverse product portfolio, including aluminium sheets, foil, wire rods, copper cathodes, and more.
Hindalco operates through two primary business segments:
- **Aluminium:** Including alumina refining, primary aluminium production, rolling, and extrusions.
- **Copper:** Includes copper cathodes and related products, which are widely used in electrical, industrial, and telecommunications applications.
#### **Key Financials (Latest Report)**
- **Revenue Growth:** Hindalco has seen consistent revenue growth driven by strong demand in both aluminium and copper products. The company benefits from robust demand in the infrastructure, automotive, and electrical industries.
- **Profitability:** Hindalco's profitability is relatively stable, benefiting from economies of scale, a diversified product portfolio, and integrated operations. The company has maintained solid operating margins.
- **Debt Levels:** Hindalco has a manageable debt load, though it operates in a capital-intensive sector. The company has demonstrated a consistent ability to service debt, supported by strong cash flows from operations.
- **Cash Flow & Dividend Yield:** Hindalco generates strong operational cash flow, allowing it to fund capital expenditures, debt servicing, and pay consistent dividends to shareholders.
#### **Valuation Ratios**
- **P/E Ratio:** Hindalco's P/E ratio is typically lower than that of high-growth sectors, reflecting its cyclical nature. However, its stable growth in aluminium and copper makes it a defensive play in the metals sector.
- **P/B Ratio:** The P/B ratio is moderate, reflecting Hindalco’s substantial asset base in aluminium and copper production. This ratio tends to track closely with the company’s earnings growth and commodity prices.
- **Dividend Yield:** Hindalco is known for paying consistent and healthy dividends, which is attractive for long-term investors seeking income alongside capital appreciation.
#### **Industry & Macro Trends**
- **Global Aluminium and Copper Demand:** The demand for aluminium and copper is tied to global economic growth, particularly in infrastructure, automotive, and construction sectors. Hindalco benefits from rising global demand for lightweight materials like aluminium.
- **Commodity Prices:** Hindalco’s margins are highly sensitive to fluctuations in the prices of aluminium, copper, and energy. The prices of these commodities are volatile and can impact profitability, especially in periods of global supply disruptions or changes in demand.
- **Government Regulations and Policies:** Being in the metals sector, Hindalco is impacted by government policies related to environmental regulations, mining rights, and pricing regulations for raw materials.
- **Competition:** Hindalco competes with global players such as **Norsk Hydro**, **Rio Tinto**, and **Vedanta** in aluminium and copper. Domestic competitors include **National Aluminium Company (NALCO)** and **Vedanta Limited**.
---
### **Technical Analysis of Hindalco Industries Ltd.**
Let’s evaluate the **technical outlook** of Hindalco based on its stock price patterns, momentum indicators, and key levels:
#### **Price Action:**
- **Current Price:** Hindalco has experienced volatility over time, reflecting both global commodity price trends and company-specific events. The stock could move in line with broader metal sector trends.
#### **Key Levels:**
- **Support Levels:**
- **₹430-₹450:** This support level has historically been an important area where Hindalco’s stock tends to find buying interest. A fall below this zone could signal further downside risk.
- **₹400-₹420:** If the stock pulls back, this level could provide another level of support, especially during market corrections or commodity price pullbacks.
- **Resistance Levels:**
- **₹500-₹520:** This range is a significant resistance zone for Hindalco. A breakout above this level would signal strong bullish momentum, especially if accompanied by high volume.
- **₹550:** This is another key resistance level. A break above ₹550 could signal that the stock is entering a new bullish phase and could lead to further upside.
#### **Moving Averages:**
- **50-Day Moving Average (50-MA):** If Hindalco is trading above its 50-day moving average, it is considered to be in a short-term uptrend. A cross below the 50-day MA would indicate a potential shift to a bearish phase.
- **200-Day Moving Average (200-MA):** The 200-day moving average is a strong indicator of the long-term trend. A stock trading above this level signals long-term bullishness, while a fall below this would indicate a bearish trend.
#### **Momentum Indicators:**
- **RSI (Relative Strength Index):**
- An RSI above 70 would suggest that Hindalco might be overbought and due for a pullback.
- An RSI below 30 indicates the stock may be oversold and could be due for a reversal or consolidation.
- **MACD (Moving Average Convergence Divergence):**
- A positive MACD (when the MACD line crosses above the signal line) would suggest upward momentum.
- A negative MACD (when the MACD line crosses below the signal line) would indicate weakening momentum or potential reversal to the downside.
#### **Volume Analysis:**
- **Volume Trends:** Rising volume during price increases suggests strong buying interest and can confirm a bullish trend. Similarly, decreasing volume during price drops could indicate that selling pressure is subsiding.
- **Volume Spikes:** A large spike in volume at key support or resistance levels (₹450, ₹500) could signal a breakout or breakdown, depending on the direction of the price move.
---
### **Conclusion:**
- **Fundamental Strengths:**
- Hindalco Industries is a dominant player in the global aluminium and copper markets with strong fundamentals, including a solid revenue base, good profitability, and strong cash flow.
- The company is well-positioned to benefit from the growing demand for aluminium, driven by sectors like automotive, infrastructure, and electrical.
- Despite the cyclical nature of the metals industry, Hindalco’s diversified business and strong management enable it to weather volatility and continue to generate value for shareholders.
- **Technical Outlook:**
- **Support levels:** ₹430-₹450 (primary), ₹400-₹420 (secondary).
- **Resistance levels:** ₹500-₹520 (primary), ₹550 (psychological resistance).
- The stock is likely to follow the global trends in aluminium and copper prices. Keep an eye on the breakout above resistance levels for further upward momentum.
#### **Risks to Consider:**
- **Commodity Price Volatility:** Hindalco’s performance is closely tied to fluctuations in aluminium and copper prices. Global economic conditions and supply-demand imbalances in metals can significantly impact profitability.
- **Geopolitical Risks:** Trade tariffs, sanctions, and other geopolitical factors can impact the prices and supply of raw materials, potentially affecting Hindalco’s margins.
---
**Disclaimer:**
The information provided is for educational purposes only and should not be construed as financial or investment advice. I am not a SEBI-registered advisor, and this analysis is not a recommendation to buy, sell, or hold any securities. Accuracy and timeliness of the data cannot be guaranteed. Always conduct your own research or consult with a professional before making investment decisions. I do not take responsibility for any losses incurred.

CADJPY Positional View as JPY bring neutral JAPANESE YEN STILL BE NEUTRAL
Dollar Index (DXY) Roars Back to Life as Safe Haven Demand Grows Due to the Conflict in the Middle East.
Fed Officials Say that Higher Yields Are a Positive in the Fight Against Inflation.
Developments in the Middle East and Federal Reserve Policymakers Will Drive Price Action in the Week Ahead.
The Canadian dollar's rise against the US dollar above key resistance points to further gains on improving risk appetite amid resilient global growth, signs of a turnaround in commodity prices, and hopes of more stimulus from China.
Commodity prices (using the Bloomberg Commodity Total Return Index) rebounded sharply in the week ended June 16, while the Bloomberg Industrial Metals index appears to have found a floor. The rebound in commodity prices has aided commodity-sensitive currencies, including the Canadian dollar, the Australian dollar, and the New Zealand dollar.
Moreover, the raising of the US debt ceiling, fading stress in the banking/financial sector, resilience in global growth, and hopes that global interest rates are peaking have boosted investor confidence in risk-sensitive assets, especially technology stocks.

What is money?Namaste!
Money has a different meaning, to different kind of humans.
For normal human beings: a commodity for survival (means to buy food, shelter, clothing, cure to deceases, etc.).
For ambitious human beings: money is a commodity to fulfill ambitions, goals, desires, desire to be great, desire to stand aside in a socio-economic status, etc.
For human beings who study finance, economics: it is a "medium of exchange", key aspect of modern day economy, a motivation to move a human being or his thoughts from point A to point B, etc.
For human beings who study philosophy:
a pursuit of happiness, a drug which sometimes tricks the mind to achieve unnecessary ambitions by any means possible, etc.
For human beings who study computer science and data: it is a number made by binary codes (0,1), which can be printed by respective authorities with the use of computers, a journey towards infinity with the addition of each digit on the right side, etc.
For human beings who don't have friends and family: a patch to fix loneliness in life, a purpose to live, a replacement to actual human beings with the help of mobile phones, gadgets, other material things, etc.
For human beings in scarcity of money: a first desire to be met, with a lot of desires waiting once it is met, a commodity worth doing hustle today, to achieve fruits in future, a commodity to provide relief to parents who worked very hard for it, to raise us, etc.
For human beings in abundance of money: a treasure to guard and protect from intangible (inflation) and tangible (competitor human beings), a responsibility and commitment, so that it does not file divorce papers :), etc.
For human beings like saints: an illusion of value, a sin if used against any animal including humans, a boon if used for the good of every animal, etc.
For mother nature: a non-living tangible form like other forms of matter, or just an intangible electrical signal which flips 0 to 1 or 1 to 0, etc.
For all animals except human beings: a paper which I cannot eat with a photo I cannot recognize, a bank balance I cannot check because I don't know how to use a computer, a commodity which could result in my killing for consumption, etc.
Money is a vague term only limited to perception and understanding.

Long ( Continuation pattern ) Hi flocks ,
Let me explain one interesting fact about this kind of segments , Many are not aware how this kind of segment moves in the equity/derivatives
Commodity backed scrip behave almost alike a commodity segments in the Metals and Minerals , Commodity can never make an progressing impulsive movement like how
other segments of equity do , so the scrips usually end up in side way correction , the logic is commodity like steel , copper , nickel the price variation can not be aggressive
due to its merchandise value , they can not run in the prices and can become monopoly so in order to remain in the market consumption these metals remain at best prices
the same is true for equity backed by such metal industries , equity of such company mostly follow the price of commodity market ,
So expect the prices to move up and as analyst its my responsibility to explain basic concept here , not only reading price moves
One can look for daily reversal in order to jump on it and its going up my friends
Good luck

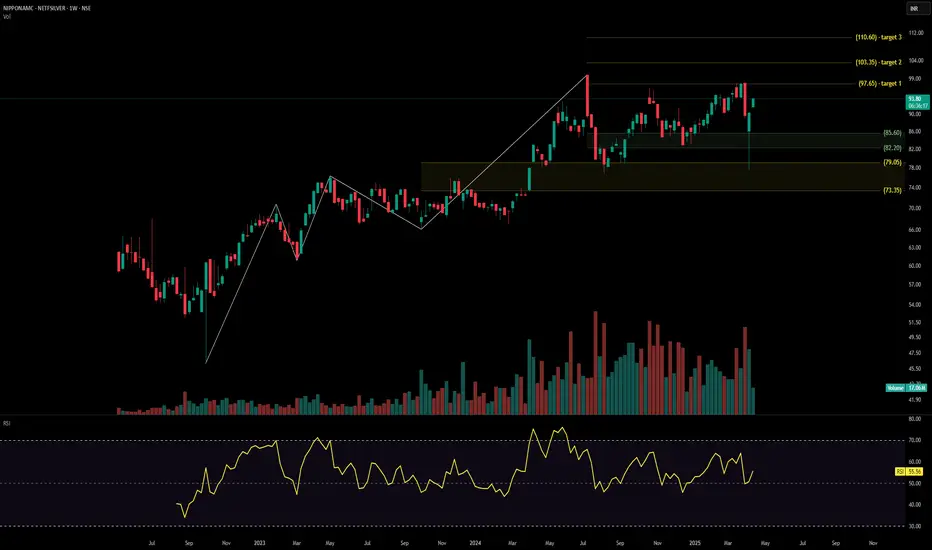
SILVERBEES ETF technical analysis Stock Overview: NIPPONAMC - NETFSILVER, listed on the Indian exchange, is currently priced at ₹93.80. This stock represents the Nippon India Silver ETF, which tracks the performance of silver, offering investors a commodity-linked investment avenue.
Key Levels:
Support Levels: ₹85.60, ₹82.20, ₹79.05, and ₹73.35.
Upside Swing Zone: ₹97.65 and ₹103.35.
Possible Upside Levels: ₹110.60.
Technical Indicators:
RSI (Relative Strength Index): Currently at 55.56, indicating that the stock is in a neutral momentum zone, neither overbought nor oversold. This suggests a balanced trading sentiment, with potential to move either way depending on market cues.
Volume: The stock shows a trading volume of 17.06 million, reflective of moderate investor activity. Consistent or spiking volumes could provide clues for trend continuation or reversal.
Sector and Market Context: The ETF's performance is closely tied to silver prices, which are influenced by global demand-supply dynamics, currency fluctuations, and macroeconomic factors. Within the broader commodity sector, silver has shown resilience amidst fluctuating market conditions, benefiting from its dual demand as both an industrial and precious metal. In the Indian market context, commodity-linked instruments like silver ETFs are gaining traction as investors diversify their portfolios.
Risk Considerations: Potential risks include high volatility in silver prices driven by geopolitical tensions, global economic uncertainty, and changes in industrial demand. Additionally, fluctuations in the Indian Rupee against major global currencies could affect returns. Adverse regulatory changes or taxation policies impacting commodity ETFs may also play a role.
Analysis Summary: NIPPONAMC - NETFSILVER offers an intriguing opportunity for investors seeking exposure to silver. The technical indicators suggest neutrality, allowing room for further analysis based on market and sector trends. Investors should remain vigilant about external factors like economic data, currency movements, and geopolitical developments that could influence silver prices and, consequently, the ETF’s performance.
NationAlumLet's analyze **National Aluminium Company Ltd. (NALCO)** from both a **fundamental** and **technical** perspective.
### **Fundamental Analysis of National Aluminium Company Ltd. (NALCO)**
#### **Overview of National Aluminium Company Ltd. (NALCO)**
- **Sector:** Metals
- **Industry:** Aluminium and Metal Products
- **Founded:** 1981
- **Headquarters:** Bhubaneswar, Odisha, India
- **Market Cap:** Approx. ₹25,000 crore (as per the latest data)
**National Aluminium Company Ltd. (NALCO)** is one of the largest integrated aluminium producers in India. The company operates in the production of **bauxite, alumina**, and **aluminium** products. NALCO is a Government of India Enterprise, and it is one of the top players in the aluminium industry in India, with a well-established production capacity.
NALCO's operations span:
- **Bauxite Mining:** The company has one of the largest bauxite reserves in the world.
- **Alumina Refining:** NALCO operates one of the largest alumina refineries in the country.
- **Aluminium Production:** It manufactures primary aluminium and downstream products, such as billets, wire rods, and rolled products.
#### **Key Financials (Latest Report)**
- **Revenue Growth:** NALCO has demonstrated consistent revenue growth over the years, supported by increasing demand for aluminium across various sectors, including automotive, infrastructure, and construction.
- **Profitability:** NALCO’s profit margins are relatively healthy, benefiting from its integrated operations (from mining to aluminium production). However, the company’s margins can fluctuate based on global aluminium prices and raw material costs.
- **Debt Levels:** NALCO has historically maintained low to moderate levels of debt, which provides it financial stability. The company has strong cash flows to support its operations and debt servicing.
- **Cash Flow & Dividend Yield:** The company generates healthy operational cash flows and has a strong dividend track record. The government ownership aspect means the company is committed to maintaining a regular dividend payout.
#### **Valuation Ratios**
- **P/E Ratio:** NALCO’s P/E ratio is generally in line with the metals sector, reflecting its stable earnings and government backing. Being a public sector enterprise, its valuation tends to be slightly lower compared to privately held counterparts.
- **P/B Ratio:** The P/B ratio of NALCO is moderate, reflecting its robust balance sheet, driven by a solid asset base in bauxite reserves and aluminium production.
- **Dividend Yield:** NALCO is known for its strong dividend payouts, with the dividend yield being attractive to investors seeking steady income alongside capital appreciation.
#### **Industry & Macro Trends**
- **Aluminium Demand:** The demand for aluminium is driven by sectors like automotive, construction, packaging, and electrical industries. With rising global demand for lightweight materials and sustainable products, NALCO stands to benefit from growth in these sectors.
- **Commodity Prices:** The prices of aluminium and bauxite can fluctuate based on global supply-demand dynamics, and NALCO’s margins are sensitive to commodity price movements. Any significant drop in aluminium prices may affect profitability in the short term.
- **Government Policies:** NALCO, being a state-owned enterprise, is subject to Indian government policies related to subsidies, regulations, and pricing controls. Government initiatives to boost the domestic manufacturing of aluminium products could support demand.
- **Global Competition:** NALCO competes with other large aluminium producers like **Hindalco Industries**, **Vedanta Limited**, and global players like **China’s Chalco**. The competition also includes regional producers of bauxite and alumina.
---
### **Technical Analysis of National Aluminium Company Ltd. (NALCO)**
Let's look at the **technical outlook** of NALCO, focusing on key support and resistance levels, moving averages, and momentum indicators.
#### **Price Action:**
- **Current Price:** NALCO’s stock tends to follow global trends in aluminium and metal prices. It has shown long-term uptrends during periods of rising commodity prices and pullbacks during market corrections.
#### **Key Levels:**
- **Support Levels:**
- **₹75-₹80:** This level has served as a strong support zone for NALCO in the past. A pullback towards this range could present a potential buying opportunity if the stock shows signs of stabilizing.
- **₹70:** This is a secondary support level in case of a more significant correction in the stock.
- **Resistance Levels:**
- **₹90-₹95:** This is a significant resistance zone. If NALCO breaks above this level with strong volume, it could signal a potential uptrend and more upside.
- **₹100:** This is a psychological resistance level, and a breakout above ₹100 could signal a potential rally.
#### **Moving Averages:**
- **50-Day Moving Average (50-MA):** If the stock is trading above the 50-day moving average, it indicates a short-term uptrend. A break below this level could suggest short-term bearishness.
- **200-Day Moving Average (200-MA):** The 200-day moving average is a key indicator of the long-term trend. NALCO is considered in a bullish phase if trading above the 200-MA, but below it could indicate a long-term downtrend.
#### **Momentum Indicators:**
- **RSI (Relative Strength Index):**
- An RSI above 70 indicates that NALCO may be overbought, and a pullback could be imminent.
- An RSI below 30 suggests that the stock may be oversold and could be due for a potential reversal or recovery.
- **MACD (Moving Average Convergence Divergence):**
- A positive MACD crossover (MACD line crossing above the signal line) would indicate bullish momentum.
- A negative MACD crossover would suggest a weakening trend or potential bearishness.
#### **Volume Analysis:**
- **Volume Trends:** Rising volume accompanying price increases can confirm the strength of an uptrend, while increasing volume during price declines could indicate strong selling interest.
- **Volume Spikes:** Watch for volume spikes near key levels such as ₹90-₹95 or ₹100. A breakout or breakdown accompanied by high volume often signifies the beginning of a new trend.
---
### **Conclusion:**
- **Fundamental Strengths:**
- NALCO has strong fundamentals with a focus on integrated aluminium production, a solid balance sheet, and a consistent record of profitability.
- As a state-owned entity, it enjoys stability and government backing but may face limitations in terms of strategic flexibility.
- The company benefits from strong demand in the aluminium sector, supported by growth in infrastructure, automotive, and electrical industries.
- **Technical Outlook:**
- **Support levels:** ₹75-₹80 (primary), ₹70 (secondary).
- **Resistance levels:** ₹90-₹95 (primary), ₹100 (psychological resistance).
- NALCO's stock is likely to follow the broader trends in the metals sector. A breakout above resistance levels can signal an upward trend, while a break below support levels may signal a deeper correction.
#### **Risks to Consider:**
- **Commodity Price Fluctuations:** NALCO’s margins are highly dependent on aluminium and bauxite prices, and any significant price volatility could impact profitability.
- **Regulatory Risks:** Changes in government policies related to aluminium pricing or subsidies could influence the company's earnings and cash flows.
- **Global Competition:** NALCO faces competition from other domestic and international aluminium producers, which may affect market share and pricing power.
---
**Disclaimer:**
The information provided is for educational purposes only and should not be construed as financial or investment advice. I am not a SEBI-registered advisor, and this analysis is not a recommendation to buy, sell, or hold any securities. Accuracy and timeliness of the data cannot be guaranteed. Always conduct your own research or consult with a professional before making investment decisions. I do not take responsibility for any losses incurred.

Sardaen stock for watchLet's dive into the analysis of **Sarda Energy & Minerals Ltd.** (often referred to as **Sarda Energy**), which is a leading player in the Indian steel industry, focusing on both production and power generation.
### **Fundamental Analysis of Sarda Energy & Minerals Ltd.**
#### **Overview of Sarda Energy & Minerals Ltd.**
- **Sector:** Steel, Mining, Power Generation
- **Industry:** Steel, Iron & Steel Products, Power
- **Founded:** 1973 by Mr. Sushil Sarda
- **Headquarters:** Raipur, Chhattisgarh, India
- **Market Cap:** Approx. ₹5,000-6,000 crore (as per the latest data)
Sarda Energy & Minerals Ltd. (SEML) is a diversified company involved in manufacturing steel, ferro alloys, power generation, and mining. It is known for its integrated steel plant in Chhattisgarh, and the company also focuses on power generation through its captive power plants.
#### **Key Financials (Latest Report)**
- **Revenue Growth:** The company has shown steady revenue growth due to its integrated business model, which combines steel production, power generation, and mining. The demand for steel and other products has generally been stable, contributing to this growth.
- **Profitability:** Sarda Energy has shown solid profitability, driven by its strong operational efficiency and backward integration into mining. The company has also benefited from the higher demand for steel and ferro alloys in domestic and export markets.
- **Debt Levels:** The company has moderate debt levels, which are typical in the capital-intensive steel industry. However, it has shown an ability to manage its debt efficiently, with its operational cash flows supporting its debt servicing.
- **Return Ratios:** The return on equity (RoE) and return on capital employed (RoCE) ratios of Sarda Energy have generally been above industry averages, indicating efficient use of shareholder capital.
#### **Valuation Ratios**
- **P/E Ratio:** Sarda Energy's P/E ratio can fluctuate based on commodity price cycles, but it is typically in line with other steel companies of similar size and market positioning.
- **P/B Ratio:** Sarda Energy has a P/B ratio that reflects its strong asset base, driven by its mining and power generation assets. The company’s stock is likely to be valued higher due to its integrated nature and diversified revenue streams.
- **Debt-to-Equity Ratio:** As a capital-intensive sector, the company’s debt-to-equity ratio is typical of the steel industry. However, it’s crucial to watch this ratio in relation to its ability to generate consistent cash flows.
#### **Industry & Macro Trends**
- **Steel Sector Growth:** The Indian steel sector has shown steady growth in the past decade, driven by infrastructure development, urbanization, and government spending on projects. Sarda Energy, with its strong domestic presence, stands to benefit from these trends.
- **Ferro Alloy and Mining Demand:** Demand for ferro alloys and minerals (mainly manganese and iron ore) has been rising, driven by the steel and energy sectors. Sarda Energy’s backward integration into mining gives it a cost advantage and ensures supply stability.
- **Government Policy:** Initiatives like "Make in India" and infrastructure development programs by the government continue to drive demand for steel products. Additionally, policies like anti-dumping duties on imported steel could help domestic producers like Sarda Energy.
- **Commodity Price Fluctuations:** Steel and ferro alloy prices are subject to global commodity price fluctuations. While demand is growing, prices can be volatile, impacting margins.
---
### **Technical Analysis of Sarda Energy & Minerals Ltd.**
Let's look at potential technical levels and patterns for **Sarda Energy & Minerals Ltd.**, assuming the stock is being analyzed:
#### **Price Action:**
- **Current Price:** The stock price of Sarda Energy would reflect its financial performance, steel demand trends, and broader market sentiment. If the stock price is consolidating in a range, it may indicate indecision among investors.
#### **Key Levels:**
- **Support Levels:**
- **₹300-₹320:** This is an important support level where the stock might find buying interest. A breach below this level could suggest further downside risk.
- **₹280-₹290:** If the stock falls to this level, it would likely test another critical support. A bounce from here could signal a buying opportunity.
- **Resistance Levels:**
- **₹380-₹400:** A resistance level for Sarda Energy. If the stock breaks above this level with strong volume, it could suggest further upward momentum.
- **₹420-₹440:** This is another significant resistance zone where selling pressure may build. If the stock moves above this zone, it could target higher levels.
#### **Moving Averages:**
- **50-Day Moving Average (50-MA):** A close above the 50-day moving average would indicate short-term bullishness, while trading below it could suggest a bearish trend.
- **200-Day Moving Average (200-MA):** The 200-day moving average is a key indicator of the long-term trend. If the stock is trading above it, it suggests long-term strength.
#### **Momentum Indicators:**
- **RSI (Relative Strength Index):**
- If the RSI is above 70, the stock could be overbought, signaling a potential pullback.
- If the RSI is below 30, the stock could be oversold and may see a price reversal or consolidation.
- **MACD (Moving Average Convergence Divergence):**
- A bullish signal occurs when the MACD line crosses above the signal line. A bearish crossover (MACD line crossing below the signal line) would indicate a potential downtrend.
#### **Volume Analysis:**
- **Volume Trends:** Rising volume along with price increases is a bullish signal, indicating strong buying interest. Conversely, increasing volume during price declines can suggest that selling pressure is dominant.
- **Volume Spikes:** A large volume spike near key support or resistance levels can signify a potential breakout or breakdown.
---
### **Conclusion:**
- **Fundamental Strengths:**
- Sarda Energy & Minerals Ltd. has a strong position in the Indian steel, mining, and power sectors, benefiting from vertical integration, solid financial management, and a diversified revenue base.
- Its focus on high-margin products like ferro alloys and its ability to manage its debt levels provide a competitive edge in the industry.
- **Technical Outlook:**
- Support levels around ₹300-₹320 and resistance near ₹380-₹400 should be closely watched. A breakout above ₹400 could signal bullish momentum.
- The stock's 50-day and 200-day moving averages will give insight into short-term and long-term trends, while RSI and MACD will help gauge market sentiment and potential price movements.
#### **Risks to Consider:**
- **Commodity Price Volatility:** Sarda Energy’s profitability is tied to the price of steel and ferro alloys, which can be volatile.
- **Debt and Capital Intensive Nature:** The company’s capital structure and debt levels need to be monitored closely, especially if there’s a downturn in the steel market.
---
**Disclaimer:**
The information provided is for educational purposes only and should not be construed as financial or investment advice. I am not a SEBI-registered advisor, and this analysis is not a recommendation to buy, sell, or hold any securities. Accuracy and timeliness of the data cannot be guaranteed. Always conduct your own research or consult with a professional before making investment decisions. I do not take responsibility for any losses incurred.

NIFTY 50: Comprehensive Analysis, Key Drivers,and FutureOutlooK?Chart Analysis: NIFTY 50
Key Levels of Interest
Support Zone (Highlighted in Green):
Range: 23,200–23,500
The chart shows a strong demand zone where buyers have historically stepped in. This area has acted as a reliable support, preventing further downside in the past.
Resistance Levels:
Immediate Resistance: 24,200–24,400 (Purple line)
Price has been struggling to break above this level, indicating a significant selling pressure.
Major Resistance: 25,550
Represented as a key level for a potential bullish breakout.
Trendline Analysis
The blue descending trendline highlights the pattern of lower highs, confirming a downward trend.
Unless price breaks above the trendline, the overall sentiment remains bearish.
Moving Averages
50-Day SMA (Purple Line): The price is trading below this level, signaling short-term weakness.
200-Day SMA (Yellow Line): The long-term moving average suggests bearish momentum as prices are below this too.
Candlestick Patterns
Recent candles show long lower wicks, which suggest some buying interest near the support zone.
Lack of large green candles indicates weak follow-through on buying attempts.
Volume Analysis
The volume bars are tapering off, showing a lack of strong participation in the current consolidation phase.
An uptick in volume near either resistance or support could signal the next significant move.
Indicators on Chart
RSI (Relative Strength Index): Though not displayed directly on the chart, you can infer it from the general price action. The price is likely near an oversold level, hinting at a potential bounce.
SuperTrend Indicator:
Currently bearish, indicating selling pressure dominates.
Short-Term Bias
Neutral to Bearish: While the price is consolidating in a range, it leans toward bearish due to:
Rejection near resistance.
Trading below both moving averages.
A downward-sloping trendline.
Scenarios Based on the Chart
Bullish Scenario
Breakout Above 24,400:
This resistance must be broken with strong volumes to indicate bullish momentum.
The next target would be 25,550, followed by potential higher highs.
Watch for large green candles and high volumes to confirm strength.
Bearish Scenario
Breakdown Below 23,200:
A fall below the support zone could accelerate selling, bringing prices to 22,800 or even lower.
This would signal continuation of the prevailing bearish trend.
Neutral Range
As long as prices remain between 23,200 and 24,400, the NIFTY 50 is likely to consolidate without a clear direction.
Short-term traders can exploit this range for quick trades, while long-term players might wait for a decisive move.
Next Steps for Traders Based on Chart
Aggressive Traders:
Look for breakouts or breakdowns near the trendline and support/resistance zones.
Conservative Traders:
Wait for confirmation (volume and candlestick patterns) before taking positions.
Use of Stop Loss:
For bullish trades, stop loss should be placed below 23,200.
For bearish trades, stop loss should be above 24,400.
What is NIFTY 50?
The NIFTY 50 is India’s flagship stock market index, representing the top 50 companies listed on the National Stock Exchange (NSE). It serves as a benchmark for the performance of the Indian stock market. These 50 companies are selected based on market capitalization and liquidity, spanning 13 sectors, including financials, IT, energy, and FMCG.
Growth of NIFTY 50
Historical Growth:
The NIFTY 50 started in 1996 with a base value of 1,000.
Over the years, it has become a barometer of India's economic progress, reflecting the performance of top blue-chip companies.
Long-Term Drivers of Growth:
Economic Expansion: India’s GDP growth has been a key factor.
Reforms and Policies: Initiatives like GST, Make in India, and privatization of PSUs have boosted the market.
Foreign Investments: FII/FDI inflows, due to India being a high-growth emerging market, have supported the index’s growth.
Sectoral Growth: IT, banking, and consumer goods have consistently driven the index higher.
Key Milestones:
2008: Crash during the global financial crisis.
2014: Bull run after stable government formation.
2020-2021: Sharp recovery post-COVID-19, driven by tech and healthcare sectors.
Factors Affecting NIFTY 50
Economic Factors
GDP Growth: Positive GDP growth supports the index as companies earn more.
Inflation: High inflation can reduce consumer purchasing power and hurt corporate profits.
Interest Rates: Higher interest rates discourage borrowing and investing, pressuring the index.
Global Events
US Federal Reserve Policies: Fed rate hikes impact global liquidity and foreign investments in Indian markets.
Geopolitical Tensions: Events like the Russia-Ukraine conflict can increase uncertainty, leading to volatility.
Commodity Prices: Rising oil and commodity prices hurt India due to its reliance on imports, especially crude oil.
Domestic News
Earnings Reports: Quarterly performance of heavyweight companies impacts the index.
Budget Announcements: Policies favoring infrastructure, manufacturing, or tax cuts can uplift sentiment.
Rupee Movement: A weak rupee can impact sectors like IT positively but hurt import-heavy sectors.
Sectoral Performance
Banking and IT have the highest weightage, making them critical to the index’s movement.
A strong rally in FMCG or Energy sectors can also significantly push the index.
Comprehensive News Analysis
Bullish News
Lower Crude Oil Prices: Reduces import bills and benefits the economy.
Strong FII Inflows: Sign of growing foreign investor confidence.
Favorable Budget Policies: Tax cuts, incentives for sectors like manufacturing, EVs, and infrastructure can push the index higher.
Bearish News
Recession Fears: Global recession concerns can lead to foreign outflows.
High Inflation: Persistently high inflation can weigh on corporate profits and valuations.
Rate Hikes: Further rate hikes by the RBI or US Fed may trigger selling pressure.
Future Outlook: Scenarios
Bullish Case
Support Zone Holds: If the price stays above 23,200 and breaks above the resistance at 24,400, it would signal bullish momentum.
Catalysts:
Stabilizing global macroeconomics.
Strong earnings by large-cap companies.
Infrastructure and manufacturing-led growth supported by government spending.
Targets:
Immediate Target: 25,550.
Long-Term Target: 27,000 (new highs, provided favorable conditions persist).
Bearish Case
Support Breaks at 23,200: A breakdown would open the door to further selling, with targets around 22,800 or lower.
Catalysts:
Weak global cues, like rising bond yields or geopolitical tensions.
Negative earnings surprises or downgrades of key constituents.
Targets:
Immediate Target: 22,500.
Long-Term Target: Below 22,000 (in case of broader market corrections).
Key Takeaways for Traders
Monitor Key Levels:
Support: 23,200.
Resistance: 24,400.
Follow the Trendline: Watch for breaks or bounces off the descending trendline for clarity.
Watch Sectoral Trends: Banking and IT are crucial due to their high weightage.
News Catalysts: Follow FII data, crude oil prices, and quarterly earnings for short-term moves.
Actionable Trading Strategies
Bullish Strategy
Buy Entry: Above 24,400 with strong volumes.
Target: 25,550 and higher.
Stop Loss: Below 24,000 to minimize risk.
Bearish Strategy
Sell Entry: Below 23,200 with volume confirmation.
Target: 22,500 or lower.
Stop Loss: Above 23,600 to protect against reversals.
Comprehensive Analysis of NIFTY 50
What is NIFTY 50?
The NIFTY 50 is India’s flagship stock market index, representing the top 50 companies listed on the National Stock Exchange (NSE). It serves as a benchmark for the performance of the Indian stock market. These 50 companies are selected based on market capitalization and liquidity, spanning 13 sectors, including financials, IT, energy, and FMCG.
Growth of NIFTY 50
Historical Growth:
The NIFTY 50 started in 1996 with a base value of 1,000.
Over the years, it has become a barometer of India's economic progress, reflecting the performance of top blue-chip companies.
Long-Term Drivers of Growth:
Economic Expansion: India’s GDP growth has been a key factor.
Reforms and Policies: Initiatives like GST, Make in India, and privatization of PSUs have boosted the market.
Foreign Investments: FII/FDI inflows, due to India being a high-growth emerging market, have supported the index’s growth.
Sectoral Growth: IT, banking, and consumer goods have consistently driven the index higher.
Key Milestones:
2008: Crash during the global financial crisis.
2014: Bull run after stable government formation.
2020-2021: Sharp recovery post-COVID-19, driven by tech and healthcare sectors.
Factors Affecting NIFTY 50
Economic Factors
GDP Growth: Positive GDP growth supports the index as companies earn more.
Inflation: High inflation can reduce consumer purchasing power and hurt corporate profits.
Interest Rates: Higher interest rates discourage borrowing and investing, pressuring the index.
Global Events
US Federal Reserve Policies: Fed rate hikes impact global liquidity and foreign investments in Indian markets.
Geopolitical Tensions: Events like the Russia-Ukraine conflict can increase uncertainty, leading to volatility.
Commodity Prices: Rising oil and commodity prices hurt India due to its reliance on imports, especially crude oil.
Domestic News
Earnings Reports: Quarterly performance of heavyweight companies impacts the index.
Budget Announcements: Policies favoring infrastructure, manufacturing, or tax cuts can uplift sentiment.
Rupee Movement: A weak rupee can impact sectors like IT positively but hurt import-heavy sectors.
Sectoral Performance
Banking and IT have the highest weightage, making them critical to the index’s movement.
A strong rally in FMCG or Energy sectors can also significantly push the index.
Technical Chart Analysis
The NIFTY 50 is currently in a descending triangle pattern, with key support levels and resistance zones as follows:
Support Levels:
Immediate support: 23,200 (green demand zone).
A break below this level could lead to further downside to 22,500 or lower.
Resistance Levels:
Immediate resistance: 24,400 (upper trendline of descending triangle).
A breakout above this could signal a bullish trend reversal.
Trendlines and Moving Averages:
The 200-day moving average (yellow line) provides long-term support around 23,700.
The 50-day moving average (purple line) acts as a short-term resistance.
Volume Analysis:
Higher volumes near support zones indicate potential accumulation.
Declining volumes near resistance suggest indecision.
Comprehensive News Analysis
Bullish News
Lower Crude Oil Prices: Reduces import bills and benefits the economy.
Strong FII Inflows: Sign of growing foreign investor confidence.
Favorable Budget Policies: Tax cuts, incentives for sectors like manufacturing, EVs, and infrastructure can push the index higher.
Bearish News
Recession Fears: Global recession concerns can lead to foreign outflows.
High Inflation: Persistently high inflation can weigh on corporate profits and valuations.
Rate Hikes: Further rate hikes by the RBI or US Fed may trigger selling pressure.
Future Outlook: Scenarios
Bullish Case
Support Zone Holds: If the price stays above 23,200 and breaks above the resistance at 24,400, it would signal bullish momentum.
Catalysts:
Stabilizing global macroeconomics.
Strong earnings by large-cap companies.
Infrastructure and manufacturing-led growth supported by government spending.
Targets:
Immediate Target: 25,550.
Long-Term Target: 27,000 (new highs, provided favorable conditions persist).
Bearish Case
Support Breaks at 23,200: A breakdown would open the door to further selling, with targets around 22,800 or lower.
Catalysts:
Weak global cues, like rising bond yields or geopolitical tensions.
Negative earnings surprises or downgrades of key constituents.
Targets:
Immediate Target: 22,500.
Long-Term Target: Below 22,000 (in case of broader market corrections).
Actionable Trading Strategies
Bullish Strategy
Buy Entry: Above 24,400 with strong volumes.
Target: 25,550 and higher.
Stop Loss: Below 24,000 to minimize risk.
Bearish Strategy
Sell Entry: Below 23,200 with volume confirmation.
Target: 22,500 or lower.
Stop Loss: Above 23,600 to protect against reversals.
Disclaimer
This analysis is for educational and informational purposes only and should not be considered as financial or investment advice. Trading and investing in the stock market carry risks, and past performance is not indicative of future results. Always conduct your own research or consult with a certified financial advisor before making any investment decisions.

Base metalsBase Metal Technical Report, 30/06/2023 : BEST COMMODITY
30 Jun 10:17 BEST COMMODITY
Technical Outlook
The daily technical chart for Copper futures is forming a "Megaphone Pattern", where copper is facing heat, and in the last session it shredded 0.75%, where it closed at 704.95, it giving expectation of bearish movement if 700 is breached, which is the strong support for the commodity, where it is broken we may see 690 levels, and in the last session, it touched a high of 706.90, hence we may see a range of 700-710 in the upcoming session, meanwhile, for the current session the resistance is at 709 and key support is at 698.
Research Report Call
Buy if able to sustain above 707 targets 710-711, keeping an SL of 705. sell if it breaks 702, for targets 700-698, keeping an SL of 703.
Technical Outlook
Zinc Futures in the last session was flat and closed at 211.20, where it has been correcting from the last couple of sessions, in the range of 207-213, where it is taking support at 210, and zinc is technically forming a "Falling Wedge", where the contracting demands are hindering the gains, and it in the last session gave a range of 211.85-210.25, where it might try to move in the range of 210-213 levels in the upcoming sessions, for the current session zinc's key resistance, is placed at 213.55 and key support is placed at 208.50.
Research Report Call
Sell if it breaks 210 below, then sell for targets 209-207 keeping an SL of 211.20, and buy if it sustains above 212 for targets 213-215 keeping a trail SL of 211.
As Reported By BEST COMMODITY

New Zealand dollar slide continuesThe New Zealand dollar has recorded losses for a third straight day. In the European session, NZD/USD is trading at 0.7212, down 0.33% on the day.
The ANZ Commodity Price Index climbed 1.3% in May, marking an eighth consecutive rise. The index rose to a record level, as commodity prices rose in all major categories. The rise in commodities this year is in sharp contrast to 2020, when the Covid pandemic caused a sharp downturn in the global economy. This was reflected in a sharp fall in commodity prices, as the Commodity Price Index recorded declines throughout most of 2020.
As Covid rates fall, major economies have been reopening, and improving economic conditions have led to speculation that central banks may respond by tightening policy. The Bank of Canada recently tapered its QE programme and the Reserve Bank of New Zealand surprised the markets last week when it signalled the potential of a rate hike in the second half of 2022. If the RBNZ continues to send a hawkish message to the markets, we can expect the New Zealand dollar to gain ground.
This week's key event is the US nonfarm payroll release for May on Friday (12:30 GMT). The market is projecting a strong release, with a consensus of 664 thousand. If the upcoming release is within expectations, it would indicate a significant acceleration from the April reading of 266 thousand. The April release was a massive miss, as the forecast stood at 966 thousand. Investors can be expected to be cautious ahead of the release. If the nonfarm payroll release is as strong as expected, we could see a breakout in the forex markets on Friday.
Investors will also be keeping an eye on wage growth, which could put a damper on the NFP party. Average Hourly Earnings is projected to slow to 0.2% in May, after a sharp gain of 0.7% previously.
There is resistance at 0.7777 and 0.7846. On the downside, we have support at 0.7658 and 0.7608
