SOLANA AT FIVE: The High-Speed Blockchain Revolutionizing Crypto📢 SOLANA AT FIVE: The High-Speed Blockchain Revolutionizing Crypto Transactions
What is Solana?
#Solana is a high-performance blockchain designed for speed, scalability, and ultra-low fees. It supports DeFi, NFTs, and Web3 applications with an impressive 65,000 transactions per second (TPS) at almost zero cost!
📌 Founded by: Anatoly Yakovenko
📌 Launched in: March 2020
📌 Market Position: Among the Top 10 Crypto's
Top 3 Highlights of Solana
✅ Ultra-Fast Transactions: Solana’s unique PoH + PoS hybrid model enoS hybrid model ensures high-speed processing.
✅ Low Transaction Fees: Sub-penny costs make it more affordable than Ethereum.
✅ Growing Ecosystem: Used in DeFi, NFT marketplaces, and GameFi, attracting global investors and developers.
How Does Solana Work?
🔹 Proof of History (PoH): A cryptographic clock that timestamps transactions, reducing validation time.
🔹 Delegated Proof of Stake (dPoS): Users stake SOL tokens to secure the network and earn rewards.
🔹 Sealevel: Allows parallel smart contract execallel smart contract execution for improved efficiency.
🔹 Turbine & Gulf Stream: Optimized data transfer and transaction propagation.
Why Use Solana?
✔ Speed: 65,000 TPS vs. Ethereum’s 15 TPS
✔ Low Fees: $0.00025 per transaction
✔ Scalability: No need for Layer-2 solutions like Polygon or Arbitrum
✔ Eco-Friendly: Energy-efficient blockchain
✔ Developer-Friendly: Supports Rust & C++ SDKs
Solana vs Ethereum – Key Differences
▶️Feature | Solana | Ethereum
▶️TPS (Speed) | 65,000+ | ~15
▶️Transaction Fees | <$0.01 | $5-$50
▶️Consensus Mechanism | PoH + dPoS | PoS
▶️Smart Contracts | Rust, C++ | Solidity
▶️Scalability | Built-in (No L2 required) | Requires Layer-2
#Ethereum dominates DeFi & NFTs, but Soires Layer-2Ethereum dominates DeFi & NFTs, but Solana’s high-speed, low-cost model is attracting new projects & users.
Key Use Cases of Solana
🔹 Decentralized Finance (DeFi): Used in Serum, Raydium, Mango Markets
🔹 NFTs & Gaming: Magic Eden, Solanart, Star Atlas, Aurory leverage Solana’s low-cost transactions.
🔹 Smart Contracts & Web3: DAOs, Social Networks, Tokenization projects.
🔹 Crypto Payments: Solana Pay enableay enables instant, fee-less USDC payments, compe comp payments, competing with Visa.
Challenges of the Solana Network
⛔ Network Outages: Several disruptions in 2021-2024 raised concerns.
⛔ Centralization Risks: Fewer validators make it less decentralized than Ethereum.
⛔ Security Issues: Past incidents like the 2022 wallet exploit highlighted risks.
✅ Solution: Firedancer Client Upgrade is expected to enhance network stability.
Solana’s Recent Milestones & Price Performance
📌 2021: SOL hit $260 ATH in the bull run.
📌 2022: Dropped to $9 after FTX collapse.
📌 2023: Massive 1000% rebound, surpassing $100 again.
📌 2024: From $80 to $264 in one year. Visa integrates Solana for stablecoin payments.
📌 2025: New ATH of $295.83, then correction to $110. Over 105M active monthly users in January.
Is Solana a Good Investment?
✅ Pros:
✔ Strong Technical Foundation (PoH + PoS scal Foundation (PoH + PoS scalability)
✔ Growing Adoption & Developer Interest
✔ Institutional Support (Visa, Google Cloud)
✔Support (Visa, Google Cloud)
✔ Active & Expanding Community
❌ Cons:
⚠ Regulatory Uncertainty
⚠ Past Network Downtime Issues
⚠ Strong Competition from Ethereum & Other L1s
📢 Always do your own research before investing in any cryptocurrency.
Final Thoughts – The Future of Solana continues to push the boundaries of blockchain scalability with its ultra-fast transactions and low fees. With growing institutional adoption and ecosystem expansion, CRYPTOCAP:SOL has the potential to compete with Ethereum and beyond.
Search in ideas for "CRYPTO"

Crypto Market Update: Bitcoin Dominance & Altcoin SeasonCrypto Market Update: Bitcoin Dominance & Altcoin Season
- MIL:BTC Dominance: Bitcoin's market share is near a 3-year high. Remember, a rise in CRYPTOCAP:BTC.D means more market cap is going to Bitcoin instead of altcoins.
- Altcoin Opportunity: The best setup for altcoin growth is when MIL:BTC price rises but CRYPTOCAP:BTC.D falls. This means money is moving into altcoins.
- Market Status: Altcoins had a tough week, while Bitcoin was stable. If CRYPTOCAP:BTC.D hits 57-58%, get ready for a real altcoin season!
- Ready to Act? The perfect time for altcoins is coming. Stay updated and be prepared to move!

#Ethereum Is Down Now, But History Says a $10K Rally Is Coming…#Ethereum Is Down Now, But History Says a $10K Rally Is Coming…
1⃣ CRYPTOCAP:ETH rallied 228x post-2016 BTC halving
2⃣ ETH did 27x post-2020 halving
3⃣ Currently -57% from ATH post-2024 halving
📅 Projection: Q4 2025 ATH
🔼 Target Range: $7,000 - $10,000
Based on cyclical trend extension, Fibonacci macro structure, and historical BTC-ETH correlation.
What’s your ETH EOY 2025 target? RT & Comments if you Agree👇
#Altseason
Note: This is Not financial Advice so DYOR before Investing.

CRYPTO MARKET JUST LOST $1.25 TRILLION🚨 CRYPTO MARKET JUST LOST $1.25 TRILLION: THIS IS NOT NORMAL 🚨
In just 42 days since the Oct 6 top, the market has wiped out a massive -$1.25T, A -28% collapse from the $4.27T peak → $3T zone.
This $3T level is the final line before a full liquidity vacuum.
If it breaks, volatility turns violent. Stay sharp.
NFA & DYOR

Crypto Total Market cap ( Atcoins Boom hard soon )At the peak of this bull run, we expect the #crypto market cap to hit at least $10 trillion, with #Bitcoin reaching $150k-$180k.
Work hard in the coming months to maximize profits. Stay ready for major market movements and manage risks effectively.
The next year could be life-changing—stay dedicated and persistent.
Like/share if you Agree

Crypto - Weekly chart at SupportCrypto Weekly basis at support
RSI slightly positive...
Date: 23-09-2022

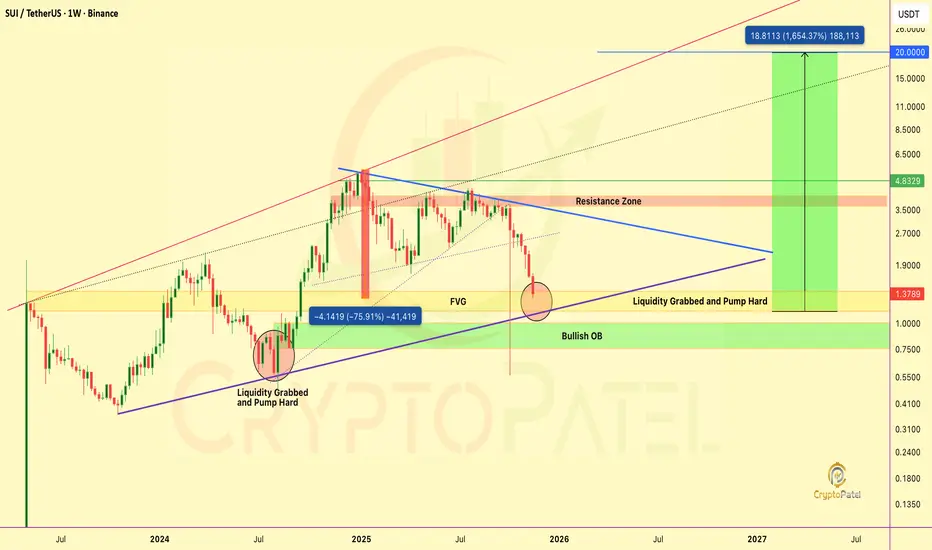
$SUI JUST ENTERED ITS DO-OR-DIE ZONE CRYPTOCAP:SUI JUST ENTERED ITS DO-OR-DIE ZONE AND THE WEEKLY CHART IS SCREAMING A REVERSAL SETUP
Everyone is panicking at the dump…
But nobody is seeing what actually happened on the HTF:
🔹 Massive Liquidity Grab Completed — identical to the 2024 bottom pattern.
🔹 Price nuked directly into FVG + Bullish Order Block.
🔹 Strong rejection wick = smart money accumulation confirmed.
🔹 Macro trendline STILL intact. Structure STILL bullish.
But let’s be Honest:
👉 Market condition is extremely worst right now.
👉 All altcoins dumped hard.
👉 CRYPTOCAP:SUI is –75% down from its Jan 2025 ATH… 10 months of pure bleeding.
Still, the chart is loading something big.
Here’s my IMO approach:
🔹 Accumulation Zone 1: $1.35 – $1.15
🔹 Accumulation Zone 2: $0.90 – $0.75
⭐ Don’t try to buy once.
⭐ No one knows the exact dip.
⭐ Smart way = accumulate slowly inside these zones.
Strong bounce potential sits exactly from the FVG → Bullish OB confluence.
If SUI breaks $4.8 resistance?
Targets: $5 → $10 → $20
IMO one day CRYPTOCAP:SUI will hit $20 easily.
But of course, Not financial advice. DYOR before investing.
$SUI Looks Super Bullish, But There’s a Catch!CRYPTOCAP:SUI Looks Super Bullish, But There’s a Catch!
SUI Network is heating up in this bull market, and yes — it could potentially reach $10… even $15–$20 long-term! 🔥
But here’s something you need to know 👇
🔓 Today, 44M CRYPTOCAP:SUI (~$143M) tokens got unlocked — that’s 1.32% of the circulating supply.
▶️ Only 33.87% of total supply is unlocked — meaning 66.13% is still locked with early investors and the team.
▶️ That’s ~$140M worth of tokens unlocking every month. This could put serious sell pressure on the price!
✅ I'm still bullish long-term, already holding from $0.50–$0.60.
▶️ If CRYPTOCAP:SUI drops to around $2.80, I’ll be buying more.
Short-term dip = Long-term opportunity?
Be smart. Track unlocks. Buy low. Think long.
NFA & DYOR

Why TONCOIN is Potential to hit $50?🚨 TON Is Silently Prepping for a Massive Bull Run — Are You In Yet?
While the market chases memecoins, TON is building real stuff — with real money, real users, and now even AI integration.
Here’s why TON could be the next CRYPTOCAP:SOL -like sleeper 👇
▶️ $1.5 Billion Raised via Bonds
Telegram raised $1.5B at a 9% yield — no token dump, no equity sale.
Just old-school bonds — and institutional giants like BlackRock & Citadel bought in.
This gives TON huge runway to:
✅ Build Infra
✅ Expand Ecosystem
✅ Onboard Millions of Users
▶️ TON x xAI (Elon Musk's Grok) 🤝
The TON Foundation just announced a partnership with xAI (Grok) — bringing AI-powered search and interaction inside Telegram.
Imagine Grok integrated with TON wallet, payments, and apps — AI + Blockchain + 900M users = Game changer.
This is real utility, not just another hype partnership.
▶️ Ex-Visa Exec Joins TON as VP of Payments
Nikola Plecas, who helped shape Visa’s crypto strategy, is now leading TON’s payment mission.
The goal? Bring crypto payments to the heart of Telegram’s global userbase.
Solana Pay & Lightning — watch your back 👀
▶️ Telegram Premium Hits 15M Paid Users
This isn’t just “users” — this is a monetized audience, ready for TON-powered payments, tipping, and apps.
TON isn’t building a user base — Telegram already has it.
▶️ TON Technical Analysis (TA)
We called the TON move at $2.50 — and it’s already 50% up!
Now it’s forming:
✅ Bullish Market Structure
✅ Higher Highs + Higher Lows
✅ Strong Bounced From demand zone
Next target short term? $5–$6
Bull Market Potential? $50–$70 easy, especially when altseason fully ignites 🔥
Why TON Could Be the Next Crypto Titan:
▪️ Backed by Telegram
▪️ Integrated into daily chat & apps
▪️ 900M+ users in waiting
▪️ AI partnership with Grok
▪️ Institutional money flowing in
▪️ Strategic hires and solid infra
TON is the dark horse of this bull market.
It doesn't shout. It ships.
Once TON wallets go live for all Telegram users...
Game over for most L1s.
Follow CryptoPatel for more early alpha before the herd wakes up.
And tell me — what’s YOUR price target for CRYPTOCAP:TON in this cycle? 👇
Note: This is Not Financial Advice so DYOR before investing.

ETH/BTC Technical Analysis UpdateETH/BTC Technical Analysis Update
▪️Bounced off green box support, indicating bullish momentum.
▪️ ETH/BTC Broken out on daily chart, positive for CRYPTOCAP:ETH and #Altcoins
▪️ CRYPTOCAP:BTC dominance declining, favorable for #AltSeason
Are you prepared for potential Altseason?

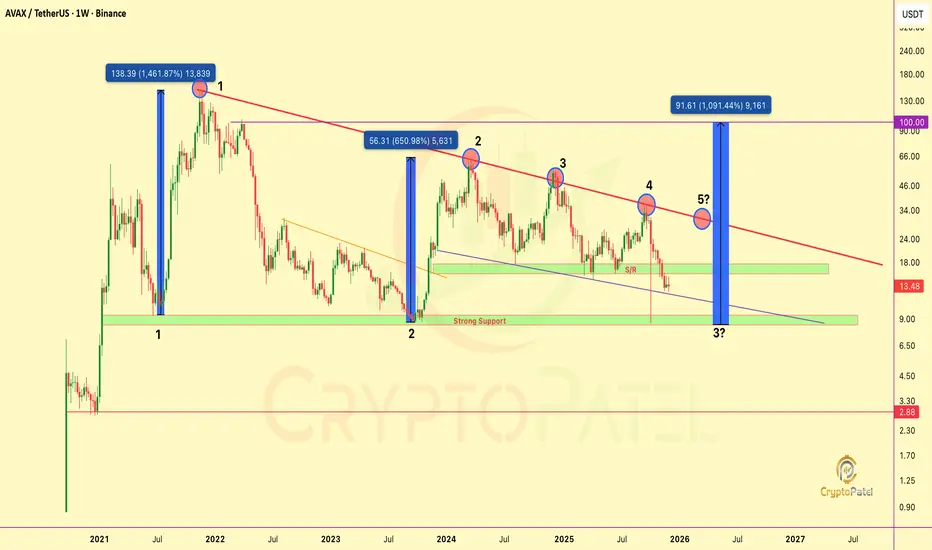
$AVAX on the Edge — $100 Breakout or $3 Crash?CRYPTOCAP:AVAX Is Approaching a Critical Technical Turning Point: Here’s What the Chart Really Shows
#AVAX is currently trading in a bearish market structure, but the chart is setting up for a major decision zone that could define its long-term trajectory.
Major Resistance Pressure Building
AVAX has tapped the Red trendline resistance 4 times, creating a historically strong barrier.
However, repeated tests have weakened the level, and the next approach, the 5th attempt near the $30 region, carries a significantly higher probability of a breakout.
A confirmed breakout here could shift momentum aggressively, opening the path toward the $100 zone.
Bearish Structure Still Dominant
Price has already lost key support and continues to trade below the $16–$17 zone, which has now flipped into resistance.
This is the first structure level bulls must reclaim to regain momentum.
High-Probability Accumulation Zone
The $10–$8 support zone remains the most critical area on the chart:
👉 June 2021: +1461% rally from this zone.
👉 September 2023: +650% rally within six months.
If AVAX revisits this zone again, it would represent the 3rd historical test, which has previously acted as a powerful accumulation region and could offer strong long-term upside potential.
Critical Breakdown Level
A loss of the $8 support would invalidate the bullish structure and expose AVAX to a potential freefall toward $3–$2, where no major historical support exists.
This is a pure technical-analysis view. Not financial advice. Always DYOR.
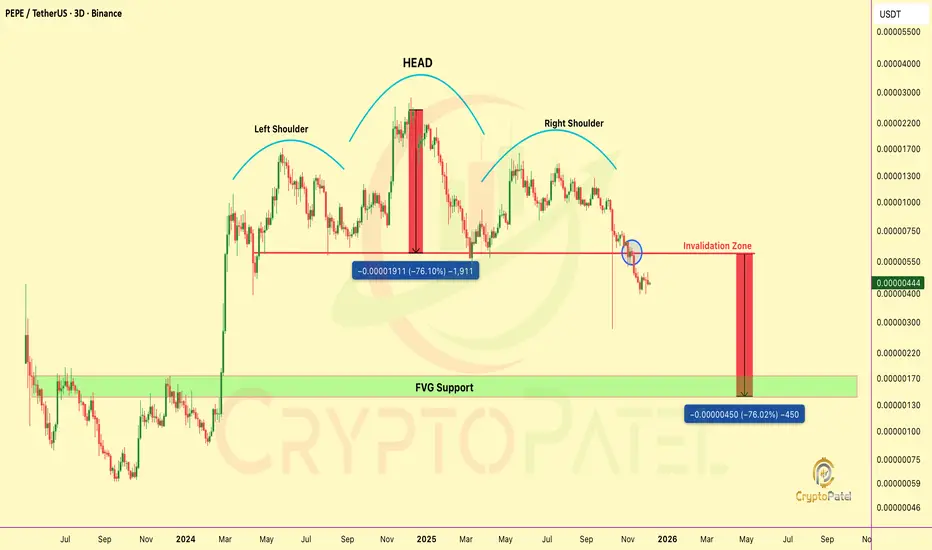
$PEPE TA Update: What PEPE Head & Shoulder Pattern Say?CRYPTOCAP:PEPE TA Update: What PEPE Head & Shoulder Pattern Say?
Head & Shoulders = Bearish
70% retracement possible ( Neck Line Support Broken )
Key Support $0.000006, Now Strong neckline support became strong resistance
Below NeckLine Support = 50-70% drop to $0.00000150
Hold & reclaim $0.000006 = bullish Reversal
NFA & DYOR
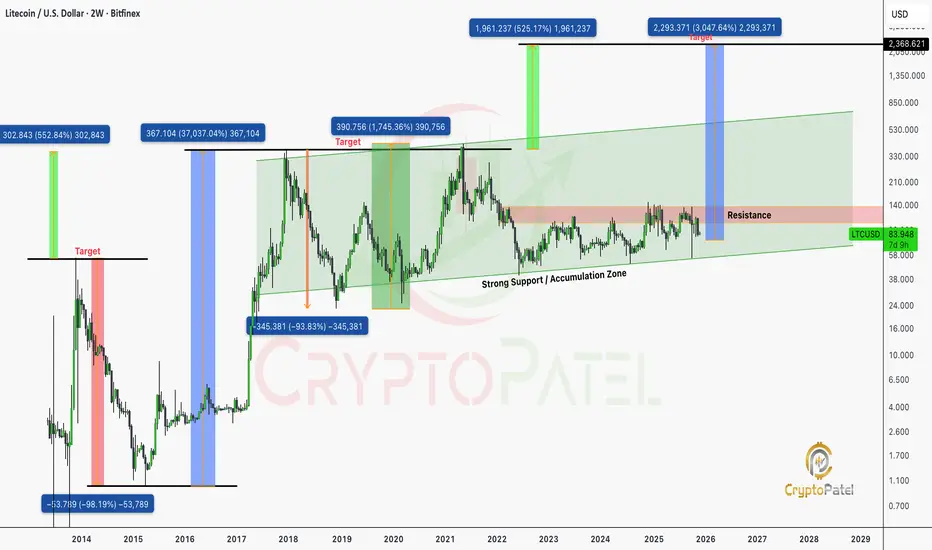
Is $LTC Dead? The Same Question Asked Before Every Major Rally…Is CRYPTOCAP:LTC Dead? The Same Question Asked Before Every Major Rally…
When markets forget history, they repeat it. Litecoin has gone through multiple full-cycle Retracements, Each time followed by explosive multi-X expansions. Let’s walk through the data:
🔰 2013–2015 Cycle: “LTC is Dead” #1
🔹 LTC hit an ATH of $55 from $1.
🔹 Retraced ~98%, bottoming at $0.985 within 16 months.
🔹 Retail sentiment: “LTC is dead.”
🔹 Smart money quietly accumulated.
Result?
$0.985 → $9 in 4 months (≈ +900%)
Eventually: $0.985 → $370 in 3 years (≈ +37,000%)
🔰 2017–2018 Cycle: “LTC is Dead” #2
🔹 New ATH: $370
🔹 Retracement: 92%, down to $23
🔹 Again: retail capitulation.
Result?
$23 → $146 in 6 months
$23 → $413 by May 2021 (≈ +1700%)
🔰 Current Market Structure (2021–2025)
🔹 Previous ATH: $413 (May 2021)
🔹 Current price: ~$84
🔹 Drawdown: 80%
Retail narrative: “LTC is dead.”
TA narrative: This is historically the accumulation zone.
Technical Outlook (Cycle-Based TA Projection)
Every prior deep-cycle retracement (80–98%) has led to:
🔹 Fresh multi-year impulse waves
🔹 New macro highs
🔹 Massive ROI expansion for accumulator wallets
Based strictly on historical cycle symmetry, volatility bands, and LTC’s halving-driven structure:
LTC Bull-Run Projection:
$600 – $1,000 is a reasonable and technically sound target range for the current macro cycle.
This would represent:
🔹 Breaking the 2021 high
🔹 Completing a full 5-wave macro structure
🔹 Returning to historical expansion ratios seen in every prior cycle
So You Already Know What Happens Next.
Litecoin’s entire history is built on max pain → max gain cycles.
Every 80–98% retracement has delivered its largest multi-X rallies after retail gave up.
Smart investors accumulate when the chart says accumulate, not when the crowd screams “dead.”
FINAL MESSAGE
LTC is not dead. It is in the same deep-value zone where every previous mega-cycle began.
If the market delivers another historical impulse, the $600–$1000 range remains a technically justified target.
Accumulate dips.
Ignore noise.
Let the chart speak.
Not Financial Advice so Always Do your Own Research Before Any Investments.
BITCOIN JUST DID EXACTLY WHAT WE DISCUSSED: CURRENT UPDATEBITCOIN JUST DID EXACTLY WHAT WE DISCUSSED: CURRENT UPDATE
CRYPTOCAP:BTC bounced perfectly from the 0.786 Fib ($83,308), The FINAL bullish support.
Now trading above $86,500, already +5–6% up from the exact level I alerted.
As long as BTC holds $83,308, upside relief rally remains active:
$88,000 (FVG)
$93,000 (Bearish OB)
$98,000 (FVG inefficiency)
But… if BTC loses $83,000, say hello to the $66,000 demand zone, The next real bullish orderflow.
For now: Structure is bullish above 0.786, cautious below it.
(NFA / DYOR)

Warning: $ETH Is About to Hit Its Most Critical Zone of 2025!Warning: CRYPTOCAP:ETH Is About to Hit Its Most Critical Zone of 2025!
Macro Structure
ETH remains macro bullish, currently in a healthy correction after rejecting the premium zone near $4,960.
The strong displacement from $1,577 (0.618 Fib) confirmed bullish structure, but price is now retracing into discount levels.
Key Fibonacci Levels
Measured from $879 → $4,960, ETH is deeply entering ICT discount territory:
0.382 – $3,048 (Tested)
0.500 – $2,622
0.618 – $2,256 ← Top probability zone
0.786 – $1,821
FVG & OB Zones (Major Decision Area)
1️⃣ Unfilled FVG → $2,875
👉 This is the most important decision point right now.
👉 High probability that ETH will fill this FVG.
👉 If price holds above this FVG, bullish continuation becomes very strong.
👉 If ETH fails to hold $2,875, expect the correction to deepen.
2️⃣ Next Major Support
Bullish OB: $2,622 – $2,256
→ Perfect confluence of Order Block + 0.5/0.618 Fib.
👉 This is the strongest demand zone on the entire chart and a top accumulation area.
Expectations
Most likely:
ETH fills the $2,875 FVG, then either bounces → resumes uptrend
or
breaks down → moves into $2,250–$2,620 OB to accumulate before the next macro leg.
Targets After Correction: $4,058 / $4,960 / $5,800 / $7,200 (1.618 extension)
Conclusion
ETH remains strongly bullish on HTF.
Watch $2,875 FVG as the key decision level.
If lost → $2,250–$2,620 OB becomes the premium accumulation zone before ETH heads toward new ATH.
NFA. DYOR.

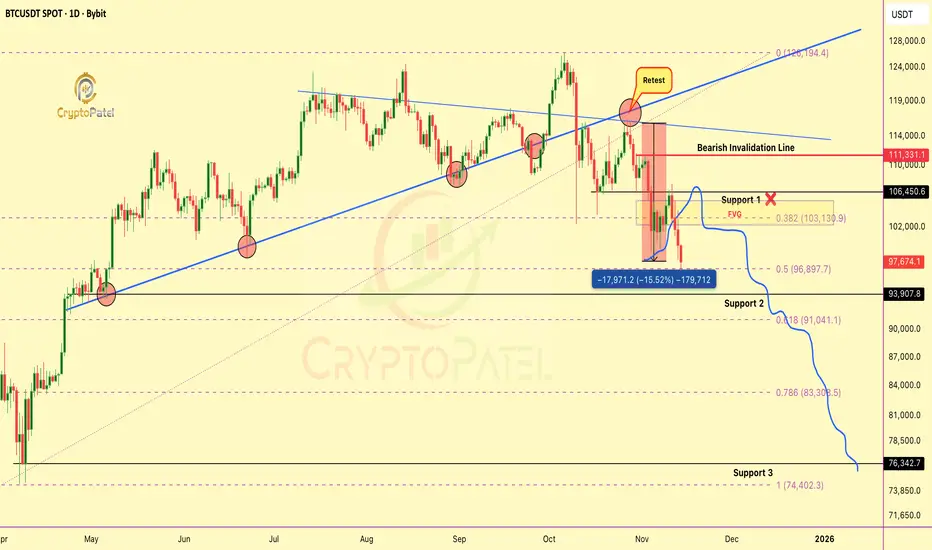
bearish retest I warned on Oct31 played out EXACTLY as projectedThe bearish retest I warned about on Oct 31 played out EXACTLY as projected
I clearly said CRYPTOCAP:BTC would dump again after filling the FVG at $106K–$107K and that’s exactly what happened.
BTC dropped from $107K → $98K (-9%) and from our retest entry, we’re now 15% in profit.
Hope you enjoyed the analysis and booked gains.
Now watch the 0.5–0.618 FIB zone closely.
✔️ If it holds → strong bounce possible
❌ If it fails → BTC could slide below $80K
I’ve been warning about this dump since BTC was above $120K+.
Structure always wins.
NFA & DYOR
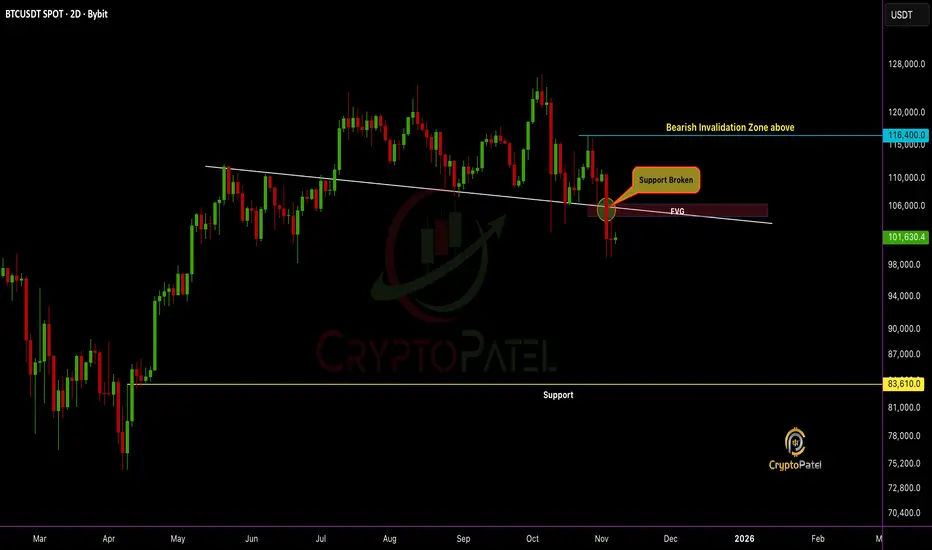
BTC Breakdown Confirmed, Structure Flipped Bearish: Next $88610?BTC Breakdown Confirmed, Structure Flipped Bearish: Next Stop $83,610?
Support is broken and the structure confirms a clear bearish shift.
#Bitcoin failed to reclaim the Fair Value Gap (FVG) zone, turning it into strong resistance.
High chances CRYPTOCAP:BTC could fill the FVG and continue the downside move toward $83,610.
Bulls remain trapped unless price reclaims $116,400, the bearish invalidation zone.
Trend bias remains bearish. Liquidity targets below are in play.
NFa & DYOR
BTC First Weekly BB Break Since March: This Changes EverythingFirst Weekly BB Break Since March: This Changes Everything!
Bitcoin is currently testing a key support zone around $104K, forming what appears to be the 5th major support retest in this ongoing bullish cycle.
Historical Pattern Insight:
Each of the previous four support retests (1–4) led to substantial rallies ranging from +70% to +200%, as shown in the green zones.
If the pattern repeats, the next potential upside move (Wave 5) could project CRYPTOCAP:BTC toward the $200K region, marking a ~100% upside from current levels.
New Technical Development:
This week marks Bitcoin’s first breach of the lower Bollinger Band (BB) on the weekly timeframe since March, signaling heightened volatility and potential exhaustion of the current corrective phase.
Bearish Scenario:
A confirmed breakdown below this critical support could trigger a deeper correction toward the $50K area (–55%), similar to previous cycle corrections highlighted in red.
Key Levels to Watch:
🔹 Support: $103K–$100K
🔹 Resistance: $110K, then $135K
🔹 Upside Target: $200K
🔹 Downside Risk: $50K
Indicators:
Bollinger Bands remain squeezed, indicating volatility expansion is near. The weekly mid-band continues to act as dynamic support, but a sustained close below it could shift the bias short-term.
🟩 Bullish Bias remains valid above $100K, invalidated only on a weekly close below support.
🟩 Pattern repetition or deviation here will define Bitcoin’s next macro leg.
NFA & DYOR

$LTC ACCUMULATION PHASE IS OVER: Ready to $500?🚨 CRYPTOCAP:LTC ACCUMULATION PHASE IS OVER 🚨
✅ Strong bounce from 7-YEAR trend line support
✅ Soon Break out 4-YEAR descending wedge
✅ Re-accumulation zone: COMPLETE
1️⃣ Target 1: $216 (+129%)
2️⃣ Target 2: $388 (+311%)
3️⃣ Target 3: $532 ALL-TIME HIGH (+464%)
👉 Last time this pattern played out = 1,596% PUMP
But yeah, keep buying at ATH 🤡
NFA & DYOR

BNB 400% up from our Entry People laughed when I said CRYPTOCAP:BNB will hit $2000–$3000.
but people still doubt my $2000–$3000 targets? 🤔
From 1st Entry of this bull run: +400% ( TP1 ✅ )
From $500 re-entry: +120%
You can doubt targets, but not momentum.
Just don’t forget — book profits.
Because trading without a safe zone = casino mode.
Not Financial Advice

Will Dogecoin hit $2 in Coming rally ?DOGE/USDT – Technical Analysis Update
CRYPTOCAP:DOGE is maintaining a solid structural support above the $0.150 key demand zone, with price action showing consistent defense of this level. As long as this zone remains protected on higher timeframes, bullish market structure remains intact for the current bull cycle and altseason.
Accumulation Zone: $0.230 – $0.180
This range aligns with prior demand imbalances and marks an optimal spot entry zone for long-term positioning.
A sustained hold and breakout from this accumulation range could open the path toward higher liquidity targets.
Upside Targets:
Target 1: $0.50 (mid-cycle resistance & liquidity pool)
Target 2: $1.00 (psychological level)
Target 3: $2.00 (macro cycle extension)
Bias: Bullish – Favoring spot accumulation within range
Invalidation: Daily close below $0.150 would shift bias to neutral/bearish
Price structure suggests CRYPTOCAP:DOGE is coiling for a high-momentum breakout once key liquidity levels are breached.
NFA & DYOR

$XRP just broke its all-time high: $3.66CRYPTOCAP:XRP just broke its all-time high: $3.66 — and this is just the beginning?
After years of waiting, XRP finally explodes past $2 and hits $3.66 this bull run. It’s not just a win for XRP holders — it’s a lesson in patience, conviction, and catching early setups before the hype.
Why it matters now:
🔹 While everyone’s chasing the latest meme coin, XRP silently did a clean 7x from $0.50.
🔹 Regulatory clarity is improving — XRP’s bullish narrative is finally unfolding.
🔹 Market rotation is real: old giants like XRP are moving again, and this signals strength in Layer 1 comeback plays.
Quick breakdown:
📌 First signal at $0.50 → 7x
📌 Second entry below $2 → already 2x
📌 Current price: $3.66 (ATH)
📌 Many ignored it, some mocked it — but price tells the truth.
Patience beats hype. Quality setups > chasing pumps.
Save-worthy takeaway:
If you ever feel FOMO, remember this:
The best trades aren’t loud. They’re early, quiet… and require conviction.
What’s your biggest “I told you so” moment in this bull run?👇
Let’s hear your favorite early calls — drop them in the replies!

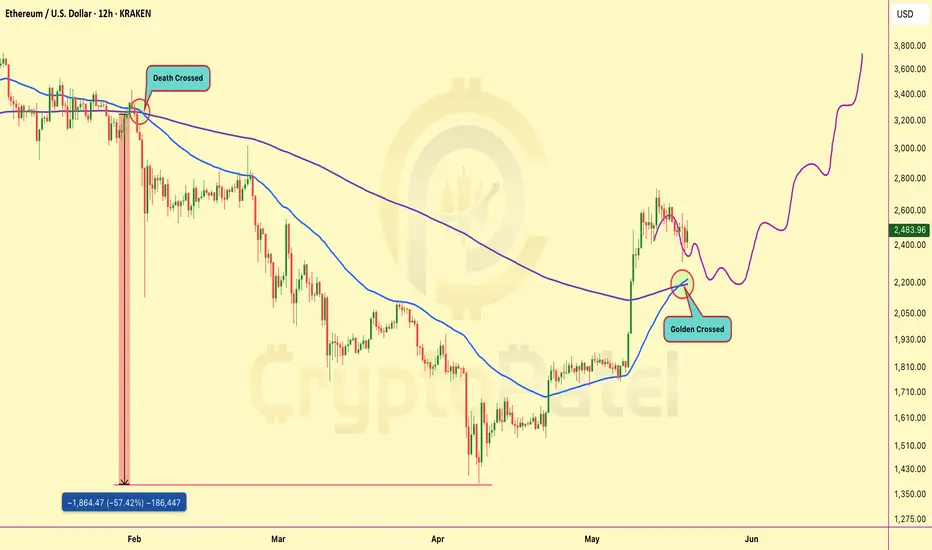
Ethereum Golden Crossed so What Next? $5000?🚨 CHART ALERT: CRYPTOCAP:ETH just flashed a GOLDEN CROSS on the 12H after months of bleeding!
Last time we saw a DEATH CROSS, #Ethereum crashed -57%.
Now it's doing the opposite — this could be the start of a massive pump! 🚀
TARGET? Maybe $3,800-$5000+ soon! 📈