$BTC Technical Breakdown – As Predicted!CRYPTOCAP:BTC Technical Breakdown – As Predicted!
I already warned you at $110K to exit or short — and guess what?
We’re now up with 8% profit from that exact call!
#Bitcoin broke structure with a Bearish Divergence, and the trendline is looking weak.
If this war doesn’t stop, I expect further downside below $100K.
Key levels to watch:
🔻 Support 1: $73,500
🔻 Support 2: $48,700
If $100K breaks, don’t be surprised to see $90K → $80K → even $70K.
Don’t say I didn’t alert you.
I clearly told you to short or exit at the top.
Booked profits? Let me know below 👇
Search in ideas for "CRYPTO"

$ETH BLOODBATH: -15% Dump! Next Stop $2100? CRYPTOCAP:ETH BLOODBATH: -15% Dump! Next Stop $2100?
I shorted right from $2862 — nailed the move.
Now trading below critical $2550 support.
👉 Hold $2550? Reversal towards $3000-$4000 possible.
👉 Lose it? We likely fill $2100-$2200 FVG — 0.618 fib at $2116.
$2860 remains THE level to watch for a New ATH.
💬 Comment your ETH target!
🔁 Retweet if this helps your gameplan.

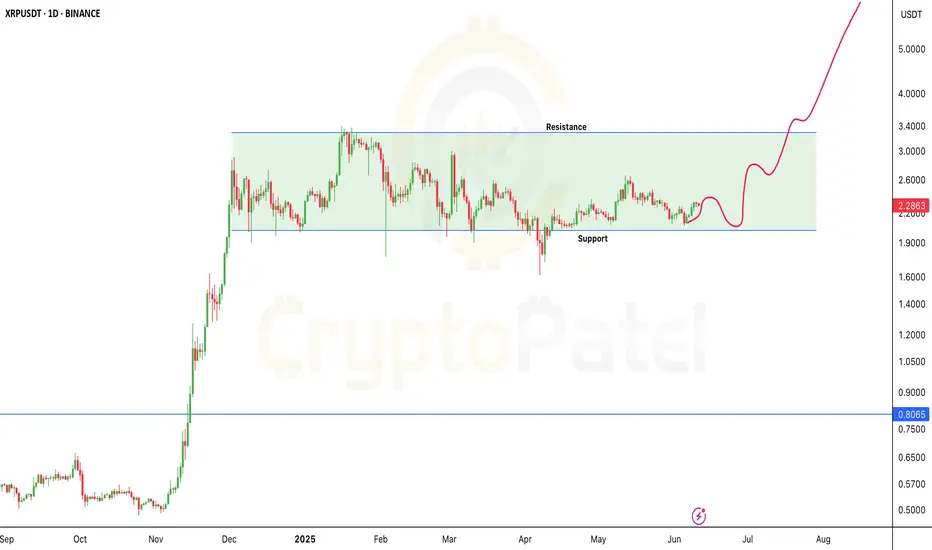
XRP Breakout Watch — Will June 16 Trigger a Bull Run?🚨 XRP Breakout Watch — Will June 16 Trigger a Bull Run? 🚨
CRYPTOCAP:XRP is holding above the key $2 support.
👉 A breakout above $2.65 → $3.00 is in play.
👉 Whale accumulation rising. Volume tightening.
👉 Ripple vs SEC ruling expected soon.
Targets if bullish: $3 → $8 → $13 🚀
Downside risk: Below $2 → $1.50 or lower.
Note: NFA & DYOR
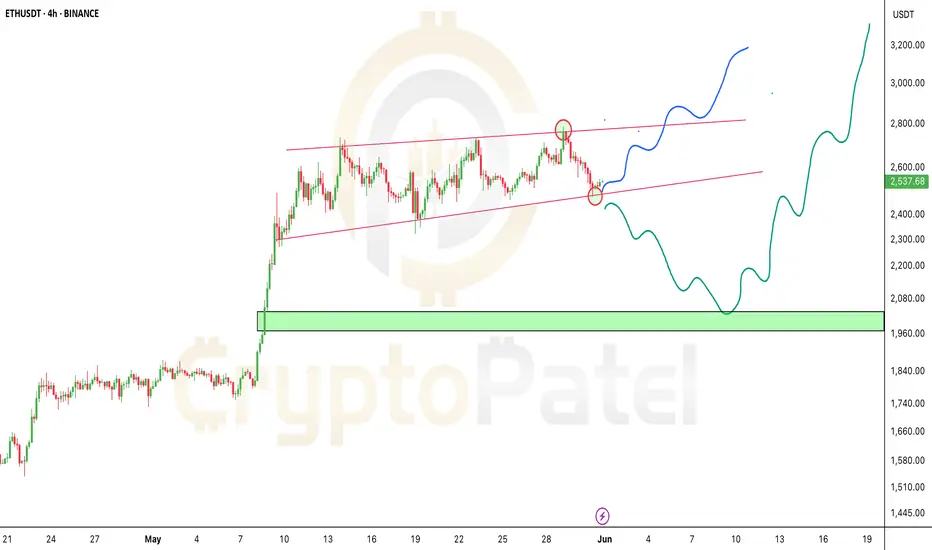
Ethereum Breakout UpdateETHEREUM AT A BREAKOUT POINT
CRYPTOCAP:ETH is sitting right on its key trendline support. What happens next could be BIG!
🔵 If support holds → $3,000+ is coming!
🔻 If it breaks → ETH could dip to $2,000 before the next pump!
This is the moment where patience meets opportunity.
Don’t chase — wait for the move and ride the wave!
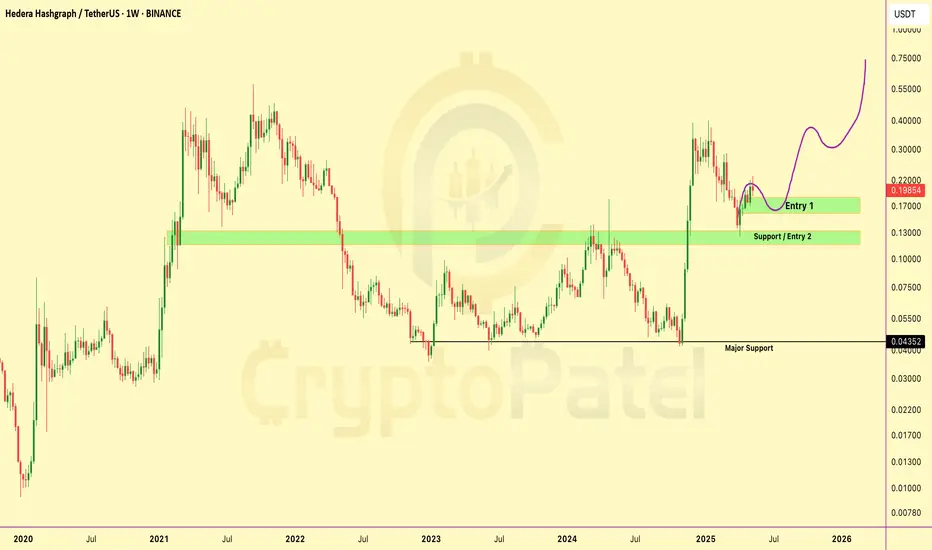
HBAR/USDT Chart Analysis and Price ProjectionMassive CRYPTOCAP:HBAR Rally Loading – Only If This Zone Holds!
Price is holding the critical support at $0.130 — a confirmed base here could trigger a major upside move toward $0.50–$1 🚀
▶️ Accumulation Zone: $0.180–$0.160
▶️ Invalid below $0.124
▶️ Above = ultra bullish structure in play!
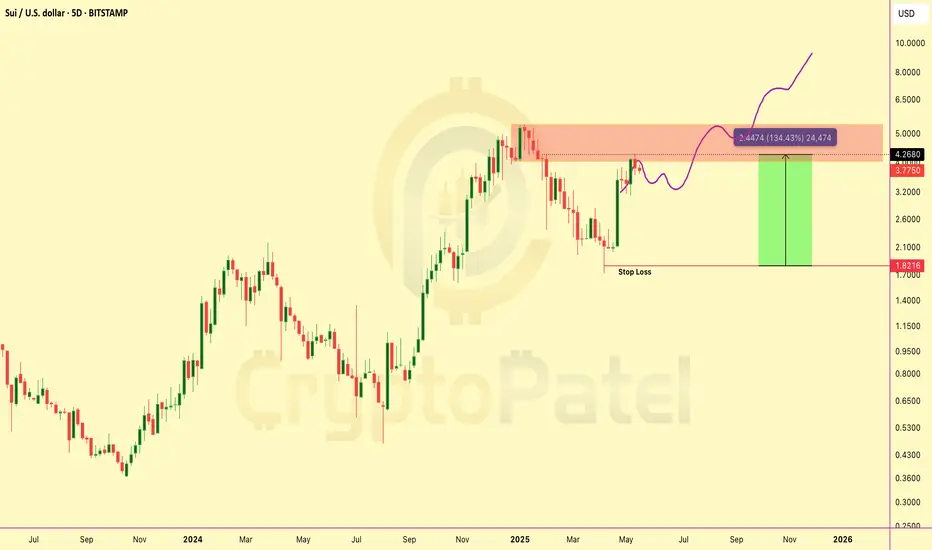
$SUI 130% up from our Entry and What Next?CRYPTOCAP:SUI pumped 130% from our entry around $2 — now hitting $4.29! Bottom perfectly caught.
Expecting a healthy pullback to ~$3 before next leg higher — that zone is ideal for fresh entries.
Long-term targets: $5/$10/$15/$20
#SUI #Altcoins
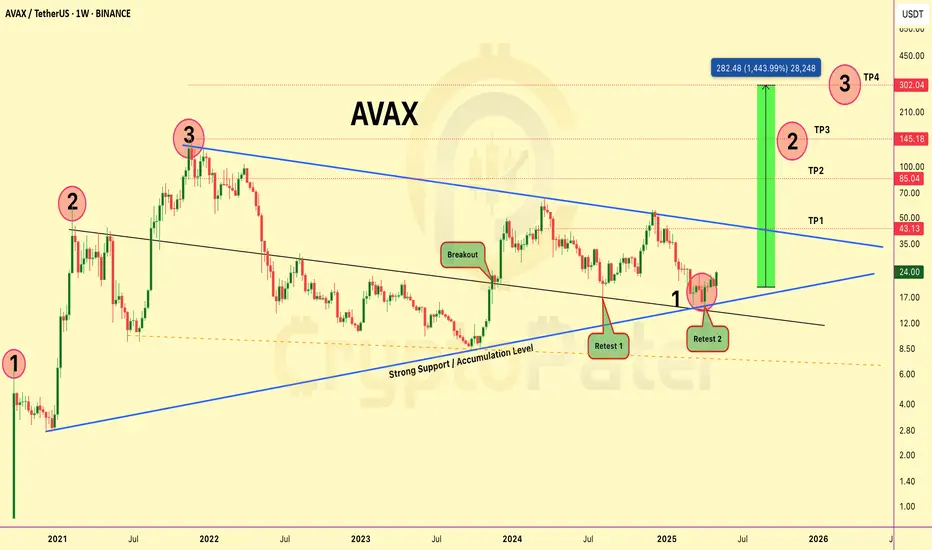
$AVAX Weekly Chart Update – Massive Breakout Brewing!🚨 CRYPTOCAP:AVAX Weekly Chart Update – Massive Breakout Brewing!
#AVAX is showing a textbook falling wedge breakout on the weekly timeframe, and the setup looks 🔥 for a potential 10x+ move!
Here’s what’s happening:
✅ Structure: Multi-year falling wedge since 2021
✅ Breakout: Confirmed in late 2023
✅ Retests: ✅ Retest 1 & ✅ Retest 2 both held perfectly
✅ Support Zone: Strong accumulation by big players
✅ Accumulation Zone: $24-$20 — still in early entry zone!
🔰 Targets: $43/$85/$145/$302+ (Cycle extension target)
▪️ Measured move suggests +1400% upside potential
▪️ This is one of those charts you don’t want to ignore. Accumulation is likely done. Smart money already positioned. Now it’s about patience and trend continuation.
Chart looks ready. Momentum building. Are you riding this AVAX train? 🚀
Bitcoin Ready to Dump Again till $85000?CRYPTOCAP:BTC just tapped a key Short POI near resistance!
Bears stepping in hard below $99,550 — this is prime sniper zone.
▶️ Trade Setup (SMC x ICT):
▶️ Entry: $93,800–94,200
▶️ Targets: $90,000 → $86,000
▶️ Stop Loss: $99,600 (above structure)
Liquidity swept ✅
FVGs below ✅
Momentum shifting ✅

Will Ethereum hit $12000 in current Bull Market?CRYPTOCAP:ETH just confirmed a monthly hammer close — strongest bullish signal of 2025 so far.
Last similar structure led to a +60% rally.
Price action + volume = Strong reversal setup.
Bias: Long | Accumulation Phase Activated 🚀
Note: NFA & DYOR

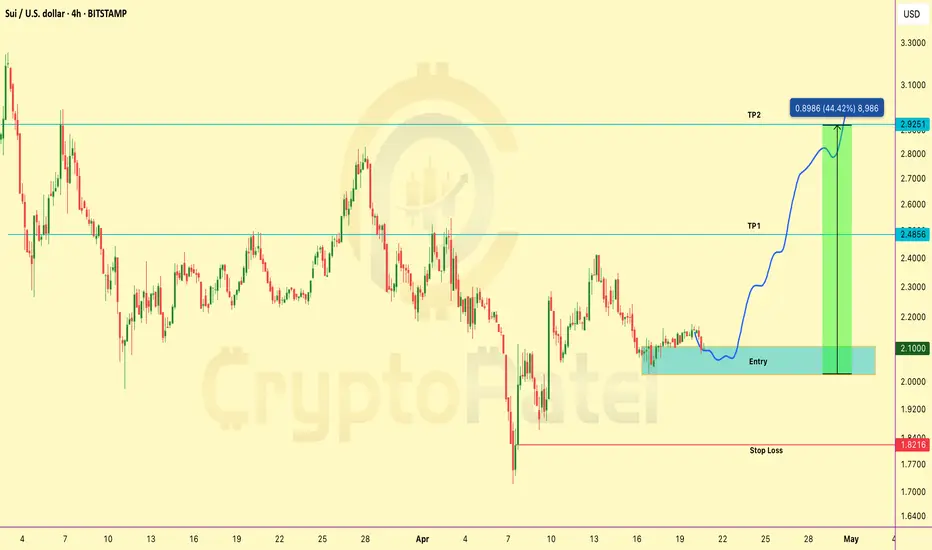
SUI/USDT Chart Analysis and Looking Long Setup for Good RRIf you're hunting clean setups with solid R:R — this CRYPTOCAP:SUI long looks 🔥
▶️ Entry: $2.10–$2.00
▶️ Targets: $2.48 / $2.92
▶️ SL: $1.82
Perfect for risk-managed apes. Don’t sleep on it.
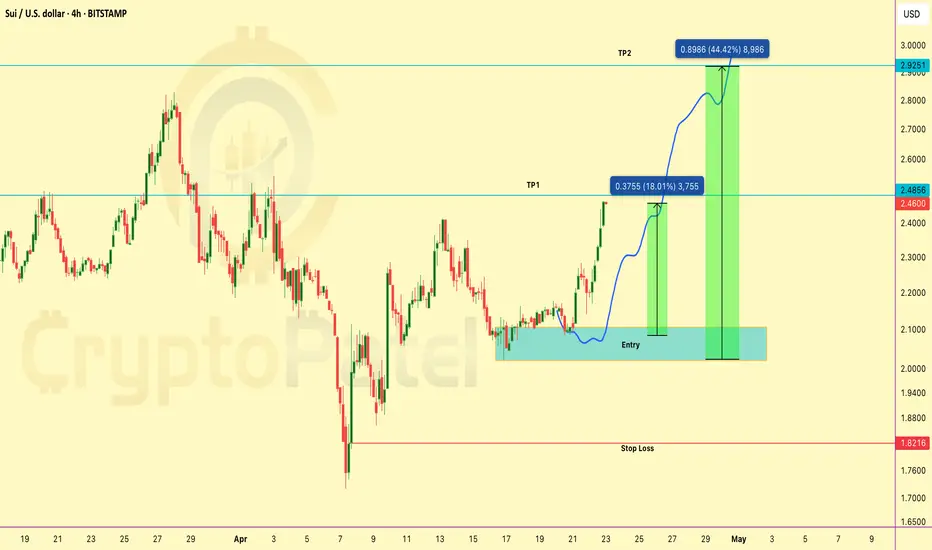
SUI/USDT Now 18% up in Spot from our Entry LevelCRYPTOCAP:SUI just hit +18% on spot and a massive +176% on 10x leverage from our shared trade setup! 🚀
➡️ Entry: $2.08
➡️ Current: $2.4660
Solid breakout play — hope you all caught the move!
Feel free to lock in profits anytime here for a safe exit. ✅
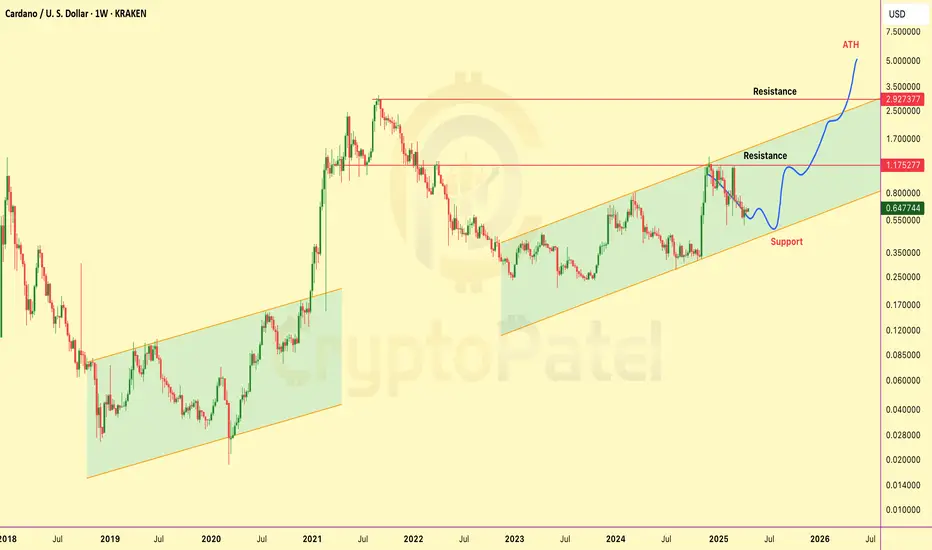
Will ADA hit $5 in bull Market ?CRYPTOCAP:ADA isn’t dead — it’s Loading For $5
The Setup is Clean:
✅ Support at $0.45
✅ Accumulation between $0.65–$0.45
🎯 Targets: $2, $4, $6
Patience here could print fortunes.
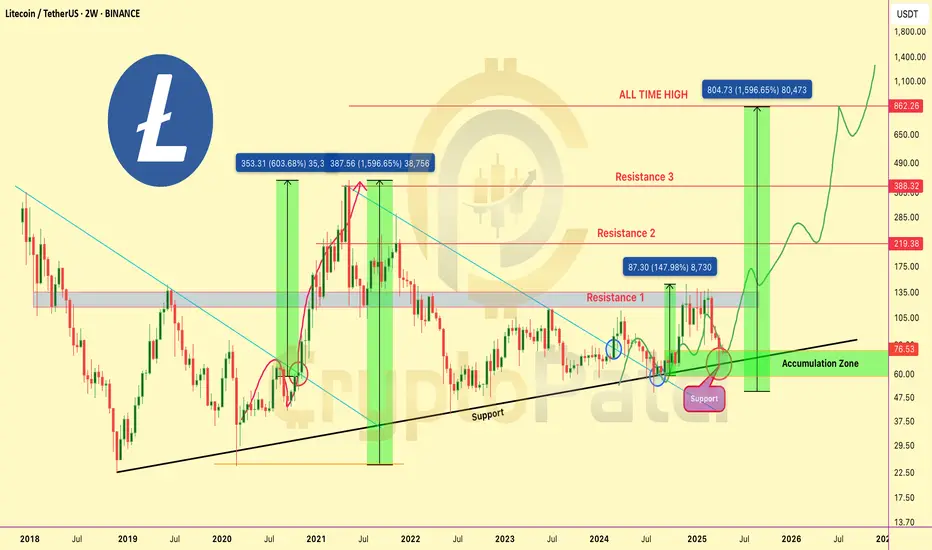
Last time Litecoin was here, it went up 10x. Can it do it again?🚨 Last time Litecoin was here, it went up 10x. Can it do it again?
CRYPTOCAP:LTC is back in its accumulation zone ($60–$80) — the same area where it kicked off a 600%+ rally in 2020 and a 1,500%+ move in 2021!
Every time Litecoin touches this zone, it doesn't just bounce… it rockets 🚀
Right now, it's holding the long-term uptrend support line, showing signs of strength. If we break above the $105–$135 resistance, the next targets are:
👉 Mid-term: $219
👉 Long-term: $388 — and possibly even the $862 ATH 👀
With the structure this clean and history on our side, this could be one of the best R/R setups in the market right now.
Accumulation phase doesn't last forever. Eyes on LTC 👇
🟩 Buy Zone: $60–$80
🟥 Stop-loss: Below $58
💎 Targets: $135 → $219 → $388+
Patience might just pay off big this cycle 💎
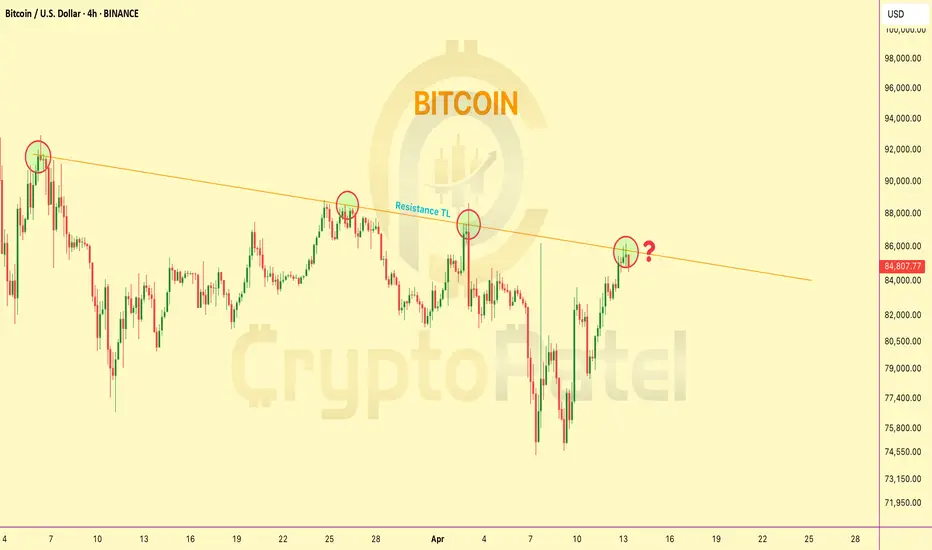
Bitcoin trading at Resistance level so What Next?🚨 Bitcoin 4H Chart Update
CRYPTOCAP:BTC is now trading right at the trendline resistance on the 4H chart
So what’s next?
1️⃣ Breakout and blast toward $100K?
2️⃣ Or another rejection down below $70K?
The decision point is HERE.
This breakout could change the game.
👇 Drop your thoughts –
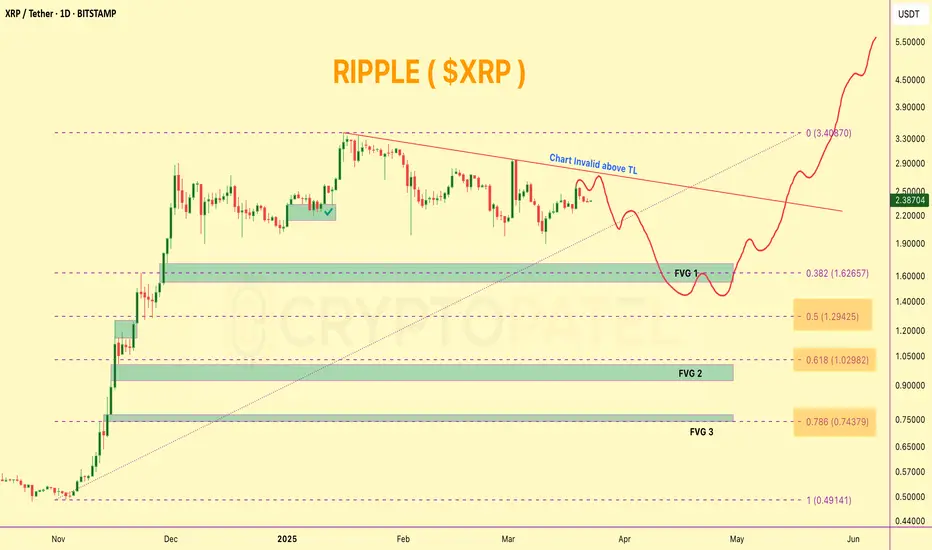
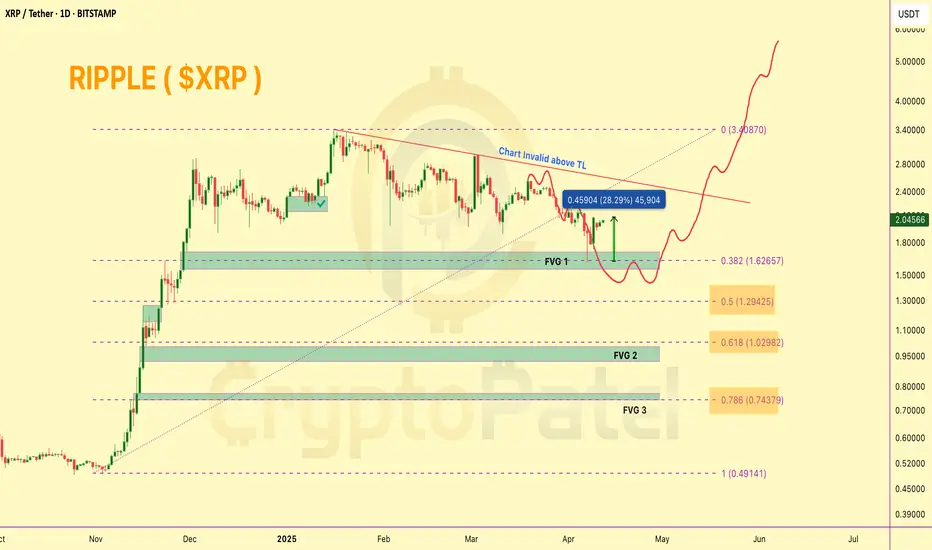
XRP Up 28% From Our Support Call – What’s Next?XRP Up 28% From Our Support Call – What’s Next?
CRYPTOCAP:XRP perfectly respected the FVG 1 zone around $1.60, which we previously marked as a strong support. Since then, price has rebounded over 28% from that level.
Hope you didn’t get caught buying the $2.40–$2.50 zone — as warned, that area showed signs of exhaustion, and price has dropped 30% since.
What’s Next?
If bullish momentum continues, #XRP could revisit the $2.40–$2.50 resistance area. However, this zone may act as a rejection point once again.
From there, we could potentially see a pullback toward $1.30 and $1.00, which aligns with FVG support zones and the 0.5–0.618 Fib retracement levels — key areas where a strong bounce is likely.
🟢 Macro Bias: I remain bullish on XRP/USDT in this cycle and still expect a move toward $7–$10 in the broader bull market. Best entries will likely come during dips into major support zones.
❌ Invalidation Level: This chart setup gets invalidated on an HTF close above $2.50.
Keep it smart — entries on dips, not at tops. 👀
Bitcoin Next move?#Bitcoin reclaimed $85,000, but structurally a deeper retrace remains possible.
Classic TA suggests sustainable rallies often revisit key Fib levels:
1⃣ 0.618 Fib: $69,646
▪️ FVG: $75,582 – $69,916
2⃣ 0.786 Fib: $61,524
▪️ FVG: $64,789 – $63,435
A sweep of these zones could fuel the next leg toward $150K–$180K.
#BTC CRYPTOCAP:BTC

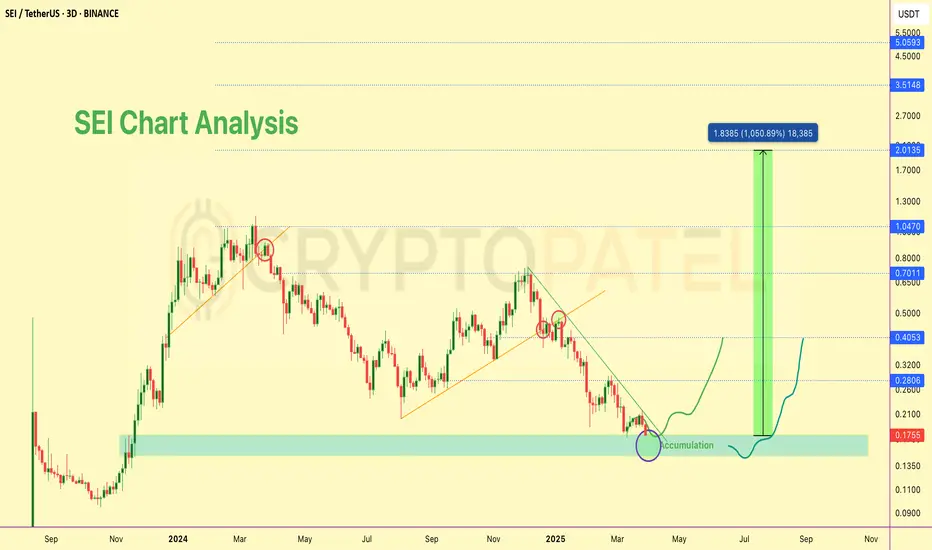
$SEI/USDT- Long-Term Technical Setup and $5 Potential in BullRun📊 $SEI/USDT – Long-Term Technical Setup
NYSE:SEI is holding strong at the $0.18 support zone, showing early signs of accumulation. This level has historically acted as a demand area, making it a key zone to watch.
🔹 Structure: Forming higher lows – bullish trend intact
🔹 Volume: Accumulation pressure building
🔹 Sentiment: Backed by large-scale buyers (e.g., Trump’s World Liberty)
📈 Long-Term Targets:
➡️ $0.45 → $1.00 → $2 / $3 / $5 (macro targets similar to CRYPTOCAP:SUI )
🛑 Invalidation: Close below $0.15
⚠️ Not financial advice. DYOR.
#SEI #CryptoTA #Altcoins #DYOR #TechnicalAnalysis
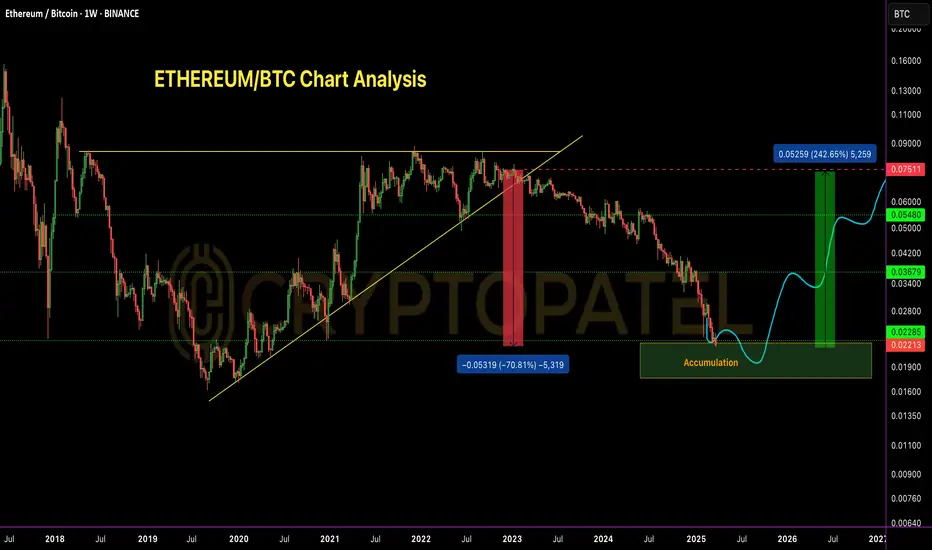
ETH/BTC – 70% Drop Achieved | Perfect Short ExecutionETH/BTC – 70% Drop Achieved | Perfect Short Execution
As projected in my analysis dated 10th Nov 2022, ETH/BTC has completed the anticipated 70% correction from the top.
Short Entry: 0.075 BTC ✅
TP1: 0.055 BTC – ✅
TP2: 0.037 BTC – ✅
TP3: 0.023 BTC – ✅
All targets achieved with precision.
Bearish structure played out as expected.
Current Outlook:
CRYPTOCAP:ETH Price has now entered a historical demand zone, coinciding with major multi-year support levels.
Accumulation Phase Activated –
Starting to scale into long positions from current levels, targeting mid-to-long term reversal setup.
Patience required – this could be the base of the next macro leg up.
Note: NFA & DYOR
#Ethereum
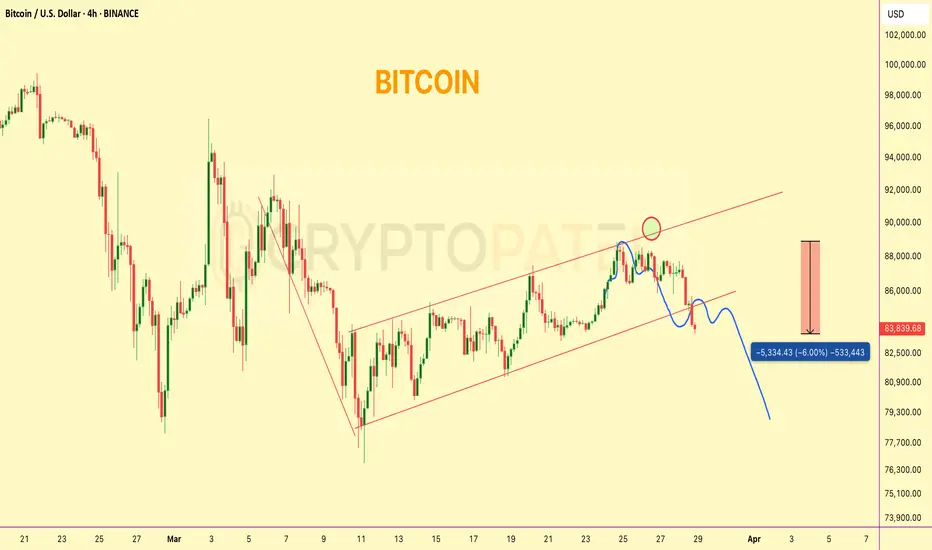
Bitcoin 6% dip form Rejection level✅ #Bitcoin respected our chart perfectly — rejected cleanly from our resistance zone.
🔻 Currently down ~6% from that level.
What’s next?
If CRYPTOCAP:BTC breaks and sustains above $85,650, we may see bullish continuation.
Else, expect further downside targets to unfold.
Will ETH/USDT hit $10,000 in this bull run?CRYPTOCAP:ETH is consolidating within a clear accumulation range.
A macro breakout is likely post-April, supported by cyclical structure & on-chain metrics.
HTF target: $10,000 remains valid.
Accumulation precedes expansion. 📈

Breaking: $BTC reclaims $87,000, What Next?🚨 Breaking: CRYPTOCAP:BTC reclaims $87,000 🚀
POI: $88,000–$90,000
This zone is crucial — it will decide Bitcoin's next major move.
Watch closely:
✅ Hold above $90K = bullish continuation
❌ Rejection from POI = possible pullback
#Bitcoin #BTC

Blackrock CEO Larry Fink predicts Bitcoin to $700k🔥 CRYPTOCAP:BTC TARGET: Blackrock CEO Larry Fink predicts Bitcoin can go up to $500,000 - $700,000.
#Bitcoin #BlackRock

XRP Technical Breakdown – 3 Key Gaps Identified!🚨 XRP Technical Breakdown – 3 Key Gaps Identified!
Hey fam! 👇
I just spotted 3 major GAPS on the CRYPTOCAP:XRP Daily Chart, and they could play a crucial role in XRP’s next big move!
Gap Zones to Watch:
1️⃣ GAP 1 – $1.712 to $1.546
2️⃣ GAP 2 – $1.00 to $0.9268
3️⃣ GAP 3 – $0.772 to $0.64
My Take (IMO):
✔️ In this current super bullish market, GAP 1 has a high probability of being filled before the next leg up toward $5+.
However, if we rely purely on Technical Analysis + Fibonacci levels, the chart indicates that GAP 2 & GAP 3 might need to be filled first before a sustainable upside.
Based on the Fib retracement, if CRYPTOCAP:XRP revisits the 0.618 - 0.786 zones, it could create a powerful reversal and bounce setup from there. That’s a key confluence level for long-term holders and swing traders.
High Liquidity Zones = Opportunity Zones!
All 3 GAPs align with areas of high liquidity – ideal for setting strategic buy orders if you're playing the safe accumulation game.
📢 What do you think?
Do you believe Ripple can drop below $1 again before a new ATH?
Let’s discuss – drop your TA in the comments 💬👇