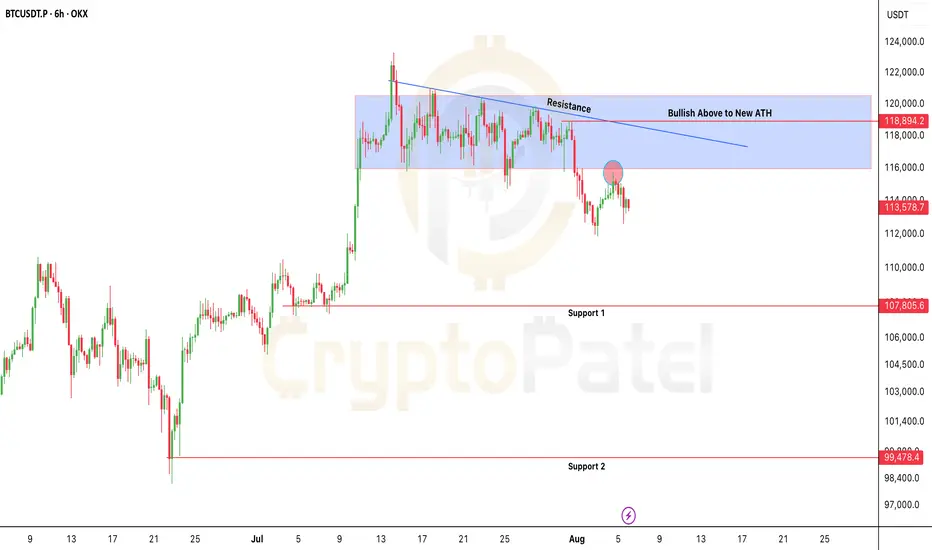
$BTC at make-or-break zoneCRYPTOCAP:BTC at make-or-break zone
Holding above $116K = bullish reaction likely → next leg higher Toward New ATH
Losing this support = bearish breakdown → eyes shift to $100K liquidity pool.
Market structure is clear: support defends or capitulation begins.
Search in ideas for "CRYPTO"

Bitcoin at Risk: $115.7K Is the Line Between Bounce or BreakdownBitcoin at Risk: $115.7K Is the Line Between Bounce or Breakdown
CRYPTOCAP:BTC is trading below key resistance ($115.7K–$118.9K) and rejected cleanly at the trendline.
As long as price holds below $115,700, bearish bias remains.
⚠️ Failure to reclaim = high risk of breakdown toward $107K and even sub-$100K levels.
Bearish invalidation only above $119K
NFA & DYOR
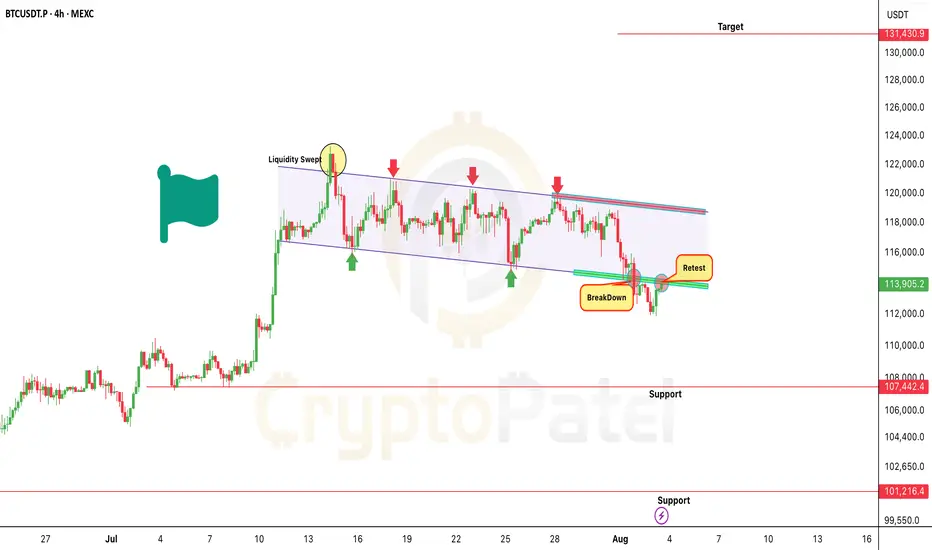
Bitcoin Breakdown or Bull Trap? $100K or $131KAs previously shared CRYPTOCAP:BTC had a potential to tap $114K when it was around $120K.
But now, $114K support has broken, and price is currently trading in the bearish retest zone post-breakdown.
Bearish Targets: $107,000/$101,000
Important Note:
Watch $115,700 zone closely- This could be a liquidity sweep trap.
If any HTF candle (4H/D) closes strongly above $115,700, it invalidates the bearish structure and may flip into a bull flag breakout.
Key Levels:
Bullish Flip Zone: $115,700 (Close Above HTF = Exit Shorts)
Trend Reversal Trigger: HTF close above $119,000 → Can open door to $131,000
Remember:
Trade with confirmation, not assumption.
Always respect key levels and adapt if market structure shifts.
NFA & DYOR
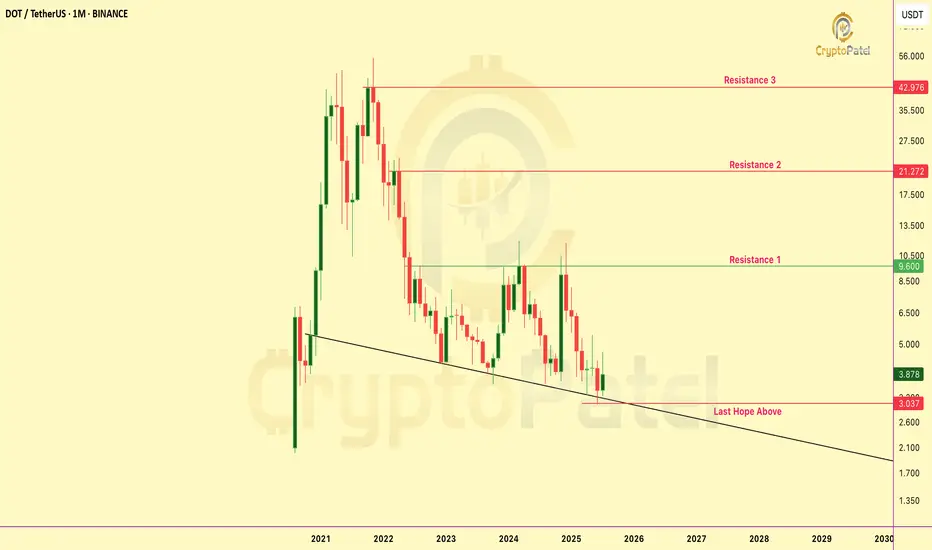
Is Polkadot (DOT) Dead or Ready for a Comeback? Full Update 2025Polkadot was one of the strongest performers of the last cycle. After launching near 2.70 dollars in August 2020, it rallied to an all-time high of $55 in November 2021. That marked a nearly 1,900% gain in just over a year.
However, fast forward to mid-2025, and CRYPTOCAP:DOT is now trading back around its launch price, down approximately 94% from its peak. This has raised a major question among long-term holders and new investors alike: is DOT finished, or is it setting up for a new cycle?
Technical Analysis: Price Structure and Key Levels
DOT’s current price action is best described as a full macro retracement.
Support zone: $2.50 to $3.00: A historically important area acting as both launch base and now long-term demand zone.
Resistance zone: $4.60 to $5.50: Former breakdown levels and local range tops.
Market structure: Still bearish on the macro timeframe, with lower highs and lower lows intact since the 2021 top.
From a risk-reward perspective, #DOT is trading at long-term support levels. If price holds this range, the setup offers asymmetric upside into the next bull phase.
However, a clean break below $2.50 would invalidate this zone and could lead to a deeper correction.
Fundamental Analysis: What Polkadot Is Building
Despite the heavy price drop, #Polkadot continues to execute on its long-term roadmap. Its core value lies in building a scalable, interoperable multichain network powered by parachains and the Substrate framework.
Key Developments in 2025:
Polkadot 2.0 and Elastic Scaling
A major upgrade that introduces Asynchronous Backing, Agile Coretime, and Elastic Scaling to drastically improve block production, scalability, and efficiency.
Polkadot Pay App
Launching in August 2025, this mobile application aims to make DOT more usable for real-world payments and onboarding new users.
DOT Tokenomics Overhaul and ETF Anticipation
A restructured economic model is expected in Q4 2025, potentially adjusting inflation, staking rewards, and circulation dynamics. An ETF approval is also being discussed, which could bring in new institutional liquidity.
Polkadot Hub and Developer Tooling
A unified portal for developer onboarding, launching in October 2025. Polkadot currently maintains over 2,400 monthly active developers and more than 285 parachains.
Asset Hub and Solidity Support
With PVM (Polkadot Virtual Machine), Polkadot now allows Solidity and Ethereum-native applications to deploy directly within its ecosystem- improving dApp compatibility and reducing migration friction.
Sentiment and Investor Psychology
Many retail investors are skeptical due to the prolonged drawdown and loss of momentum. In crypto, narrative plays a crucial role in price recovery. While Polkadot still has strong fundamentals, it currently lacks the hype and retail traction that drove its 2021 rally.
If DOT can regain attention through real-world utility, DeFi growth, or ecosystem traction, its market value could catch up with its underlying development.
Strategy Outlook
From a technical standpoint, this is a make-or-break level. Holding the $2.50 to $3.00 zone is essential for a bullish setup. Failure to defend this base could lead to prolonged accumulation or deeper downside.
From a fundamental view, Polkadot is still among the few L1s delivering real upgrades in 2025. The question is whether the market will reward it.
Conclusion
Polkadot is not dead. It is rebuilding and evolving. The upcoming launch of Polkadot 2.0, tokenomics improvements, developer ecosystem expansion, and cross-chain architecture all position DOT for a potential recovery, if market conditions align.
While the price action has been discouraging, strong fundamentals combined with strategic patience could present an opportunity for long-term holders.
Always manage risk, define your invalidation levels, and evaluate both narrative and execution before making investment decisions & NFA always DYOR.
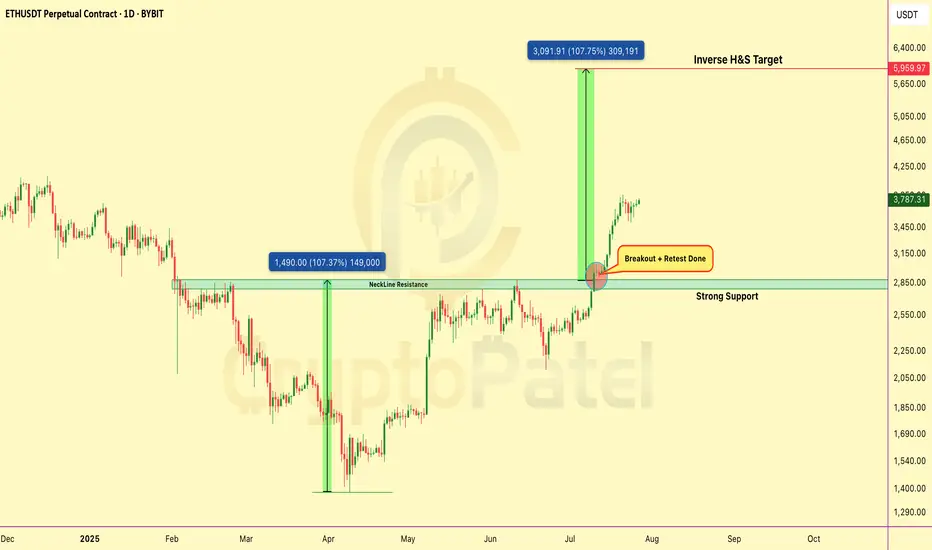
Ethereum Breakout Confirmed – Retest CompletedCRYPTOCAP:ETH has broken out Inverse Head & Shoulders on daily chart.
✅ Neckline breakout above $2,850
✅ Retest successful – strong support confirmed
✅ Targeting full move toward $6,000
Structure is bullish, momentum building. As long as #Ethereum holds above the neckline, continuation is likely.
Note: NFA & DYOR
Chainlink’s Bull Run: Up 80% After the Dip — Is $100 the Next?Chainlink’s Bull Run: Up 80% After the Dip — Is $100 the Next Target?
If you followed my chart, you likely caught the move.
✅ We entered below $10
✅ It pumped to over $30
✅ Recently dipped near $11 and another good Profit.
It’s still up 80% from our entry zone, and I believe CRYPTOCAP:LINK still has room to grow.
My updated targets: $50 / $75 / $100
Tip: Take some profits along the way and ride the trend smartly.
NFA & DYOR

$ETH IS FLIRTING WITH A MASSIVE BREAKOUTCRYPTOCAP:ETH IS FLIRTING WITH A MASSIVE BREAKOUT
Price is hovering just below the HIGH LIQUIDITY ZONE at $2,867 — a major inflection point!
✅ Break above… We could see a parabolic push toward ATHs.
❌ Rejection = A sharp correction might hit hard.
It’s make or break time for Ethereum.
What’s your plan if this breaks?
NFA & DYOR

Is $SOL about to DUMP… or set up a MASSIVE BUY ZONE?Is CRYPTOCAP:SOL about to DUMP… or set up a MASSIVE BUY ZONE?
Solana is now at a critical level on the higher timeframe chart:
✅ After a breakdown, SOL is now retesting the bearish retest zone
✅ Strong resistance seen at $170–$180
✅ If rejected → price could dip toward the $100 range
But here’s the key: A dip to $100 would be a massive long-term buying opportunity for many investors (including me).
Long-term targets? I’m still eyeing $500 → $1000 if the macro trend plays out.
👉 Keep a close eye — the next few weeks could set up the next big move for $SOL.
Are you ready? Will you be buying the dip? Comment below! 👇
NFA & DYOR
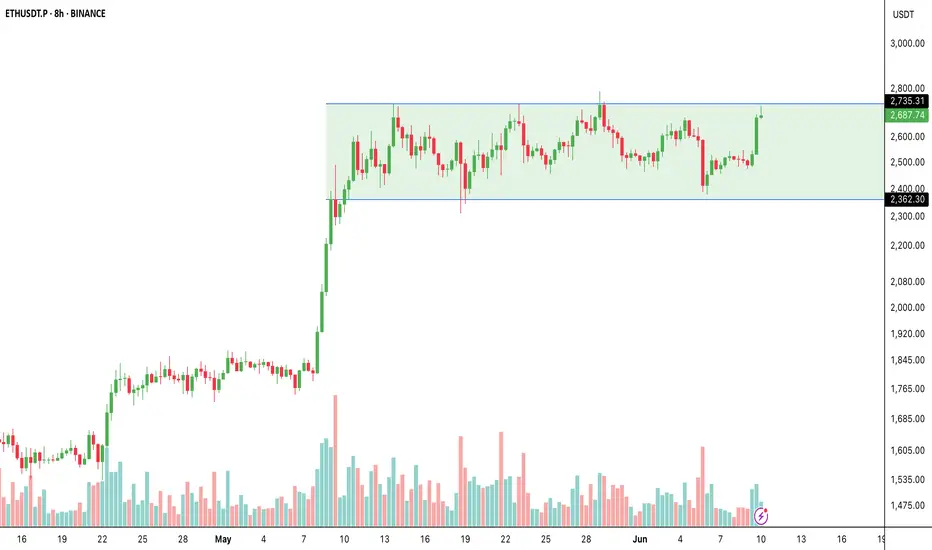
Ethereum Breakout Imminent?🚨 Ethereum Breakout Imminent?
CRYPTOCAP:ETH has been trading in a wide range:
👉 Support: ~$2,362
👉 Resistance: ~$2,735
Now ETH is once again testing this critical resistance zone with higher lows and rising volume — a classic breakout setup in play.
What to watch:
✅ Break & close above $2,735 → $2,800 → $2,900 → $3K
❌ Rejection → back to $2,400–$2,500 range.
Summary:
Ethereum is building momentum → next move could be explosive.
Will it break out or rotate? Stay sharp!
NFA & DYOR
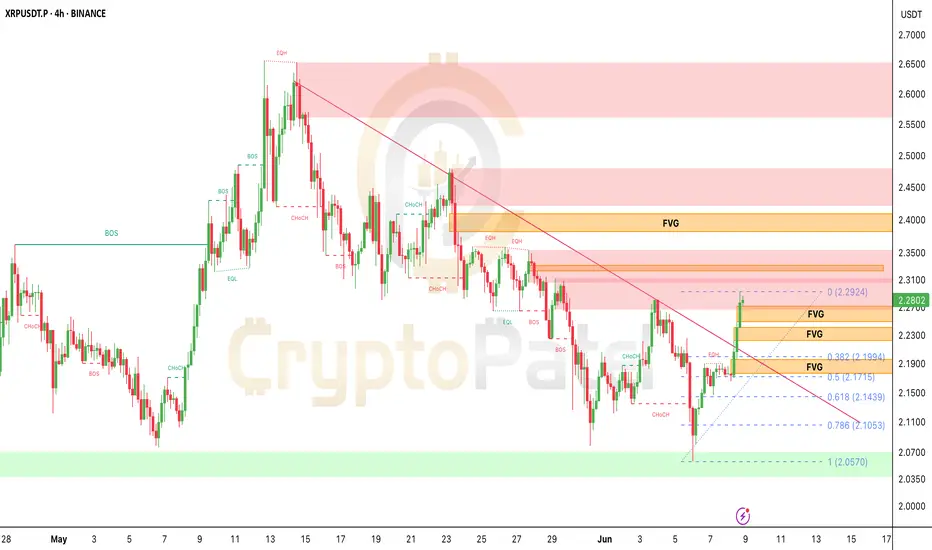
XRP/USDT 4H — Major Breakout Alert! 🔥 XRPUSDT 4H — Major Breakout Alert! 🔥
Here’s what I’m seeing right now on the XRP 4H chart:
✅ Bullish CHoCH + BOS → trendline broken → market flipped bullish.
✅ Testing $2.29 FVG → buyers pushing strong.
✅ Volume confirms true breakout.
🎯 Next upside targets → $2.36 → $2.42 (supply zone).
Best buy zone on pullback → $2.17-$2.14 (confluence of FVG + 0.618 Fib + demand).
Bias: Bullish → Only flips neutral if $2.14 breaks down.
Pro Tip: Wait for pullback if not in yet → better R:R at $2.17-$2.14 zone.
What’s your target for CRYPTOCAP:XRP this week? Comment below! 🚀
Bitcoin Bulls vs Bears — Battle Zones Mapped Out#Bitcoin Bulls vs Bears — Battle Zones Mapped Out
🔰 $105K–$106.7K = Bearish Order Block:
Below this zone = CRYPTOCAP:BTC stays bearish unless HTF closes above $106.7K
🔰 Next Moves:
▪️ Likely retest $105K–$106K before next leg ↓
▪️ Target: $97K–$95K zone
🔰 Key Levels:
✅ Holding 0.618 Fib (support)
✅ Unfilled FVG: $97K–$98.3K
✅ Bullish OBs: $95.7K–$97K | $93.5K–$94.7K
If $97,000 holds strong → Expect BIG bounce!

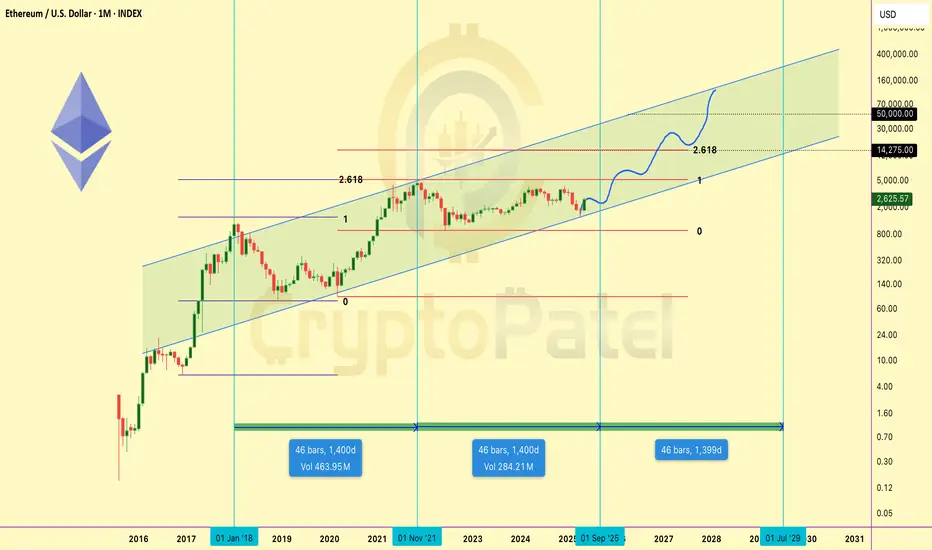
Ethereum Macro Chart Breakdown – Eyeing $10K+ Targets! Ethereum Macro Chart Breakdown – Eyeing $10K+ Targets!
Let’s zoom out and look at the bigger picture for CRYPTOCAP:ETH – this isn't just a pump; it’s a potential parabolic supercycle forming.
Technical Outlook:
Fractal Pattern Analysis
Ethereum is following a similar macro-structure to its 2017–2021 cycle, where after a long consolidation and accumulation phase, it exploded nearly 30x from bottom to top.
Current price action mirrors the post-2019 structure, and we’re at the same breakout stage right now.
Fibonacci Projections
Using the Fibonacci extension from the previous bear market low to the bull market top, and applying the same ratio from the 2022 bottom:
🔹 1.618 Fib = ~$10,000
🔹 2.618 Fib = ~$14,000
These targets align with Q4 2025–Q1 2026, based on previous cycle timings.
Structural Support
ETH is now trading above its 100-week EMA and holding bullish structure on higher timeframes. Previous resistance at $2,500 has flipped into strong support.
Momentum & Fundamentals
🔹 Layer 2 scaling is booming (Arbitrum, Base, zkSync)
🔹 Institutional ETH ETFs are launching
🔹 ETH powers Web3, DeFi, AI infra, RWAs, and more
🔹 Ultra-sound money supply dynamics + staking yield
🔹 Ecosystem growth is organic and robust
Projected Targets:
🎯 Short/Mid-Term (Q4 2025): $10,000 – $14,000
🚀 Ultra Long-Term (2029–2030): $40,000 – $50,000
If you still believe ETH is “just another altcoin,” you’re missing the bigger picture. Ethereum isn’t a meme — it’s the backbone of digital value, smart contracts, and future finance.
I’m long and accumulating ETH on dips. This isn’t just a trade — it’s a conviction play.
🗨️ Drop your ETH target in the comments 👇
🔁 Share this with someone sleeping on ETH!
Note: This is NFA So DYOR
Bitcoin Dumped form $111800 to $107800 so What next?🚨 Hope you caught the top short at that Bearish OB!
CRYPTOCAP:BTC dropped from $111.5K → $107.8K
Next Key Level: $105K
Hold = Bull Mode On 🟢
Break = Say Hello to < $100K again 😬
Reminder: Don’t gamble your hard-earned money. Trade smart.

ETHEREUM MEGA CYCLE ALERT🚨 ETHEREUM MEGA CYCLE ALERT 🚨
CRYPTOCAP:ETH just bounced from the same support zone that sparked its last bull run 🔥
This could be the start of Wave 5 — and if history repeats…
🎯 Target: $10,000 ETH
Last time this pattern showed up? ETH went 10x.
Don’t fade the chart.
👉 Like & Retweet if you’re riding this wave
👇 Tag a friend who’s still sleeping on ETH!

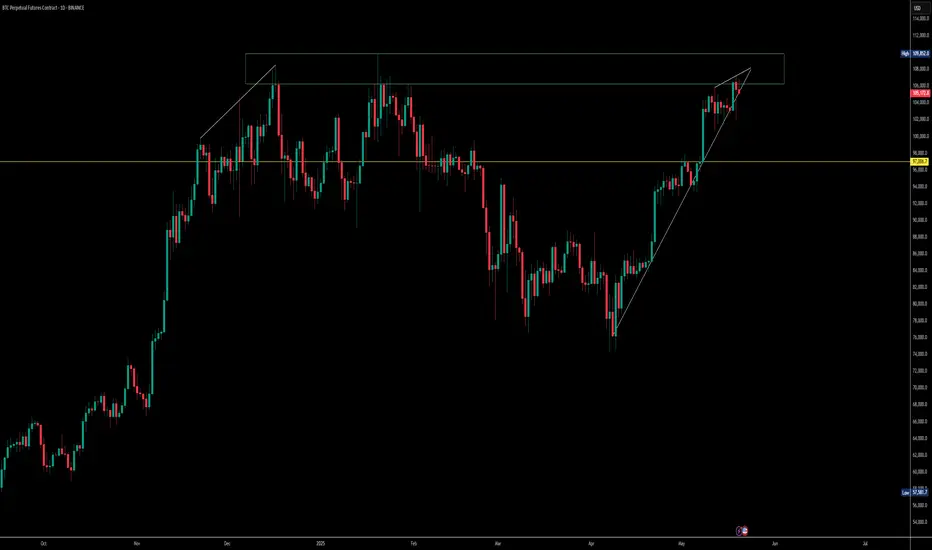
$BTC Facing Strong Rejection – Correction Ahead?CRYPTOCAP:BTC is showing clear rejection signs from the trendline near the key resistance zone around $107,000, replicating the December 2024 - January 2025 structure.
Hanging Man candle near resistance
Bearish RSI divergence
MACD bearish crossover
Weak buying pressure vs growing selling volume
Stochastic RSI fading out
one retest around 97000$
If $90K support breaks, watch out for a deeper drop toward $60K.
Market structure suggests a smart correction is brewing. Don’t ignore the signs.
DOGECOIN MEGA Bullish In Altseason CRYPTOCAP:DOGE is looking MEGA BULLISH! 🚀
Already did 700% from our first entry and still 300% up — plus it’s now 68% up from our Recent 2nd entry!
Chart shows strong bullish structure — higher highs, clean pullbacks, and massive community momentum backing it up. This bull run, #DOGE has real potential to hit:
▶️ Targets: $0.5 / $1
▶️ Long-Term: $1 / $2 / $3+
The meme king isn’t done — this could be just the beginning! 👑
👉 Are you holding DOGE/USDT?
Like & Retweet if you believe #DOGECOIN will hit $1 this cycle!

$BNB is destined for $2000 — Question is, will you ride it ?CRYPTOCAP:BNB is destined for $2000 — Question is, will you ride it or get Liquidated?
Both bull and bear traps ahead.
Prepare for volatility, protect your capital, and let the trend do the talking.

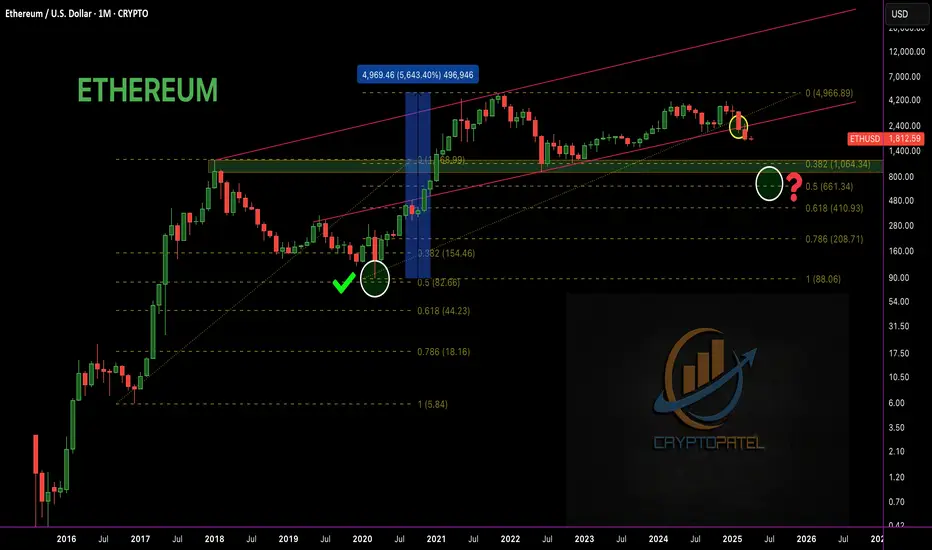
Will $ETH Drop Below $1,000 Before Heading to $7,000+? Will CRYPTOCAP:ETH Drop Below $1,000 Before Heading to $7,000+?
🟣 Historically, #ETH respected the 0.5 Fib retracement in bull markets – In the last bull run, ETH retraced to 0.5 Fib at $89 — then exploded to $4,867
🟣 That’s +56,000% in just 1.5 years!
This cycle, the 0.5 Fib level sits around $661. With the monthly trendline breakdown, the big question is:
Will #Ethereum dip below $1,000 and test $700 before making a new ATH?
If ETH reaches sub-$1,000 zones, I'm personally buying heavy and holding for 1–2 years. No FA – just Fib, patience & conviction.
ETH will reward those who ride the wave, not fear the dip.
Hold strong. Next 1–2 years = massive opportunity.
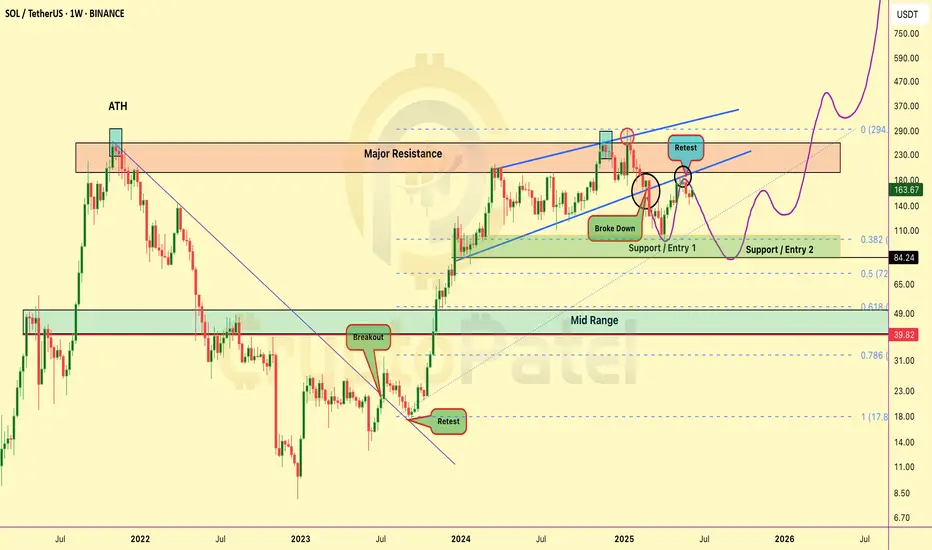
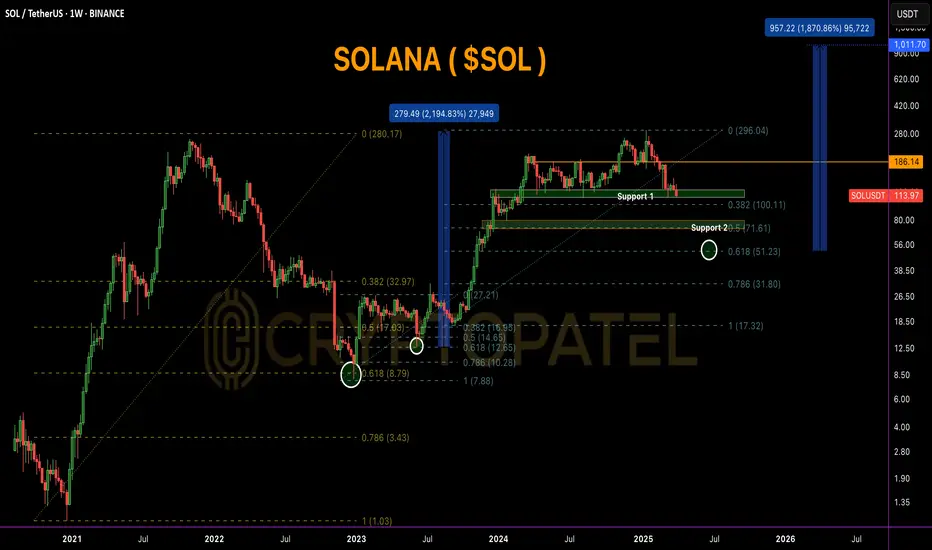
SOLANA Weekly Chart Breakdown–2020 Fractal Signals Massive Bull#SOLANA Weekly Chart Breakdown – 2020 Fractal Signals Massive Rally Ahead!
CRYPTOCAP:SOL is trading at $114.35, currently sitting on a key Fibonacci 0.382 support zone ($100–$115). This area has historically acted as a strong bounce level and is perfect for early accumulation.
If this zone fails, the next major support is the golden pocket ($50–$72) — also marked as Support 2, aligning with the 0.618 Fib retracement.
Historically, this level triggered a 2,100% rally back in 2020-21. If this fractal pattern repeats, we could be looking at a future target near $1,000+.
Breakout level to watch:
▪️ $186 = Bullish confirmation
▪️ $296 = Previous ATH
▪️ $1,011 = Fibonacci-based bull cycle target
Accumulation Plan:
▪️ Zone 1: $100–$115 → Light spot entries
▪️ Zone 2: $50–$72 → Heavy long-term accumulation
✅ Holding above $100 keeps the bullish structure intact.
✅ Break above $186 = start of the next bull wave.
Smart accumulation now can lead to 10x+ returns in the upcoming cycle!
It's All About SO/USDT Overview.
Will Ethereum Drop below $1000 or Hit $10,000 in This Bull Run?One Golden Rule in Trading: Always buy the dip on fundamentally strong projects with 5x–10x potential in the near future.
Patience + conviction = profits.
#Ethereum CRYPTOCAP:ETH

Will Ethereum Fall below $1500 or Ready to $8000 ?#Ethereum Fresh Weekly Analysis
🔹 Current Trend: CRYPTOCAP:ETH has dropped -51% in the last 3 months, signaling a major retracement.
🔹 Key Support Zone: Trading above $2000-$1900, a crucial accumulation zone for this bull market.
🔹 Upside Targets: If #ETH holds this support, we could see $6000 / $8000 / $10,000 in the coming months.
🔹 Risk Factor: If ETH fails to hold $2000, expect a potential dip towards $1500—a key level for long-term accumulation.
Smart Strategy:
✅ Accumulate ETH on dips instead of chasing tops.
✅ Wealth is built by buying in bear markets and selling in bull cycles.
✅ Long-term holders should focus on accumulation, not panic selling.
IMO ETH/USDT has strong potential in this bull cycle—buy smart, hold strong!
Note: Not Financial Advice so DYOR

SOLANA DOWN 57% FROM ATH! 🚨 SOLANA DOWN 57% FROM ATH!
People are panicking! But is this just a dip before CRYPTOCAP:SOL pumps to $500? 🤯
Smart investors buy dips, not fear! 🚀
What do you think? Buy or sell? Comment below! 👇💬

Bitcoin Important Market Alert: "Sell the News" Strategy🚨 Bitcoin Important Market Alert: "Sell the News" Strategy
With Trump's oath ceremony on Jan 20th, the "Buy the Rumor, Sell the News" phase is near. Keep a close eye on the $92,000 support – it could be a key level.
Be prepared for volatility and adjust your positions accordingly.
#Bitcoin CRYPTOCAP:BTC
