RENDER will hit $15?CRYPTOCAP:RENDER Technical Update
Price is in a bearish corrective phase and currently reacting at the 0.618 Fib zone ($1.55–$1.25), A key area for potential bullish reversal. Holding this zone increases the probability of a strong upside continuation toward $4.6 / $8 / $13 / $20.
If this support breaks, the next major demand lies at the 0.786 Fib level (~$0.84), considered the optimal accumulation zone before any trend shift.
Key Zones:
0.618 Support: $1.55–$1.25
0.786 Support: $0.84
Targets: $4.6 / $8 / $13 / $20
NFA Always DYOR
Search in ideas for "CRYPTO"

BTC Breakdown Confirmed – Here’s Where BTC Could Surge NextBTC Breakdown Confirmed – Here’s Where BTC Could Surge Next
1️⃣ Long-Term Trendline Breakdown Confirmed
🔹 BTC has decisively broken the multi-year ascending trendline supporting price since Nov 2022.
🔹 The Breakdown + Retest at ~$104k-$108k confirms bearish structure ✅.
🔹 Retest failed in Oct 2025, confirming sellers are in control.
2️⃣ Fibonacci Levels Highlight Strong Demand
🔹 Price is now hovering between 0 Fib ($125,647) and 0.382 Fib ($56,494).
🔹 Measured move Targets: Strong Demand Zone $34,477 - $56,494 (0.618 - 0.382 Fib)
🔹 This is the accumulation zone for long-term positions, historically providing strong bounce potential.
3️⃣ Critical Support / Resistance Zones
🔹 Immediate Support: $85k-$87k (psychological)
Major Support:
🔹 $56,494 (0.382 Fib, upper demand)
🔹 $44,133 (0.5 Fib, middle demand)
🔹 $34,477 (0.618 Fib, “Golden Pocket”, lower demand)
Resistance: Broken trendline now acting as key supply
4️⃣ Potential Scenarios
Bearish (High Probability)
🔹 Continuation down to Strong Demand Zone ($34k-$56k)
🔹 Represents 38-61% retracement from ATH, typical after trendline breakdown + retest
Bullish (Needs Reclaim)
🔹 Reclaim broken trendline (~$95k-$100k)
🔹 Close above $104k = false breakdown, continuation to new highs
Why I’m Watching $56,500 - $34,500 for Longs
🔹 Historical accumulation zone with high probability of a strong bounce
🔹 After breakdown + retest, price often retraces to 0.5 or 0.618 Fib before resuming bull trend
🔹 Perfect long-term entry for those aiming for multi-year BTC upside
BTC may test the $56k-$34k demand zone soon. For long-term holders, this is a prime accumulation area before the next bull cycle. Stay patient and strategic – $1M BTC dreams require discipline, not FOMO.
Guys, don’t judge me: I’m a Bitcoin lover too. I’m just reading what the chart is showing. Even if the short-term looks bearish, I see the setup for a massive long-term move toward $1M 🚀
NFA & DYOR

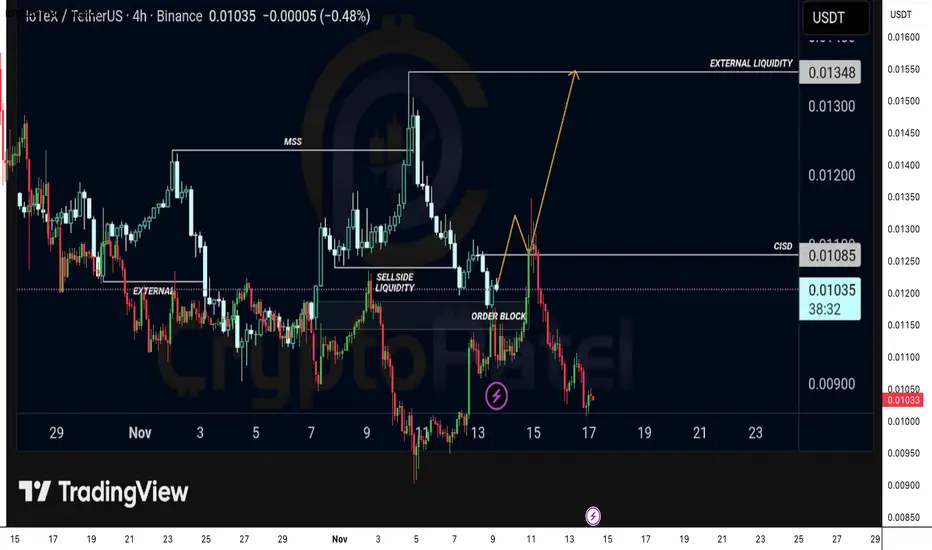
$IOTX / USDT – High Conviction Long SetupCRYPTOCAP:IOTX / USDT – High Conviction Long Setup
Price has already swept sell side liquidity and tapped directly into a fresh bullish Order Block. A decisive candle close above the CISD level at 0.01085 signals strong bullish intent and opens the path toward external liquidity sitting at 0.01348.
Entry 0.01085 | SL 0.00915 | Targets 0.01180 /0.01280 / 0.01348
This setup offers a clean draw on liquidity with an attractive risk to reward profile. If price reclaims CISD with momentum, the upside expansion can be rapid.
Trigger Wait for confirmation above CISD
Note: NFA & DYOR
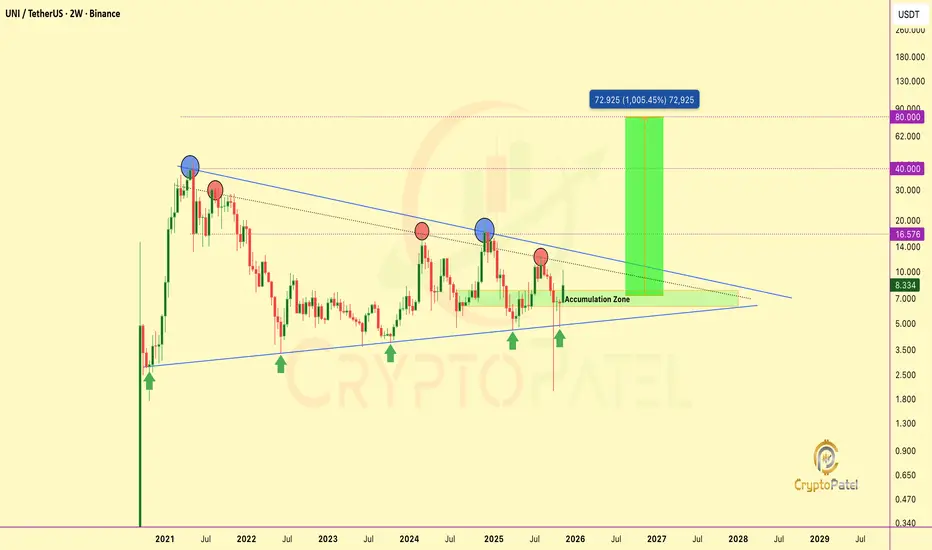
$UNI TA + FA align: Breakout loading toward $80CRYPTOCAP:UNI TA + FA align: Breakout loading toward $80
#UNI is coiling inside a multi-year descending triangle, with strong accumulation at $6–$7.
A breakout above $9–$10 could confirm a macro trend reversal toward $16.5 → $40 → $72+
Catalyst: Uniswap CEO Hayden Adams proposes turning on protocol fees, burning UNI & making it deflationary.
TA + FA = Bullish Expansion Loading...
NFA & DYOR
Ethereum’s Next Move: $3,000 Buy Zone or $10,000 Breakout?Ethereum’s Next Move: $3,000 Buy Zone or $10,000 Breakout?
Current Market Overview:
Ethereum is currently trading below $4,000, indicating short-term weakness as bulls struggle to regain control. The $4,000 level remains a key pivot point, holding above it is essential for any sustained move toward higher targets.
Key Levels to Watch:
🔹 Immediate Resistance: $4,000
🔹 Major Support Zone: $3,000 – $2,600 (ideal accumulation area)
🔹 Upside Targets: $8,000 – $10,000 (if $4,000 is reclaimed)
Bullish Scenario:
If Ethereum breaks and holds above $4,000, it confirms bullish momentum and opens the path toward $8,000–$10,000 in the mid to long term.
Bearish / Accumulation Scenario:
If ETH remains below $4,000, expect a possible retracement toward $3,000 – $2,600. This zone could act as a strong accumulation area for long-term investors.
Outlook:
The broader structure remains long-term bullish despite short-term pullbacks. Dips into major support zones should be viewed as opportunities for strategic accumulation.
⚠️ Note: Always DYOR (Do Your Own Research) before making any investment decisions. This analysis is for educational purposes only.

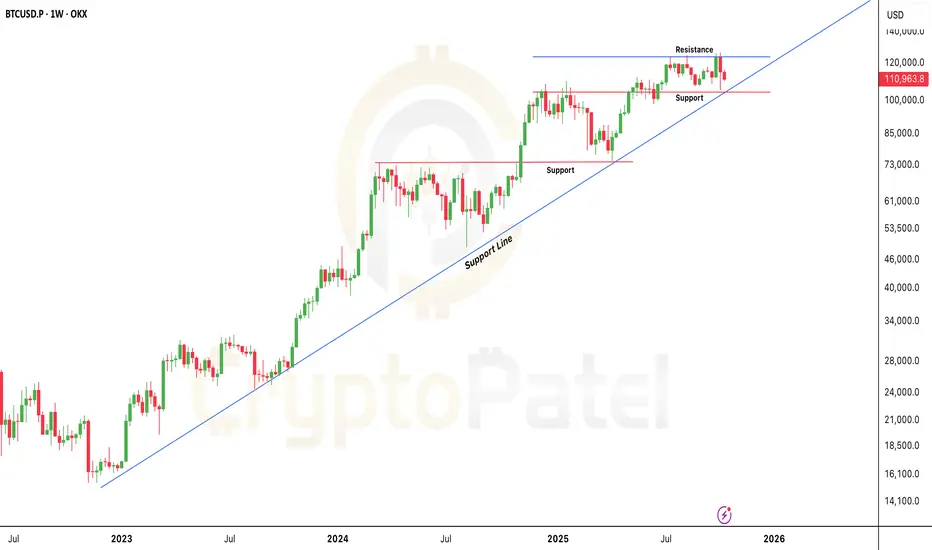
If Bitcoin Loses This Level: Expect the Biggest Correction YetIf Bitcoin Loses This Level: Expect the Biggest Correction Yet
Current Market Overview:
Bitcoin is trading above $110,000, maintaining a bullish stance for now. However, short-term momentum looks weak as the market tests crucial support levels.
Key Support Zone:
The most critical area to watch is $104,000 – $105,000.
This zone aligns with the long-term bullish trendline, which has held firm through multiple market corrections.
As long as price stays above this trendline, the broader trend remains bullish.
Bullish Scenario:
If Bitcoin holds above the $104,000 support level, it signals strength and potential continuation of the uptrend.
In that case, the next upside target remains around $150,000 in the coming months.
Bearish Scenario:
If the $104,000 trendline breaks decisively, Bitcoin may enter a deeper correction phase.
Downside targets could extend to below $100,000, and in a worst-case scenario, even toward $80,000.
Technical Summary:
🔹 Immediate Resistance: $110,000 – $112,500
🔹 Major Support Zone: $104,000 – $105,000
🔹 Trend Bias: Bullish above $104,000 | Bearish below $104,000
🔹 Long-Term Target: $150,000 (if support holds)
Trading Insight:
This is a decisive zone for Bitcoin. Bulls must defend $104k to maintain structure.
Below it, expect volatility and potential trend reversal signals.
NFA & DYOR
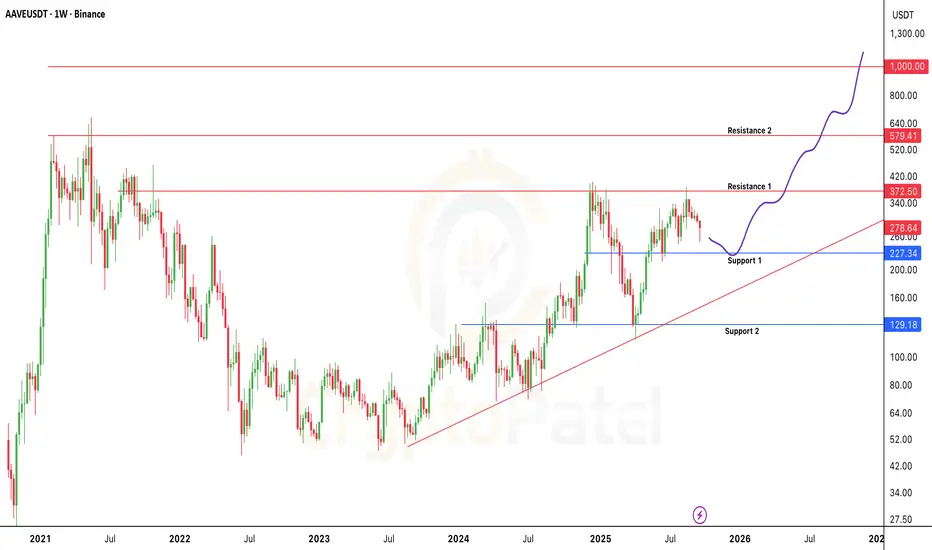
AAVE/USDT Potential to hit $1000Why CRYPTOCAP:AAVE could hit $1000 🚀
V4 launch: Major upgrade boosting fees, TVL & adoption
GHO stablecoin grows, adding revenue
Buybacks + more liquidity driving value
Bear Case:
If Market crash then We can see $200-$150
AAVE has the potential to explode, but watch these risks.
NFA & DYOR
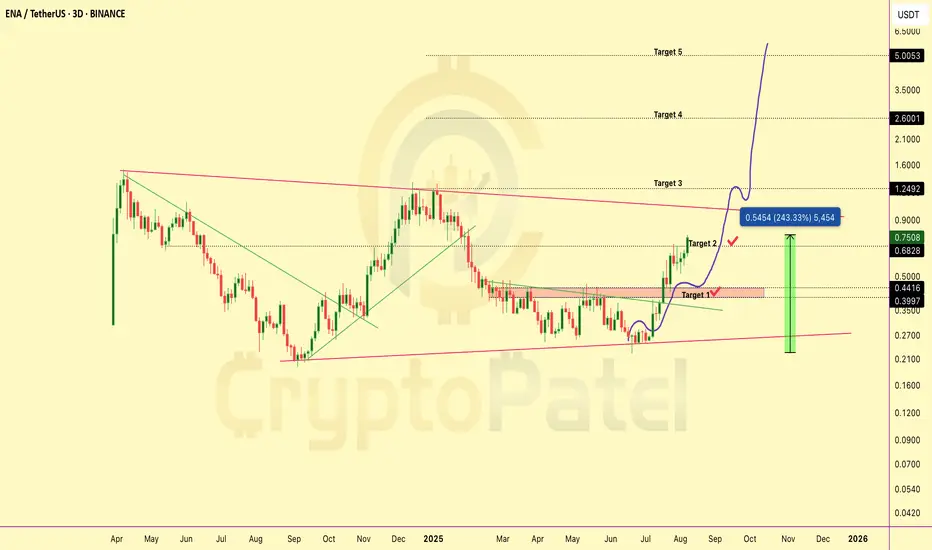
$ENA Up 243% From My $0.25 Entry And I’m Still BullishMIL:ENA Up 243% From My $0.25 Entry And I’m Still Bullish
Now MIL:ENA is trading at $0.75 and up 243% from our $0.25 entry ✅
TP1 and TP2 hit ✅ and I’m still super bullish, eyeing $1 / $2 / $5 next.
But remember, Greed has no limits.
Smart traders book partial profits and ride the rest with house money.
NFA & DYOR
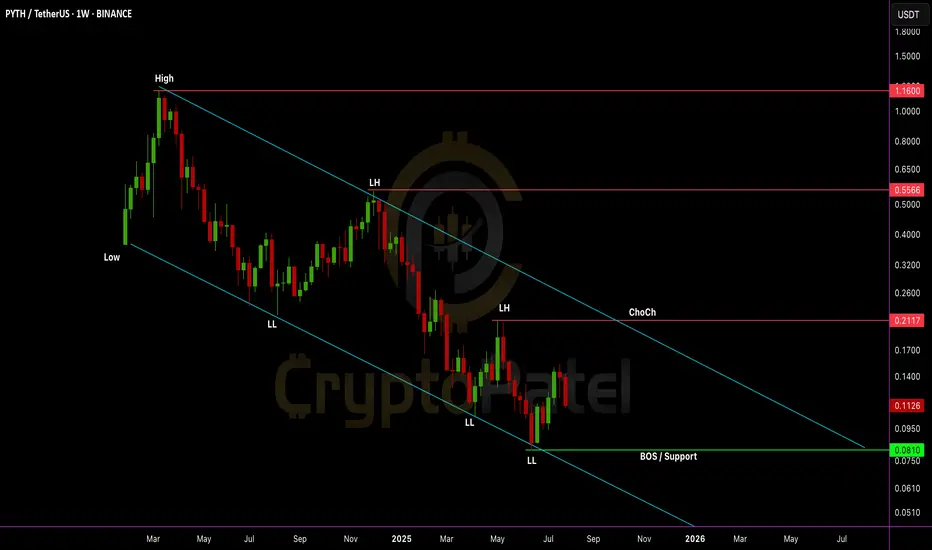
Will $PYTH go to $1 or drop even lower?Will EURONEXT:PYTH go to $1 or drop even lower?
Chart is still bearish with LL + LH structure.
But $0.0810 is a key level. If it holds, a trend reversal is possible. Accumulation zone: $0.085–$0.110
Risky entry, but R:R is huge. Hold = 10x potential to $1+
Break below $0.0810 = new LL incoming.
NFA & DYOR
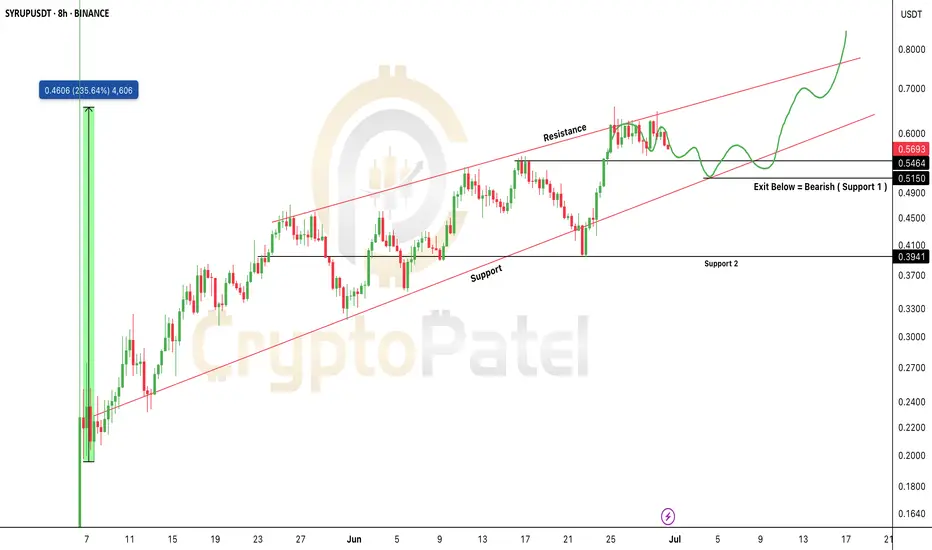
$SYRUP Price Prediction Analysis as per Ascending ChannelSYRUP/USDT – Technical Chart Update (8H Timeframe)
SYRUP is trading inside a clean ascending channel, showing a bullish structure with higher highs and higher lows.
Key Levels to Watch:
Support: $0.51
Resistance Targets: $0.70 → $0.80+
Exit Level: Bearish if price breaks below $0.51
Current Setup:
Price is respecting the lower trendline of the channel. A bounce here could lead to another leg up toward resistance.
Strategy:
Bullish bias as long as SYRUP holds above $0.51
Ideal zone to look for buy opportunities on dips
Exit or hedge if price closes below $0.51
Important Note:
If CRYPTOCAP:SYRUP holds the $0.51 support, it could soon enter the $1 club 🚀
But if it drops below $0.50, we may see a 30–50% retracement.
So always watch the chart closely before entering any trades.
Note: NFA & DYOR
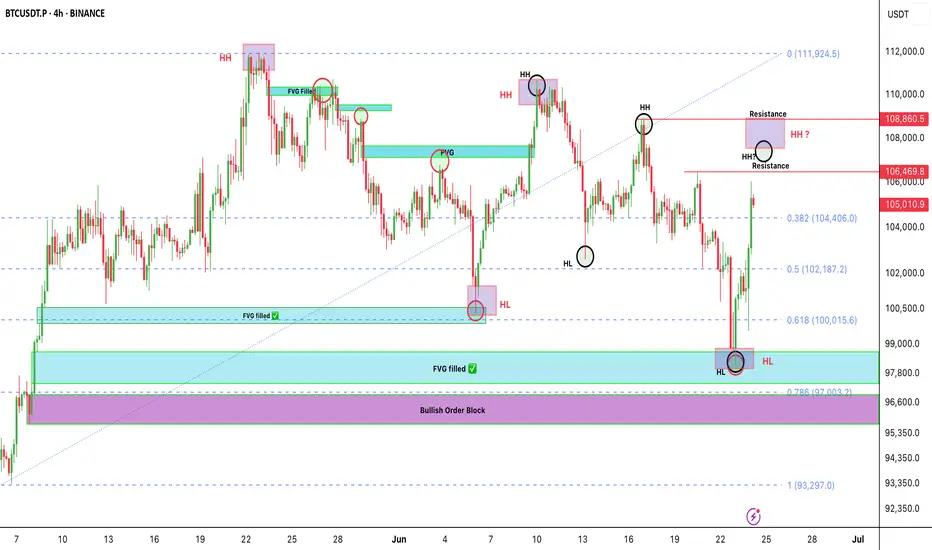
Bitcoin isn’t fully bullish yet — most people are falling for thBitcoin isn’t fully bullish yet — most people are falling for the trap
BTC just bounced beautifully from the $97.8K–$98K demand zone.
It tapped into key confluences:
✅ FVG filled
✅ 0.618-0.786 Fib level
🟪 Bullish Order Block just above 0.786
But let’s be real — we’re not in full bullish mode yet.
This looks more like a short-term pullback, not a trend reversal.
What I'm Watching Closely:
🔹 BTC is forming two HH & HL patterns.
🔹 Super important for us to track both — they’ll guide the next big move.
🟥 LTF last HH = $108,900
🟥 HTF last HH = $110,654
As long as BTC stays below these, the structure is still bearish.
We only flip bullish when candles break and close above them.
If Bullish Breakout happens? We’re eyeing new ATH targets toward $150K 🚀
My Plan Right Now:
🔹 Watching $107K & $109K levels for clean short setups.
Why?
👉 Low-risk entries
👉 Tight SL
👉 Big reward — Targeting around $100K
Stay alert, don’t chase. Let the levels come to us.
Let me know in the comments 👇 Are you flipping bullish, or still cautious?
NFA & DYOR
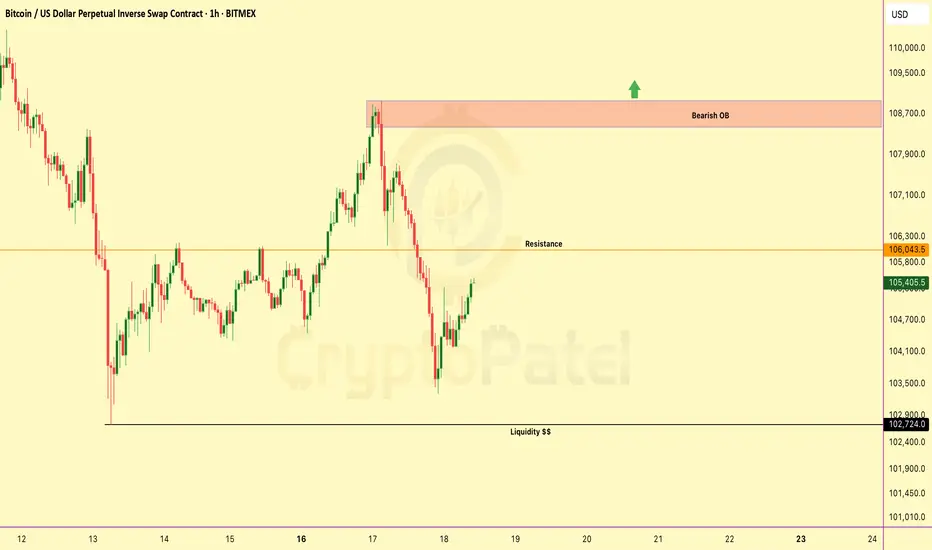
Bitcoin Ready to Blast or Waiting under $100k?BTC is currently trading near $105,399, showing a corrective bounce after a recent sell-off.
Resistance Ahead – $106k:
Price is approaching a key resistance level. A break above could lead to a short-term move toward the Bearish Order Block at $108000–$108950.
🟥 Bearish Order Block (OB):
This is the supply zone that initiated the previous drop. If price fails to break and hold above this OB, we could see renewed selling pressure and continuation of the downtrend.
🔻 Liquidity Pool – $102k:
This level holds resting sell-side liquidity. A failure to hold this area may trigger a sweep — and if $102K breaks, it could unlock deeper downside potential, possibly sending BTC below $100K.
Summary Outlook:
▪️ Rejection from OB = strong bearish continuation
▪️ Break of $106K = short-term bullish move toward OB
▪️ Break of $102K = high probability of sub-$100K levels
▪️ Overall bias remains bearish unless price reclaims and holds above the OB zone with strength.
NFA & DYOR
BTC Decision Point – Are You Watching This?BTC Decision Point – Are You Watching This?
Bitcoin is reclaiming momentum after sweeping liquidity at $102.7K. It's now pushing toward major resistance at $106.1K.
But the real battle? The bearish OB at $107.2K–$108.9K — where price nuked last time.
✅ Break above = clear skies toward new ATHs
❌ Rejection = another trip to $102K or even Under $100K
🔁 Retweet if this helped
💬 Drop your bias below: Long or short?👇

Bitcoin Dominance Rejected — Mini Altseason Incoming!Bitcoin dominance is showing early signs of weakness. It has been consistently supported by a long-term trendline, but recent price action indicates rejection from a critical resistance zone. A bearish RSI divergence confirms the weakening structure.
If BTC dominance pulls back to the 58% level, we may see a mini altseason ignite. However, a break below 54% would confirm a full-fledged altseason, unlocking massive upside potential for altcoins.
Watch levels:
Resistance zone: 60.5% – 61%
Support zone: 58%
Breakout trigger: Below 54% = Full Altseason Mode
Be ready to rotate into strong alts!
#BitcoinDominance #Altseason #CryptoAnalysis #BTC #Altcoins #CryptoBreakout

Ethereum Still down from 2018 ATHIf you had invested in Ethereum exactly 7 years ago (2,646 days),
you would be at a 7.5% loss at today’s lowest price. 😳
Yes, even ETH — one of the biggest and strongest cryptos — is down.
That’s how tough the market is right now. 🩸

Whale alert: Massive $AUCTION inflow to Binance and OKX!⚠️ Whale alert: CRYPTOCAP:AUCTION whales just dumped 14% of supply — price crashed
6 days ago, whales deposited 280,000 CRYPTOCAP:AUCTION (~$9.73M | 3.7% of total supply) to #Binance
In the past month, 4 fresh wallets accumulated a total of 2M CRYPTOCAP:AUCTION (~26.2% of the total supply) from Binance, pushing the price up by 500%
Past Month Whale Accumulation Wallets:
1⃣0xEF8Ca93cBaA3F67525c18feaF7082A247B66155B
2⃣0xEc17Da400f7e23Cc6081A53d488189Ad6C4fa09c
3⃣0xAd2E7CeB5cE3C4FD0AbD3c0d6a39646C52644403
4⃣ 0x02a16EB459fb61d1d127ADBCbfB5575F346d052f
⚠️ But today...
Whales deposited 1.08M #AUCTION (~$48.6M | 14.26% of the total supply) into Binance and #OKX, leading to a massive 66% dump in price.
Stay sharp – big moves often follow big whale activity.

Will Bitcoin Fill FVG Before the Next Leg Up?Will Bitcoin Fill FVG Before the Next Leg Up?
📌 FVG 1: $74,483 - $70,796
📌 FVG 2: $64,800 - $62,033
With liquidity gaps below, will BTC retrace before resuming its uptrend? Or are we heading straight for new highs?
Drop your thoughts! 👇 #Bitcoin #Crypto #BTC

Why Buy Bitcoin? ( Detail Post about $1M Target )Why Buy Bitcoin?
It’s hard to ignore Larry Fink and BlackRock.
At Davos, Fink said: "Bitcoin could hit $500K to $700K."
Meanwhile, top experts are making bold predictions:
🔹 Tim Draper: $250K by end of 2025
🔹 Michael Saylor: BTC = World's largest asset in 48 months
🔹 Peter Brandt: $120K – $200K by Sept 2025
🔹 Chamath: $500K by Oct 2025, $1M by 2040
🔹 Max Keiser: $200K by end of 2024
🔹 Bernstein: $200K by 2025
🔹 Fidelity: SEED_TVCODER77_ETHBTCDATA:1B per BTC by 2038-2040
🔹 Hal Finney: $10M per BTC long-term
Waiting for the headline: "Bitcoin ‘PLUNGES’ from $1,001,000 to $985,000." – CZ Binance
Are you paying attention yet? 🚀
NFA & DYOR

ANKR/USDT: Could a 25x Rally Be Coming?ANKR/USDT: Could a 25x Rally Be Coming? 🚀
SEED_DONKEYDAN_MARKET_CAP:ANKR is gaining volume, which could mean a big upward move is coming.
Important Levels:
▪️ Buy Zone: $0.035 - $0.03
▪️ Key Resistance: $0.05 (Breaking this could lead to a strong rally!)
▪️ Targets: $0.065 / $0.170 / $0.41 / $0.75
▪️ Stop Loss:
- Wider stop for bigger gains: $0.021
- Tighter stop: $0.03
Key Insight:
If the price stays above $0.03, there’s potential for a massive 5x-25x rally. Keep an eye on the $0.03 support, as it’s crucial for stopping any bearish moves.

SEI/USDT: Bullish Shark Pattern Signals Potential RallySEI/USDT has formed a bullish shark pattern and is showing a bullish divergence bounce, indicating strength.
There is now a chance to retest the $0.30 level, after which a rally is expected.
The targets are $0.58 and $1.16.
#SEI #USDT #CryptoTrading #BullishSharkPattern #BullishDivergence #CryptoAnalysis #TradingTargets #CryptoRally #TechnicalAnalysis

USDT.D Bearish Shark Pattern Signals Move to Key Support LevelsUSDT.D has formed a bearish shark pattern and has broken the support trendline, indicating a likely move towards the 4.6% and 4.10% support areas. The bearish confirmation is further supported by the RSI falling from the overbought zone and a clear bearish cross on the MACD.
#USDTDominance #BearishSharkPattern #TechnicalAnalysis #Crypto #RSI #MACD #SupportLevels #CryptoTrading

#AVAX Ready to Skyrocket: Massive Gains Ahead!Hi everyone! Today, I'd like to highlight another top altcoin: AVAX. It has found strong support at the anchored VWAP and is currently retesting a previous high area. Recently, $AVALANCHE surged to retest the previous support level from 2021, around the $65 zone, which acted as resistance. Now, it's finding support from previous highs.
The VWAP is a highly regarded indicator, often used by institutional investors. Given this, it might be an excellent time to buy AVAX, as it appears ready to soar from its current range of $20 to $22. If it retests its all-time high of $148, we could potentially see returns of up to 500% from this point.

RNDR Breakout: Triangle Pattern Leading to $20Render Token ( CRYPTOCAP:RNDR ) has formed a bullish ascending triangle pattern, a strong indicator of a potential upward breakout. Additionally, a bullish divergence has been identified, further reinforcing the likelihood of a positive price movement. RNDR is now bouncing from the trendline, showing strong buying interest and support at this level. These technical indicators suggest that RNDR could be heading towards a target of $20.
