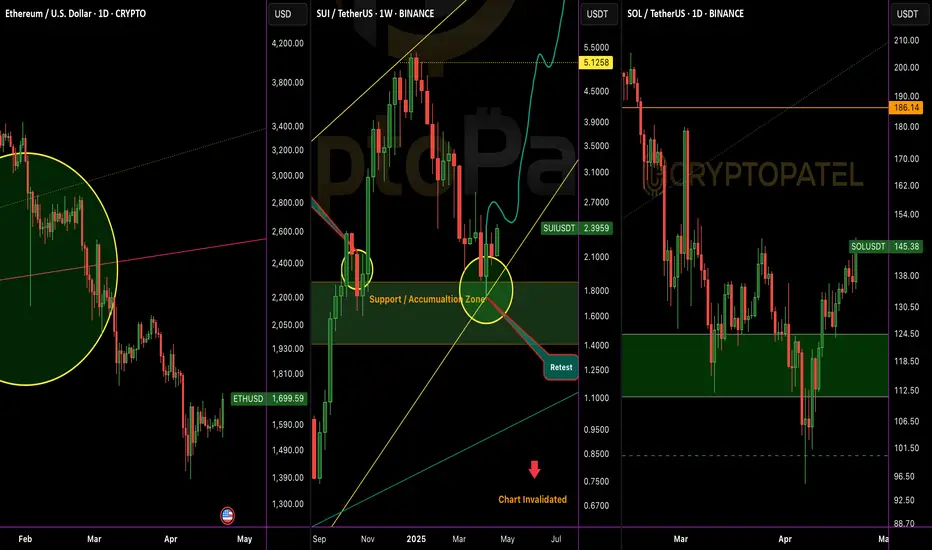
Bitcoin And Altcoins Price Difference🚨 2 months ago, #Bitcoin hit $90K and alts were flying:
CRYPTOCAP:ETH – $2,850
CRYPTOCAP:SUI – $3.50
CRYPTOCAP:SOL – $180
Today, BTC is BACK above $90K… but alts are in the dip!
CRYPTOCAP:ETH – $1,700
CRYPTOCAP:SUI – $2.40
CRYPTOCAP:SOL – $145
Never Forget to Buy at F*** Dip you Planning for Long Run
Search in ideas for "CRYPTO"
LINK/USDT 3x up from our entryLINK/USDT Update: Massive Gains Delivered 🚀
🔹 Entry Zone: $14–$10 ✅
🔹 Current Price: $30.50 (3x from our lower entry )
Chainlink ( CRYPTOCAP:LINK ) has surpassed an $18.5B market cap and hit $30 for the first time since 2021. With its strong utility and growing partnerships, CRYPTOCAP:LINK continues to show incredible potential.
Key Levels to Watch:
▪️ Resistance: $34, $52
▪️ Target: With further adoption, CRYPTOCAP:LINK could potentially reach $100 in this bull run.
Pro Tip: Always book partial profits as you ride the wave.

USDT.D FORMED BEARISH PENNET HUGE CRYPTO BULLUSDT.D has formed a bullish pennant pattern, and the daily RSI is in the overbought area. At the same time, the weekly RSI trendline has been rejected. This indicates a likely decline for USDT.D, giving the crypto market a chance to move upwards—a bullish sign for BTC and crypto. 🚀📈
#USDT.D #Crypto #CryptoMarket #BullishPennant #RSI #Overbought #MarketAnalysis #CryptoTrading #Bitcoin #BTC #Altcoins #Bullish #CryptoInvesting #TechnicalAnalysis #CryptoSignals

WILL #SOLANA HIT $500 IN THIS BULL MARKET? WILL #SOLANA HIT $500 IN THIS BULL MARKET?
1⃣ SOLANA 800% Up from Our Initial Entry Setup.
2⃣ 2021 Bull Market Solana did 250x
3⃣ Current 2024 Bull Market #SOL has given 17x so far
4⃣ IMO CRYPTOCAP:SOL has $500 Potential in the Current bull run
5⃣ Support = $80-$90, Major Support = $50
6⃣ If hold $115 Support Level then Next move toward $250
7⃣ Major Resistance = 210
8⃣ SOLANA flipped #Ethereum in 24H DEX Volume
HAPPY TRADING #CRYPTOPATEL FAM

SOLANA Calling $40 Soon ?SOLANA ALERT: CRYPTOCAP:SOL Calling $40
If #SOLANA fails to hold the $90 Support TL, be prepared for a potential -60% DUMP!
This could be a great buying opportunity for those looking to accumulate #SOL
I've already placed a Buy Order below $50
What about you?

#ETHEREUM Technical Update: $3000 Hit Exactly as Mapped#ETHEREUM Technical Update: $3000 Hit Exactly as Mapped
CRYPTOCAP:ETH has tapped the $3000 zone, exactly as projected when price was breaking down from the $4000 bearish breakdown + retest.
We’re now ~30% down from the short-entry region.
If you shorted, you booked heavy profits.
If you didn’t, at least you avoided longing the top above $4000+
This is where the prime accumulation zone begins.
Key levels to watch:
🔵 $3000: First accumulation zone + bullish OB (Possible bounce reaction from here.)
🔽 Next support: $2400
Major Accumulation Zones:
0.5 FIB: ~$2621
0.618 FIB: ~$2255
If ETH sweeps into these FIB/FVG pockets, that becomes the high-discount, prime long-term accumulation zone.
Macro view unchanged: Long-term Target: $10K–$15K
Stay patient. Stick to structure. Accumulate smart, not emotional.
NFA & DYOR

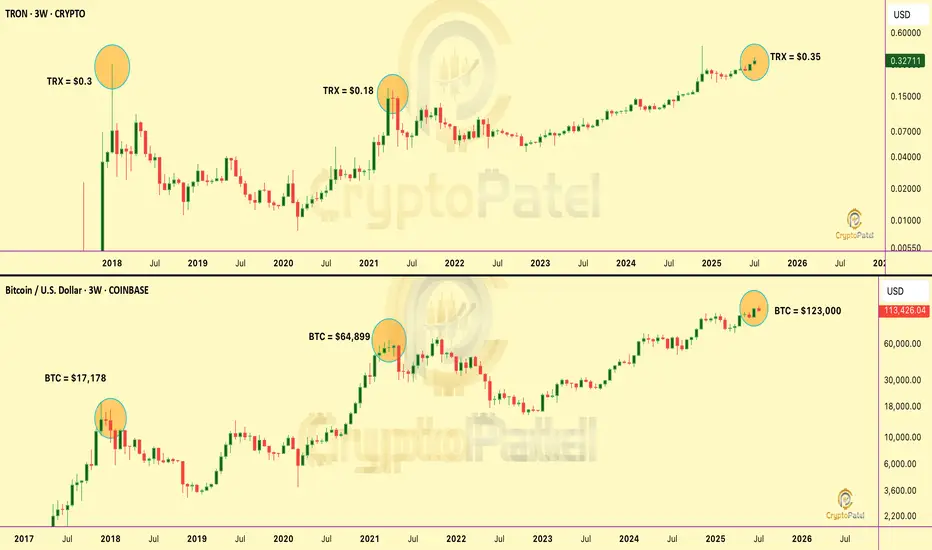
$TRX is the most slept-on asset in crypto. Here’s why🚨 CRYPTOCAP:TRX is the most slept-on asset in crypto. Here’s why 👇
📌 In Jan 2018, TRX hit $0.30 when #Bitcoin was only $17,178
📌 In 2021, TRX was $0.18 with BTC at $64,899
📌 Today BTC is $113,000, but TRX is still just $0.32
How is TRX still lagging… despite tech, adoption, and ecosystem growth?
It’s time to rewrite the narrative.
It’s time to Make TRON Great Again. #MTGA 🔺
Much respect to justinsuntron & trondao
Builders never stop. The community stands with you. 💪
NFA & DYOR
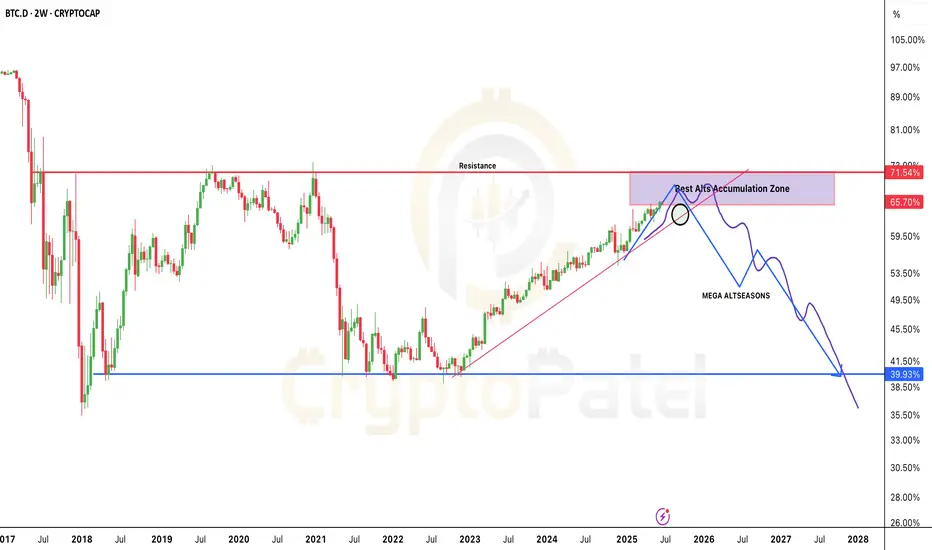
Ready for Big Altcoin season and Why?BREAKING: CRYPTOCAP:BTC Dominance is about to DUMP hard!
And that means one thing…
👉 A MASSIVE #Altseason is coming.
We’ve all been bleeding, waiting, questioning.
But this dip right now? It’s your golden ticket.
📉 Dominance is topping between 65%–72%
📈 Next stop? 40% — and altcoins will fly.
This is your chance to accumulate 10x–20x gems before the real move begins.
You may not see these prices again.
This is the final test of patience.
Survive now, thrive later.
Are you ready or still sleeping on alts?
Retweet if you're stacking.
NFA & DYOR
This BTC Pullback Could Be The Last Dip Before $120K+ — Are You #Bitcoin has just delivered a textbook breakout — but what comes next might surprise you. Let’s break it down: 👇
🔸 Bearish Order Block @ $109K–$110K
Price tapped into this zone and is currently reacting. Expect short-term volatility here.
🔸 FVG (Fair Value Gap) Filled + Tapped
A clean move back up filled the previous FVG — this typically signals strength but also invites sellers at OB zones.
🔸 Key Bullish Order Block @ $106K
If BTC pulls back, this zone will be crucial. A strong defense here could ignite the next leg up.
🔸 Fib Levels Aligned:
0.382 Fib @ ~$104.5K
0.5 Fib @ ~$102.2K
0.618 Fib & Bullish OB cluster @ ~$100K ( Filled )
Possible Play Ahead:
A dip toward $106K–$104K is healthy → watch for buyer reaction.
If CRYPTOCAP:BTC holds the $106K OB and bounces, a move back toward $112K+ ATH retest is very likely.
Big Picture:
The breakout from the descending channel + OB retest gives BTC strong bullish structure — as long as the $106K zone holds.
Are you ready for the next BTC move?
📈 Comment below: BULLISH or BEARISH?
🔄 Retweet to keep others in the loop!
NFA & DYOR

#Ethereum Breakout Attempt #Ethereum Breakout Attempt 📢
After weeks of consolidation inside this range → CRYPTOCAP:ETH is now testing a breakout above major resistance $2750
👉 If this breakout holds → we could see a BIG upward rally toward $3500–$4000 in the coming weeks. 🚀
Keep an eye on this level — the next move could be massive.

Will PolkaDot Hit $50 in near Future?Where is the #POLKADOT Army?
CRYPTOCAP:DOT is in a key accumulation zone between $4.50–$3.50, a historic demand area before major moves.
➡️ Many lost patience, but smart money builds positions here.
➡️ If market cycles repeat, a return to $50 isn’t out of reach.

will bitcoin hit $76000 again ?🚨 If you want to see #Bitcoin hit a new ATH toward $120K-$130K, it must hold the critical $91,600 support level.
Will CRYPTOCAP:BTC hold or break? 🤔
Drop your thoughts below! 👇

Bitcoin Still bearish till $55000Bitcoin remains bearish as I predicted!
CRYPTOCAP:BTC perfectly dumped from $64,200, our old Bearish OB. Now, the new Bearish OB is at $62,400. As long as we're below this level, I expect a move toward $55,000. The setup is invalidated only if a 4H candle closes above $62,400.

Bitcoin Perfectly Dumped as I Predicted as Per SMMBitcoin followed my SMM chart perfectly!
CRYPTOCAP:BTC rejected exactly from the Bearish OB at $64,000. I'm expecting further downside, and the chart remains valid unless any 4H candle closes above $64,200. If you're using leverage, consider booking profits.

BTC/USDT at Bearish Order Block#BTCUSDT Chart Analysis:
CRYPTOCAP:BTC remains bearish according to the chart. There's a bearish order block at $63,500-$64,000. If BTC fails to break the $64,000 resistance, we might see another dump soon.
Bearish OB: $63,600-$64,100
FVG: $62,800-$63,700

Etherem ready for Big Pump ?#Ethereum Chart Analysis
#ETHUSDT is currently trading within a bull flag/parallel channel. We're waiting for a breakout before entering any trades.
- Bearish Scenario:
If CRYPTOCAP:ETH breaks down below the support level at $3650, we might see a decline toward $3152, which is the last Fair Value Gap (FVG).
- Bullish Scenario:
If #ETH holds the $3152 level, we could see an upside move toward $4000.
A break above $4000 resistance could trigger a strong bullish move toward the $6000-$7000 range.
Let's watch closely and stay updated on the price action.

2024 & 2025 Bitcoin Green Yearly Candle ?After Every Red Yearly Candle... Expect Three Consecutive Green Years!
Doubts? Just zoom out on the CRYPTOCAP:BTC chart. #Bitcoin proves it's always bullish in the long run.
Are You Ready for the Green Years of 2024 & 2025?
Let's gear up for growth!
#Cryptocurrency

Bitcoin Urgent Chart UpdateCRYPTOCAP:BTC Urgent Chart Update
- #Bitcoin Rejected from HH/TL.
- We Already Profit in BTC/USDT Short Positions
- $57000 Possible Scenario
Key Levels to Watch:
$64,000: Critical! Above this, a path to $100k opens.
$65,540: Ideal stop loss for short positions.
$57,000: Breaking $57k Mean #BTC could drop to $50k
Stay alert and manage your positions carefully!

Why "V" Shape Happened Last week in #Bitcoin ?Why "V" Shape Happened Last week in #Bitcoin ?
High Risk-to-Reward Reversal Trades
- Whales in Action: Big traders can manipulate the market to fill long positions. By driving prices down, they trigger stops/liquidations, then enter positions at favorable liquidity levels. Once the liquidity is absorbed, prices reverse upwards.
- Liquidation Levels: Massive pressure on one side of the order book can lead to price reversals after liquidation levels are hit.
- All Liquidation Levels Hit: If all liquidation levels in one direction are exhausted, there's minimal liquidity left, causing a natural price reversal.
Opportunities for Traders:
1⃣ These reversals can mark local tops/bottoms, offering high risk-to-reward trades.
2⃣ Use tight stop losses and further take profits for maximum reward.
3⃣ Increase your chances by finding confluence with other indicators or support/resistance levels.
CRYPTOCAP:BTC #BitcoinETF

$BTC Risk-Managed Trading Beyond $64,500CRYPTOCAP:BTC Risk-Managed Trading Beyond $64,500
Red Box Resistance: The crucial resistance level is at $64,500. For a bull scenario, we need to see a confirmed candle close above this level.
Potential Breakout: If #BTCUSDT breaks above the red box, we could witness a rally toward a new all-time high.
Risk Warning: Only enter high leverage positions after clear confirmations to minimize risks. Proper risk management is essential.
#Bitcoin #cryptocurrency

Bitcoin Current analysis update#Bitcoin LTF Update
#BTCUSDT bounced back strongly from the $56k support.
- Key resistance at GETTEX:64K ; a break above is bullish.
- Failure to break could mean testing new lows for the year.
CRYPTOCAP:BTC

FTX Sells $230M in Solana Tokens Amid Recovery EffortsSOLANA Urgent Update: FTX Sells $230M in Solana Tokens Amid Recovery Efforts
➡️ SOL Sale Details:
▪️Amount Sold: 1.8 million #Solana tokens
▪️Buyers: Galaxy Trading and Pantera Capital
▪️Price Range: $95 to $110 per token
▪️Unlocking Period: 4 years
➡️ Market Chart Analysis Update:
▪️Current Chart Analysis: CRYPTOCAP:SOL is showing bearish signs, struggling to maintain above $127.
▪️Potential Downside: If it breaks below $127, prices could drop to between $70-$80.
▪️Historical Note: #SOL was priced at just $8 about a year ago.
▪️Important Note: Keep an eye on the red trend line; crossing it could mean Solana becomes super bearish.
➡️ Discussion Point:
Could Solana hit $50? What are your thoughts given the current market conditions and recent sales?
Join the discussion and share your views!
