Explosive Volume Breakout StocksHello Traders!
Today’s session we have an explosive breakout on record volumes. The setup is not only backed by price action but also confirmed by multiple technical indicators such as RSI, Bollinger Bands, SuperTrend, VWAP, and BB Squeeze. Let’s decode this in detail 👇
________________________________________________________________________________
________________________________________________________________________________
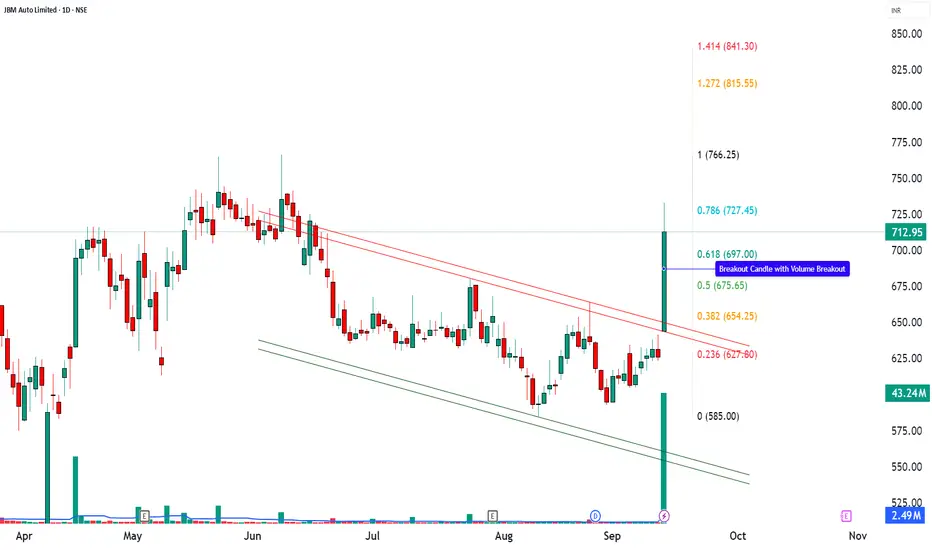
JBM Auto Ltd (NSE: JBMA)
CMP: 712.95 (+13.92%)
Breakout: Strong 52-week volume breakout with momentum
Key Supports: 660 / 608 / 571
Key Resistances: 749 / 785 / 838
Setup Explanation
JBM Auto delivered a powerful bullish breakout candle backed by 20x volume against its average, confirming strong accumulation. The stock has broken a long-term downtrend with a surge in momentum. This looks like a technically strong breakout setup as per chart patterns, but risks remain. The chart highlights multiple bullish signals: RSI breakout ⚡ shows renewed strength. Bollinger Band breakout 📊 signals volatility expansion. Bullish SuperTrend & VWAP align with upward momentum. BB Squeeze Off 🔥 confirms the end of consolidation and beginning of a trending move. As long as the stock holds above 697–712, momentum is likely to extend towards higher resistances, with 843 as a near-term swing target. A sustained close below 607 would negate the bullish structure.
Latest Update – JBM Auto (JBMA)
JBM Auto is buzzing after its subsidiary JBM Ecolife Mobility secured a $100 million investment from IFC, marking IFC’s largest e-mobility funding in India. The capital will accelerate deployment of over 1,400 electric buses across multiple states, boosting JBMA’s already strong ₹12,900 crore order book. The stock surged ~9–11% on record volumes as the news reinforced confidence in India’s EV and green mobility push.
While momentum is strong, analysts also flag elevated valuations, thin margins, and execution risks, making it important for traders to watch key levels closely.
Investment Outlook & Conclusion
Bullish Case – The stock has given a 52-week breakout with 20x average volumes. If momentum sustains, it may attempt levels of ₹749 → ₹785 → ₹815 → ₹838 → ₹843.
Bearish Case – A sustained slip below ₹622 could weaken the structure and open downside risk.
Momentum Case – Current price action with heavy volumes indicates a short-term momentum phase. However, this is a high-risk, high-reward scenario suitable only for aggressive swing setups.
Perspective – Short-term structure is positive, while long-term outcomes will depend on execution of EV bus orders, government policy support, and maintaining profitability margins.
📊 STWP Trade Analysis – JBM Auto (JBMA)
👉 In my chart study, I have marked ₹732.80 as an entry level with ₹621.95 as an invalidation level.
👉 If the stock dips towards ₹627–607 (Pullback Zone), I will treat it as a conservative re-entry with tighter risk.
Invalidation Level: A sustained move below ₹607 will negate my bullish view.
⚠️ This is my swing trading approach as long as supports hold, shared only for learning how I structure trades. It is not a buy/sell recommendation.
________________________________________________________________________________
________________________________________________________________________________
⚠️ Disclaimer – Please Read Carefully
The information shared here is meant purely for learning and awareness. It is not a buy or sell recommendation and should not be taken as investment advice. I am not a SEBI-registered investment advisor, and all views expressed are based on personal study, chart patterns, and publicly available market data.
Trading — whether in stocks or options — carries risk. Markets can move unexpectedly, and losses can sometimes exceed the money you have invested. Past performance or past setups do not guarantee future results.
If you are a beginner, treat this as a guide to understand how the market works — practice on paper trades before risking real money. If you are experienced, always assess your own risk, position sizing, and strategy suitability before entering trades.
Consult a SEBI-registered financial advisor before making any real trading decision. By engaging with this content, you acknowledge full responsibility for your trades and investments.
💬 Found this useful?
🔼 Give this post a Boost to help more traders discover clean, structured learning.
✍️ Drop your thoughts, questions, or setups in the comments — let’s grow together!
🔁 Share with fellow traders and beginners to spread awareness.
👉 “If you liked this breakdown, follow for more clean, structured setups with discipline at the core.”
🚀 Stay Calm. Stay Clean. Trade With Patience.
Trade Smart | Learn Zones | Be Self-Reliant 📊
Search in ideas for "Chart Patterns"
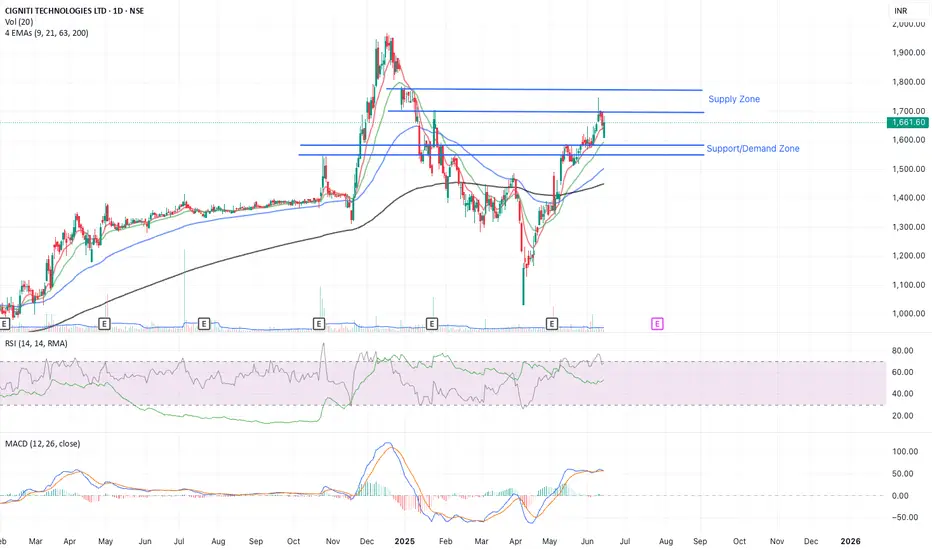
Cigniti Technologies - An analysis Cigniti Technologies - An analysis
Fundamental Outlook
Market Cap : INR 4550 cr
Almost debt free D/E ratio is 0.03, down from 0.08 in previous year
High ICR 102.37, up from 55 in previous year
PE of 20.58, IND PE is 35.93, ~0.6X of Industry PE, inexpensive stock amongst Industry peers
PEG of 1.62, decent
ROE = 26%
ROCE = 34.15% , ROCE 5yrs = 33.25%
Sales growth = 10.98%, Sales Growth 5 yrs =18.23%
Profit growth = 33.59%, Profit Growth 5 yrs = 12.71%
Promoter holding at 55.16%, significantly up in last two quarters since Co-forge acquisition
Cumulative FII/DII holding above 20%
Public holding < 25%
Sales and Profits have increased QoQ for the last 3 quarters
Sales and profits have been mostly in an upward trajectory on YoY for last 10 years
Technical Outlook
CMP : 1662
On weekly charts ,
Stock has experienced a significant downtrend and has bounced back appreciably and near ATH levels of 1900+.
LTP>EMA9>EMA21>EMA63>EMA200 - Bullish
RSI(weekly)=61
On daily charts
LTP < EMA 9 >EMA21 > EMA63 >EMA200
RSI(daily) =68, nearly overbought
Chart Patterns
No significant patterns, but stock is in overall bullish zone
Industry Outlook
Sector/Industry - IT/ITES
NIFTY has been beaten down and moving up from April 2025 lows.
A number of IT and related stocks are showing signs of turnaround and are leading/improving from a Relative Strength standpoint
Relative strength and momentum on 20 day time period is weakening.
RS = 108, relatively strong strength compared to Nifty 500
Momentum = 101, relatively Strong momentum compared to Nifty 500
Starting to leading, dips will be good investing opportunity
This scrip has significantly beaten the returns from the likes of LTTS and TATATech in the past 20 day time period
Management Guidance and Things to look forward to in next quarter
-Continued double digit revenue growth and especially in digital enegineering services
- EBITDA MARGIN of 14%
Future outlook
LTP 1662>1690>1780>1950
Disclosure 1 - Not Invested
Disclosure 2 - Not SEBI Registered
Disclosure 3 - This is Not investment advice. Treat it as educational
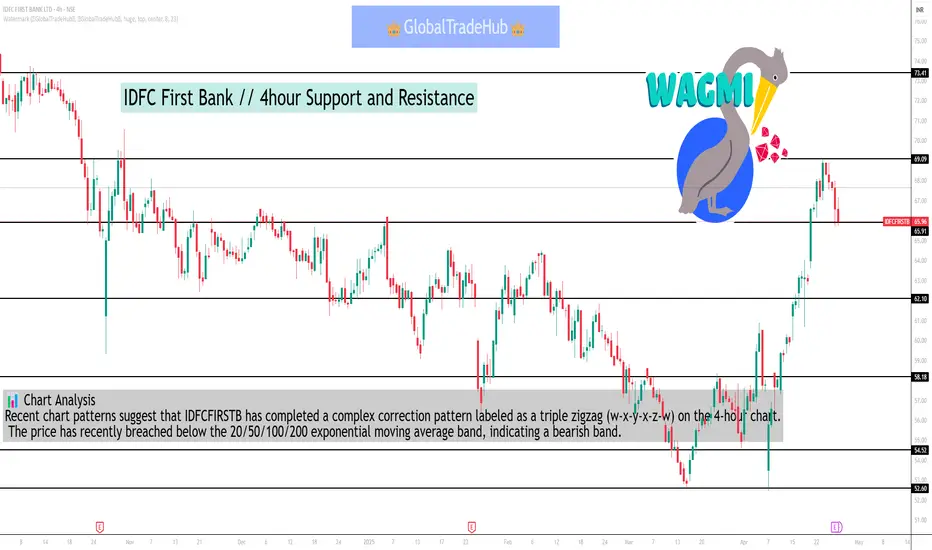
IDFC First Bank // 4hour Support and Resistance📈 4-Hour Support & Resistance Levels
Based on recent intraday analysis, the key support and resistance levels for IDFCFIRSTB on a 4-hour chart are:
Support Levels:
₹59.89 (S1)
₹59.15 (S2)
₹58.17 (S3)
Resistance Levels:
₹61.61
₹62.59
₹63.33
These levels are derived from the recent price action and can serve as potential entry or exit points for intraday traders.
🔍 Technical Indicators Overview
Relative Strength Index (RSI): Currently at 39.67, indicating a potential oversold condition and possible reversal if the price holds above key support levels.
Moving Averages:
20-day EMA: ₹56.78
50-day EMA: ₹58.88
100-day EMA: ₹61.87
200-day EMA: ₹66.42
The current price is below these moving averages, suggesting a bearish short-term trend.
Average True Range (ATR): 1.92, indicating moderate volatility.
📊 Chart Analysis
Recent chart patterns suggest that IDFCFIRSTB has completed a complex correction pattern labeled as a triple zigzag (w-x-y-x-z-w) on the 4-hour chart. The price has recently breached below the 20/50/100/200 exponential moving average band, indicating a bearish trend.
✅ Trading Strategy
Bullish Scenario: A break above ₹61.61 (R1) with sustained momentum could lead to a rally towards ₹62.59 (R2) and ₹63.33 (R3).
Bearish Scenario: A drop below ₹59.89 (S1) may accelerate the decline towards ₹58.17 (S3).
It's advisable to monitor volume and candlestick patterns for confirmation of breakout or breakdown.
High conviction stock - EMBASSY.RRI usually don't believe in patterns, since pattern trading era is gone. However, breakout works since price reacts first before the news.
It's just a perspective, a simple chart for pattern lovers.....
P.S: No Hate, only peace & Love for all traders out there!
NOTE for learners: Place the breakout levels as per the chart shared and track it yourself to get amazed!!
#No complicated chart patterns
#No big big indicators
#No Excel sheet or number magics
TRADE IDEA: WAIT FOR THE STOCK TO BREAKOUT IN LOWER TIMEFRAME AND RETRACE IF NEEDED. SL IS NEARER SUPPORT ZONE IN Daily TIMEFRAME.
PS: No new Nifty500 script can escape from me when making a breakout. :-)
Time makes money, GREEDY & EGO will not make money.
Also, magically these breakouts tend to prove that the companies turn around and fundamentally becoming strong. Also the magic happens when more diversification is done in various sectors under various scripts with equal money invested in each N500 scripts.
The real deal is when to purchase and where to purchase the stock. That is where Breakout study comes into play.
LET'S PUMP IN SOME MONEY AND REVOLUTIONIZE THE NATION'S ECONOMY!

Potential upmove - AGROPHOSCheckout an amazing breakout happened in the stock in Weekly timeframe.
IMPORTANT BREAKOUT LEVELS ARE ALWAYS RESPECTED!
NOTE for learners: Place the breakout levels as per the chart shared and track it yourself to get amazed!!
#No complicated chart patterns
#No big big indicators
#No Excel sheet or number magics
Fundamentally it can be due to any major decisions in the management or tremendous performance shown or any such positive actions. Technically, it would have shown an up-move using MA or RSI breakout or any such analysis.
I usually don't believe in patterns, since pattern trading era is gone. However, breakout works since price reacts first before the news.
It's just a perspective, a simple chart for pattern lovers.....
P.S: No Hate, only peace & Love for all traders out there!
Time makes money, GREEDY & EGO will not make money.
Also, magically these breakouts tend to prove that the companies turn around and fundamentally becoming strong. Also the magic happens when more diversification is done in various sectors under various scripts with equal money invested in each N500 scripts.
The real deal is when to purchase and where to purchase the stock. That is where Breakout study comes into play.
LET'S PUMP IN SOME MONEY AND REVOLUTIONIZE THE NATION'S ECONOMY!

Bitcoin (BTC/USD) Price Action Analysis
Introduction
Hold on to your digital wallets, fellow traders! We're diving into the latest price action of Bitcoin (BTC/USD), where the recent breakout has left us all on the edge of our seats. Let's dissect this chart and see what the crypto king is up to. 🚀💰
Price Action Overview
Chart Analysis
Current Price: $55,992.52
24-Hour High: $57,027.91
24-Hour Low: $55,909.09
Volume: 111.36 BTC (yup, that's a lot of virtual coins moving around!)
Key Technical Indicators
Rising Wedge Pattern: A bearish pattern indicating a potential reversal.
Breakout Confirmation: Price has broken below the lower trendline of the rising wedge.
Volume Analysis: Noticeable increase in volume during the breakout, hinting at strong market
participation.
Detailed Analysis
Rising Wedge Pattern
Pattern Description: A rising wedge typically forms during a downtrend and is considered a bearish continuation pattern.
Implications: The breakout below the lower trendline suggests that bears are taking control. The support might be a bit weak here, like a soggy cardboard box trying to hold up your crypto dreams.
Breakout Confirmation
Breakout Level: Around $55,992.52
Implications: The bearish breakout indicates that the price might continue to decline. Time to buckle up, this ride could get bumpy!
Volume Analysis
Volume Trend: Volume has spiked during the breakout, adding credibility to the move.
Significance: High volume during a breakout is often a strong indicator of the move's validity. In simpler terms, the crowd is chanting, and it doesn't look good for the bulls.
Support and Resistance Levels
Immediate Support: $54,600.00 - Keep an eye on this level; it might just be Bitcoin's life raft.
Immediate Resistance: $57,864.53 - The bulls need to conquer this to regain any lost ground.
Conclusion
Bitcoin has shown a bearish breakout from a rising wedge pattern with substantial volume, indicating potential for further downside. Traders should monitor the immediate support level at $54,600.00 and resistance at $57,864.53 for potential bounce or continuation points. Stay vigilant, and may your trades be as fruitful as a bull market in full swing!
Disclaimer
This analysis is based on historical data and chart patterns. Always do your own research and consider your risk tolerance before making any investment decisions.

Stock Market Analysis Report: IRCON International Limited Introduction
Hello, fellow traders! Buckle up because IRCON International Limited is on the move, and it’s picking up speed faster than a bullet train! 🚄 Let's dive into the technical analysis and see what the charts are telling us about this infrastructure giant.
Price Action Overview
Chart Analysis
Current Price: ₹307.75
Daily High: ₹315.80
Daily Low: ₹286.50
Volume: 116.643M
Key Technical Indicators
Breakout: The stock has just experienced a significant breakout.
Support Levels: Identified at ₹175.67 (Support 1), ₹214.03 (Support 2), and ₹266.25 (Support 3).
Massive Volume Buildup: Indicating strong buying interest.
Detailed Analysis
Breakout
Breakout Level: ₹307.75
Implications: This breakout suggests a strong bullish sentiment, indicating the potential for further upward movement.
Volume Confirmation: The breakout is supported by a massive volume spike, which adds credibility to this move.
Support Levels
Support 1: ₹175.67 - This is a long-term support level, providing a solid foundation.
Support 2: ₹214.03 - A medium-term support level, crucial for maintaining bullish momentum.
Support 3: ₹266.25 - The most recent support level, pivotal in the current trend.
Massive Volume Buildup
Volume Trend: The significant increase in volume suggests strong market interest and participation.
Significance: High volume during a breakout indicates robust buying pressure, often leading to sustained price increases.
Price Targets
Immediate Resistance: ₹325.00 - The next level to watch for potential resistance.
Medium-Term Target: ₹350.00 - A psychological level and potential profit-taking zone.
Long-Term Target: ₹400.00 - If the bullish momentum continues, this could be a feasible target.
Conclusion
IRCON International Limited has shown a powerful breakout with strong volume support, indicating a bullish trend. With significant support levels in place and increasing market interest, this stock could be on a solid upward trajectory. Keep an eye on the immediate resistance at ₹325.00 and watch the volume closely for further clues. Happy trading, and may your portfolio be as strong as IRCON’s infrastructure projects! 🏗️📈
Disclaimer
This analysis is based on historical data and chart patterns. Always do your own research and consider your risk tolerance before making any investment decisions.

Stock Market Analysis Report: Lupin Limited (NSE: LUPIN)
Introduction
Greetings, traders! If you're looking for a pharmaceutical stock that might just cure your portfolio blues, look no further than Lupin Limited. This stock is brewing up an interesting pattern that’s worth a closer look. Let’s dive into the technical details and see what’s in store!
Price Action Overview
Chart Analysis
Current Price: ₹1,759.30
Daily High: ₹1,767.00
Daily Low: ₹1,598.25
Volume: 10.039M
Key Technical Indicators
Bearish Gartley Pattern: The chart reveals a bearish Gartley pattern, suggesting a potential reversal.
Rectangle Pattern with Potential False Breakout: The price is within a rectangle pattern, hinting at a potential false breakout.
Decreasing Volume: The volume is on a decline, which could signal weakening momentum.
Detailed Analysis
Bearish Gartley Pattern
Formation: The Bearish Gartley pattern, marked by points X, A, B, C, and D, indicates a potential reversal from the current uptrend.
Implications: This pattern suggests that the stock might face resistance at the current levels and could potentially see a pullback.
Rectangle Pattern with Potential False Breakout
Rectangle Pattern: The stock price is trading within a rectangle pattern, showing consolidation between support and resistance levels.
False Breakout: The current breakout might be a false one, as indicated by the rectangle pattern and the resistance at point D.
Decreasing Volume
Volume Trend: The decreasing volume trend suggests that the current upward momentum might be losing steam.
Significance: Lower volume during a breakout can indicate a lack of strong buying interest, increasing the chances of a reversal.
Price Targets and Support Levels
Immediate Resistance: ₹1,800.00 - This is the next resistance level to watch closely.
Support Levels:
Primary Support: ₹1,600.00 - A key level to maintain for bullish sentiment.
Secondary Support: ₹1,400.00 - A more conservative support level aligning with previous consolidation areas.
💊📉
Conclusion
Lupin Limited is showing a bearish Gartley pattern with a potential false breakout within a rectangle pattern. The decreasing volume adds caution to the current bullish momentum. Keep an eye on the resistance level at ₹1,800.00 and monitor the volume to gauge the strength of the current trend. Happy trading, and may your portfolio stay healthy and robust! 🌿💰
Disclaimer
This analysis is based on historical data and chart patterns. Always do your own research and consider your risk tolerance before making any investment decisions.

JK Paper Ltd Stock Analysis: Breakout with Volume Signals BullisJK Paper Ltd (NSE: JKPAPER) has exhibited a significant bullish breakout on its long-term chart, suggesting potential for further upside. Here's a detailed analysis of the stock's technical indicators:
Breakout Confirmation:
The stock has successfully broken above a key resistance level around 450 INR, accompanied by increased trading volume. This breakout signals strong buying interest and could indicate the start of a new uptrend.
Support and Resistance Levels:
Current Resistance: The previous resistance at 450 INR may now act as support.
Next Potential Resistance: 500 INR (psychologically important level)
Strong Support: 303 INR (based on previous price action)
Volume Analysis:
The breakout is supported by a significant increase in trading volume, lending credibility to the price movement. This suggests institutional participation and increased investor interest.
Price Action:
The stock has formed a series of higher lows and higher highs since 2021, indicating a long-term uptrend. The recent breakout reinforces this bullish trend.
Momentum:
The sharp upward move following the breakout suggests strong momentum. However, traders should be cautious of potential short-term overbought conditions.
Future Outlook:
If the breakout holds, the stock may target the 600 INR level in the medium term. However, a pullback to test the breakout level as support is possible and could offer a potential entry point for investors.
Risk Management:
Investors should consider placing stop-losses below the breakout level to manage downside risk.
Trading Strategy and Future Targets for JK Paper Ltd (NSE: JKPAPER)
Based on the recent breakout and technical analysis, here's a comprehensive trading strategy and potential future targets for JK Paper Ltd:
Entry Strategy:
a) Breakout Entry: Enter on a successful breakout above 450 INR with confirming volume.
b) Pullback Entry: Wait for a potential pullback to the 450-460 INR range and enter on signs of support.
Position Sizing:
Allocate no more than 2-3% of trading capital to this position to manage risk effectively.
Stop Loss Placement:
Set initial stop loss at 435 INR (just below the breakout level) to protect against false breakouts.
Target Levels:
Short-term Target: 520 INR (+15% from breakout)
Medium-term Target: 600 INR (+33% from breakout)
Long-term Target: 700 INR (+55% from breakout)
Conclusion:
JK Paper Ltd's technical chart presents a bullish scenario with the recent volume-supported breakout. While the long-term trend appears positive, investors should monitor for pullbacks and use appropriate risk management strategies.
Disclaimer: This analysis is based on technical indicators and chart patterns. Investors should conduct their own research and consider fundamental factors before making investment decisions.

Amazing breakout on Weekly / Daily Timeframe - RENUKACheckout an amazing breakout happened in the stock in Weekly timeframe, macroscopically seen in Daily timeframe. Having a great favour that the stock might be bullish expecting a staggering returns of minimum 25% TGT. IMPORTANT BREAKOUT LEVELS ARE ALWAYS RESPECTED!
NOTE for learners: Place the breakout levels as per the chart shared and track it yourself to get amazed!!
#No complicated chart patterns
#No big big indicators
#No Excel sheet or number magics
TRADE IDEA: WAIT FOR THE STOCK TO BREAKOUT IN LOWER TIMEFRAME AND RETRACE IF NEEDED. SL IS NEARER SUPPORT ZONE IN Daily TIMEFRAME.
PS: No new Nifty500 script can escape from me when making a breakout. :-)
I usually don't believe in patterns, since pattern trading era is gone. However, breakout works since price reacts first before the news.
It's just a perspective, a simple chart for pattern lovers.....

USDT.D: Identifying a Falling Wedge#USDT Dominance (USDT.D) Analysis
#Current Technical Setup
**Timeframe**: 4-hour chart
**Patterns Observed**:
1. **Bullish Divergence**: USDT.D has formed a bullish divergence, indicating potential upward momentum. Bullish divergence occurs when the price makes lower lows, but the oscillator (such as RSI or MACD) makes higher lows, suggesting weakening downward momentum and a possible reversal to the upside.
2. **Falling Wedge**: The chart is currently forming a falling wedge pattern, a bullish reversal pattern. This pattern is characterized by converging trend lines sloping downward, indicating a potential break to the upside if the price manages to break out above the upper trend line.
#### Key Resistance Levels
1. **5.18%**: This is the initial resistance level that USDT.D might encounter after a breakout from the falling wedge. It marks a significant level where the price has previously faced selling pressure.
2. **6.2%**: If USDT.D successfully breaks above the 5.18% resistance, the next major resistance level is at 6.2%. This level represents a more substantial barrier and could be a pivotal point in determining the continuation of the upward trend.
#### Support Levels and Bearish Scenario
1. **4.5%**: If USDT.D fails to sustain above the current support level within the falling wedge, it could experience a significant decline, with the next support level at 4.5%. This would represent a bearish scenario, suggesting a potential plunge in USDT dominance and possible increased risk appetite in the broader cryptocurrency market.
### Detailed Description
**Bullish Divergence**: The presence of a bullish divergence on the 4-hour chart is a positive sign for USDT.D. Divergences are powerful indicators that often precede significant price movements. In this case, the divergence suggests that despite the recent downward price action, the selling pressure is diminishing, and buyers may soon gain control.
**Falling Wedge Pattern**: The falling wedge is a well-known bullish reversal pattern. It indicates that while the price is falling, the downward momentum is slowing down, and a breakout to the upside is likely. Traders often look for confirmation of this pattern by waiting for the price to close above the upper trend line with increased volume.
**Resistance Levels**:
- **5.18%**: This level is crucial as it has acted as resistance in the past. A break above this level would likely attract more buyers, pushing the price higher.
- **6.2%**: A further move to this level would confirm the strength of the breakout. It is a more significant resistance level and could determine whether the bullish trend continues.
**Support Level at 4.5%**: If USDT.D fails to hold its current support level and breaks downwards, a decline to 4.5% is possible. This would indicate a bearish turn and suggest that traders are moving away from USDT into other assets, reflecting a more risk-on sentiment in the market.
#Conclusion
USDT.D is at a critical juncture with a bullish divergence and a potential falling wedge pattern. The key resistance levels to watch are 5.18% and 6.2%. A break above these levels would confirm the bullish outlook. Conversely, failure to hold support could lead to a decline to 4.5%, indicating a shift in market sentiment. Traders should closely monitor these levels and patterns to make informed decisions.

Tirumalchm: A Promising Reversal - Golden Zone Bounce Tirumalchm, a notable entity in the market, is currently revealing a compelling narrative on its charts that has captured the attention of traders and investors alike. The stock is showcasing a noteworthy reversal, bouncing from the golden zone and marking a breakout on a larger time frame, presenting a potentially lucrative opportunity.
The recent reversal from the golden zone, a key technical area often associated with trend reversals, adds an intriguing dimension to Tirumalchm's chart analysis. This bounce signals renewed investor interest and confidence, suggesting a shift in the stock's trajectory.
What further enhances the appeal of Tirumalchm is the breakout observed on a larger time frame. Breakouts on longer time frames often carry more significance, indicating sustained momentum and a potential trend reversal. Investors keen on capturing trends over an extended period may find this breakout particularly appealing.
As traders and investors consider Tirumalchm, it becomes crucial to conduct thorough research, combining technical analysis with an understanding of the company's fundamentals. The confluence of a reversal from the golden zone and a breakout on a larger time frame provides a comprehensive picture of the stock's potential.
Risk management remains paramount in trading decisions. Monitoring market conditions, staying informed about industry trends, and aligning positions with personal risk tolerance are essential practices for those considering opportunities presented by Tirumalchm's recent chart developments. Seeking advice from financial professionals or advisors can provide valuable insights tailored to individual trading strategies and risk profiles in light of these promising chart patterns.

Cup pattern breakoutOn the monthly chart, the stock has recently undergone a noteworthy breakout from a cup pattern. Cup patterns are recognized by a rounded bottom formation, often signaling a potential bullish reversal in market sentiment. The significance of this breakout is heightened when observed on a monthly timeframe, as it provides a more comprehensive view of the stock's long-term trends.
Analyzing a breakout on the monthly chart implies a more extended perspective, suggesting that this development could have lasting implications. Monthly chart patterns are generally considered to carry more weight, making them particularly influential in shaping market sentiment over an extended period.
From a technical standpoint, the breakout from the cup pattern on the monthly chart implies a potential shift in the stock's long-term trend. This could be interpreted as a positive signal by technical analysts, potentially attracting attention from traders and investors seeking sustained opportunities.

PostMortem on BankNifty Today & Analysis of 21 Mar 2023Today was a different day for me personally, i almost lost focus at around 10.30am & i posted the same in banknifty minds. "$BANKNIFTY i have no clue on the direction - options data/flow is confusing today"
I normally use options flow/data to guess the direction of NSE:BANKNIFTY rather than the direct candle stick or chart pattern. Options data usually does not give false signals unlike chart patterns.
From the open till 12.40 i did not see the options premium or skew happening which prompted me to post that message. Since i dont do straddles - the best non-directional trade was out of my arsenal.
The reason i dont rely on straddles is because of current global scenario. Any time in the day the volatility can shoot up & kick your teeth even before you know it. Most of the traders are pre-determined that they are ready to take a loss to make a profit later.
I do not trade with the mindset to lose. Not that i dont lose money, but i dont make a plan to set a loss amount first & then plan for a lottery kind of win. I usually wait for high probability trade scenarios & only commit when conditions are favorable.
The small range we were in till 12.40, straddlers who held on till 12.40 would have made decent gains due to the time decay.
But who did not square off would have seen their call options go way in the money & the losses quadrupled.
The upmove really started at 12.00 and gained upto 1.42% ~ 558pts by 14.50. This gain shows 2 major things
The bulls are still having lot of faith in the NSE:BANKNIFTY that they could drive up the demand even from the low point of the day.
The important resistance of 39742 is broken on the 5mts, 15mts & 1hr chart which means further rally is in the cards.
At 13.14 i posted this "$BANKNIFTY 39742 resistance has to be broken for a bias change"
I ended up on the losing side as i strongly felt the rally will not break the resistance. Once it broke it i placed some orders to short the PEs - but they missed the price targets by 10paisa :(
And my 39500/39400 4:5 ratio spread is sitting at a loss !
---
For the 15mts TF, we discussed yesterday about the possibility that it could be in a range. Today's resistance break give it wings. It could soon scale upwards if we have a decent US market close today.
---
1hr TF is interesting as bank nifty is back in the range of 39742–41624 after a gap of 7d 22hr ~ 40 hrs.
Since NSE:BANKNIFTY is back in the range - it brings in excellent range based trade possibilities. Iron condor, Iron fly & even credit spreads could work wonders if deployed & adjusted correctly.
---
Contra view: looking at the bank nifty components i did not see a spike in volumes in these banks when the 39742 resistance was taken out.
There is a small probability that it could even be to adjust for the Finnifty expiry - if thats the case then the 2nd half of tomorrow we could see a crash that will take bank nifty below the recent swing low.

Bitcoin Smart Money Trade SetupOur trade is based on the Smart Money Concept, which is a strategy that seeks to identify and follow the trading activity of large institutional investors, also known as "smart money." To do this, we will be following four key steps to identify trade levels:
Step 1: Structure Identification on hourly time frame- We will be analyzing the hourly chart to identify key levels of support and resistance , which can provide insight into where the price of the asset is likely to move. This will involve identifying trendlines , Fibonacci retracements, or other chart patterns that can give us an idea of the underlying structure of the market.
Step 2: Imbalance move- This step is about identifying the movement of institutional investors, also known as "smart money". By analyzing the buying and selling activity of these large players, we can get an idea of where the market is likely to move in the future.
Step 3: Point of Interest- This step is about identifying specific levels or patterns on the chart that are of particular interest to us, based on the institutional move from step 2. This could include a key level of support or resistance, a pattern that has formed on the chart, or an indicator that is giving a specific signal.
Step 4: Trade Setup- This step is about determining where to enter and exit the trade, based on the information we've gathered from the previous steps. We will be setting our entry and exit levels, as well as our target and stop loss levels.
It's important to keep in mind that trading always carries a risk and it's important to understand the risk management and have a well-defined strategy before making any trade. Additionally, the smart money concept is a strategy that requires a good understanding of market structure and institutional behavior, which can be challenging.
The entry level is 22925, the target is 23555 and the stop loss is 22840

XNGUSD ( Upside) Bullish moment is possible in long term.XNGUSD is making Falling Wedge Pattern as shown in the figure. Its in a Day chart and respecting trendlines completely. A very strong support point at the downside in daily and weekly chart patterns.
1) Day chart is making Falling Wedge Pattern
2) More than 56% downfall from the Top.
3) Respecting Trendlines completely.
4) Defiantly, it will take time to recover this big fall.
5) Bullish moment is strongly recommended from this point now.
Take Small Small lots in the upside directions.

What we see by analyzing the pharma index with 2 theories.Hey.. What do we get if we analyse one chart with two different theories ?
Is it a good idea ?
We use different techniques and methods to analyse a chart.
Some traders use chart patterns, some use moving averages and others use any other technique.
We all did the analysis to determine the trend of that instrument.
What if we use two different theories for the analysis ?
It will give us a more accurate view for that instrument.
Lets check the analysis Nifty Pharma Index Daily Chart by 2 different theories of Chart Patterns and Exponential Moving Averages.
Chart Pattern
A symmetrical triangle pattern appears on the chart.
And today we see the Breakdown of the pattern.
The breakdown of the pattern shows the weakness of the index.
Exponential Moving Averages
For this we use four exponential moving averages of 20, 50, 100 and 200 periods.
We start from the 20th of Jun 2022 when the price is below the all exponential moving averages.
From that day the price started its upward move and it crosses all ema's one by one
and finally it reached at 200ema on 5th of Aug 2022.
During the period of 3 months the all 4 ema's come close to each other.
But the price has failed to cross the 200 ema and it starts its downward move.
From 22nd of Aug 2022 the price tested its 20 ema and 50 ema but has failed to hold them.
Finally on the 16th of Sep 2022 the price closed with a big red candle.
The price traded below to all 4 ema's shows the weakness and start of a downtrend.
Conclusion:
From both theories we see the weakness in the pharma index.
So, the stocks of the sector show the bearish move in the coming days.
This explanation is for educational purposes.
My only intention is to share my style and techniques of analysis.
Thanks

BTCUSD Bybit Chart Analysis August 31
Hello.
“Make it simple, make profit”
It’s BitcoinGuide.
Don’t forget to
“Follow” me and press “Likes”.
If you "follow" press,
Only 30 Min chart ,
In real time, you can check major sections and move,
Real-time "update I dea" can be checked.
I will begin BTCUSD Bybit Bitcoin Chart Analysis for August 31.
Bitcoin 4 hour chart.
The evening trend followed the Nasdaq and plunged for no reason.
After yesterday's double touch,
In the morning, beat rebounded to somehow survive alone
Ignoring charts, patterns and waves
They are giving and receiving each other in a narrow range of fluctuations.
It is a movement to see if chart analysis has any meaning.
It is currently undergoing a V-shaped rebound.
Touching the red resistance wire
All patterns that were broken yesterday are restored.
Today's approximate top price and bottom price are displayed
I want to put the bottom near the green support line, but
Due to the whims of the Nasdaq, I proceeded to the bottom with room.
Check the red upward / sky blue downward movement path centered on the purple support line
I made today's trading strategy.
Arrow movement path, one-way long position strategy.
Non-fat short according to Nasdaq / Long non-fat in the morning
Now, all movements can come out.
This is the place with the most junctions.
I thought the analysis would take all day, so I decided to win.
There are no indicators to be announced today, so don't worry about bad news/collapse.
Nasdaq is also rebounding.
We focused on vertical rise with a probability of about 5%.
It is a strategy that ignores sideways or vertical declines.
Please refer to the main support lines.
* When the arrow moves
Long -> Short -> Long -> Short -> Long Switching Strategy
You can operate the switch in the middle by yourself.
I started with a long position chasing $20361.5.
If it breaks the purple support line,
Note the green support line.
At the bottom, we boldly raised the price to the bottom.
1. 20361.5 USD long position entry price / Stop loss price when the purple support line is broken
2. $20782.5 short position switching / Stop loss when breaking through the sky blue resistance line
3. 20449 long position switching / Stop loss when the purple support line is broken
4. $21178.5 long position target and target section
The last short position operation section is operated autonomously.
If today's strategy is successful
On spot exchanges, good moves can come from major altcoins.
My analysis is for reference only.
In principle, stop-loss is essential, I hope that you operate safely.
thank you.

NEWGEN SOFTWARENSE:NEWGEN
======================================================
📈 Swing / Positional Trade - Daily Chart | Pre-Breakout 📈
Buy = 635 (Breakout)
Stop-loss = 610
Target's = 705 / 755
R:R = 1:4.8
Chart Patterns = Rectangle, Head and Shoulders
#ThankU For Checking Out My Content , I Hope U Liked IT ✅
======================================================
📈 Technical / Fundamental Reason's To Trade 📈
Clean & Simple Chart Patterns
Tight Consolidation
Above - 200DMA & 20/50 EMA
Fundamentally Also looks Good
📈(Risk Must Be Managed.)
🙄Keep Your Eyes On Index
======================================================
Guys Check Out MY Related Ideas As Well, You Will Found Them Really Useful
FOLLOW 🤝 | LIKE 👍 | COMMENT ✍
--------------Any Suggestions--------------

Bank Nifty 17-01-2022According to the chart analysis, Bank Nifty is quite bearish. As you can see in the chart there is a head and shoulder pattern, although it is not an ideal one, it can show its significance once it breaks the respective trend line. If Bank Nifty opens in a Bullish way then you can expect a decent volatile session as the India Vix is only 1.5% up. This market is the exactly the type of market where the sellers can eat the premium and take advantage of the decay by selling an out-of-the-money option.
.
.
.
.
.
.
.
.
.
.
.
.
.
.
*Disclaimer*- This is just an analysis of the data on the basis of technical factors such as chart patterns, candlestick patterns, trend line , option chain data, etc,. Stock Market or Trading in any type of market is subject to high financial risk. You should see this idea as just an analysis. You are not obliged to follow my instructions. You will be responsible for all types gains or loses in the market.

Finolex cables case studyFinolex Cable spot CMP : 455
Study :- Price action + chart patterns + Elliot wave
Time Frame :- Daily
There is Rising channel formation, currently price is around the demand line of long term structure, on smaller range of time frame there is formation of symmetrical triangle formation, which have demand line around current levels. so there are 2 structure formation as per chart patterns and both have demand levels around current levels. confluence of demand levels gives more confirmation of reversal.
Counter have demand zone as per price action, which can be considered as a retest of previous break out levels, demand zone is marked on the chart which almost confluence with the demand levels of chart pattern structure.
Elliot wave formation :- counter at present look to be in corrective wave 4 of impulse phase and is about to mature, if major wave 4 matures and major wave 5 unfolds for the demand zone reversal can be seen and much higher level possible as per calculation of major wave 5 maturity.

IndusInd Bank- A stock that can fly HIGHIndusind bank is making great chart patterns. One of them is already posted as symmetrical triangle where stock now has no area left to move so sooner or later it will breakout either way.
Let me show something in monthly chart:-
Above chart shows how beautifully this stock respects 20 SMA .Earlier when it was trading above 20 SMA it was always coming back to average itself and started new journey. and when it was trading below that it came back and fell again.
Its been a while now that it is trading above 20 SMA and has been consolidating for several months.
Another chart with Long term targets:-
Hope this will help investors and traders in some way.
Keep an eye ladies and gentleman.
Fingers crossed. Happy Trading.

Late night Technical analysis talk We discuss potential stocks provided by you guys only in my DMs and comment sections so give your stocks in comments and DM me for tommorows video :)
👑 Terms used if you don't know :
✣ Contraction pattern: A pattern starting with a broadening high candlestick and low candlestick and converging to a fixed point, these highs and lows created in between them are bulls vs bears fight going on inside the pattern and if it comes to the lower part of it, surely bulls will take it to the topmost point and vice-versa until one of them wins
✣ Structure and trend: Two types of trends that exist in the market today are uptrends and downtrends. Each type of trend tells a different story and has its own impact on a trader's success in the market. While uptrends show a series of higher highs and higher lows, downtrends show lower highs and lower lows
✣Breakout: Breakouts are commonly associated with ranges or other chart patterns, including triangles( HERE WE WILL SEE THIS ONE ), flags, wedges , and head-and-shoulders. These patterns are formed when the price moves in a specific way which results in well-defined support and/or resistance levels. Traders then watch these levels for breakouts
✣ RSI DIVERGENCE: A bullish divergence occurs when the RSI creates an oversold reading followed by a higher low that matches correspondingly lower lows in the price. This indicates rising bullish momentum, and a break above oversold territory could be used to trigger a new long position.
✣ Supply/ Demand: In the supply zone , the prices are higher than the bid price, and in the demand zone , they are lower. The bid price is what a trader is willing to pay for a stock
👑 Important levels - explained well
👑 Comment your thoughts and queries regarding anything on this analysis of mine, feel free buddy :)
⌛ Motivational and psychological area ⌛
✣Trade only if you are in the right mindset, if you have been emotionally weak for some time, take your time and don't trade, trade with a happy and + mindset only.
✣If you want to make money, firstly be prepared to lose it, only that much which you can afford and that much by which you can make a mistake again, learn from them and grow
✣Don't lose hope and keep grinding
✣I have seen my friends on youtube streaming games with watching 10, constantly they streamed for a year or two and now they are buzzing with 1k to 2k watching daily.
✣Focus on the process, you are here to make money not stupid decisions and lose it all
✣No one will help you climb the mountain, few will tell the path, so follow good people, make good mentors and make good decisions and choices in the stock market.
✣Believe in yourself :)
🎓🎓 Some info about me :)
➼My name is Apoorv and I am a 2nd year Engineering student, I want to pursue trading as my career, and thus whatsoever setups or trades I potentially see on my charting platform, I post it here and share them with you all.
➼I hope you will love my simple analysis style.
➼Feel free to suggest your view on this as learning is earning here :)
➼I take my trades on my Zerodha account :)
➼I don't take all the trades I post
➼These charts are my and only my work, my thought process, just from an educational point of view and no calls.
