BAJAJ HOUSING FINANCE LTD. SHORT TERM TRADING IDEA This updated chart includes a **Falling Wedge pattern**, which adds a significant layer to the analysis. Here's a detailed breakdown:
---
### **1. Price Action and Chart Patterns:**
- **Falling Wedge**:
A Falling Wedge is a bullish reversal pattern in which the price consolidates within a narrowing downward-sloping channel.
- The breakout above the upper trendline of the wedge (confirmed with volume) signals a bullish reversal.
- This wedge breakout aligns with the recent price surge above **₹141.50**, adding credibility to the bullish trend.
- **Breakout Confirmation**:
- The price has broken out of the wedge and is trading above the previous resistance of **₹141.50**, suggesting further upside potential.
---
### **2. Indicators and Supporting Signals:**
#### **(a) Volume:**
- The breakout is accompanied by a noticeable spike in volume, confirming the validity of the wedge breakout.
#### **(b) MACD:**
- **Bullish Divergence**: The price formed lower lows, but the MACD histogram formed higher lows. The breakout further validates this divergence.
#### **(c) RSI**:
- The RSI continues to rise, currently at **59.22**, approaching the bullish zone (above 60). This indicates increasing strength in the trend.
---
### **3. Key Levels:**
- **Support Levels**:
- Post-breakout, the previous resistance at **₹141.50** now acts as immediate support.
- The next strong support lies near **₹128.26** (lower band of the breakout zone).
- **Resistance Levels**:
- The next resistance levels are at **₹152** and **₹160**.
---
### **4. Observations and Conclusion:**
- **Trend Reversal**: The Falling Wedge breakout, confirmed by volume and bullish divergence, indicates a strong trend reversal.
- **Momentum Build-Up**: MACD and RSI are showing signs of increasing bullish momentum, which supports the continuation of the uptrend.
- **Trading Opportunity**:
- **Entry**: On retest of ₹141.50 or during dips.
- **Target**: ₹152–₹160 in the short term.
- **Stop-Loss**: Below ₹134.43 to manage risks effectively.
---
This chart strongly suggests the start of a bullish phase, supported by technical patterns and indicator alignment. It's a good setup for traders looking to ride the breakout while managing risks properly.
Search in ideas for "Chart Patterns"

SELAN: Symmetrical Triangle & VCP Setup – Ready Pullback RallyTitle: "SELAN: Symmetrical Triangle Breakout & VCP Setup – Ready for a Pullback Rally"
Stock: Selan Exploration Technology Ltd. (SELAN)
Analysis:
SELAN is demonstrating strong technical and fundamental characteristics. The stock has retraced to fill the gap and started to rebound from support areas, indicating the potential for a near-term pullback rally.
Chart Patterns:
Symmetrical Triangle: A classic breakout setup in progress.
VCP Formation: For others, it can be interpreted as a Volatility Contraction Pattern, supporting the bullish structure.
Key Levels:
Upside Resistance: ₹990–₹1078 (stiff resistance zone). A breakout above ₹1078 could lead to fresh upside momentum.
Support Zone: ₹760–₹680 on the downside, providing a solid cushion.
Momentum Indicators:
Monthly RSI: Showing strength and gaining momentum, supporting the pullback potential.
Piotroski Score: SELAN scores an impressive 7/9, indicating strong financial health.
Financial Highlights:
Quarterly Net Profit: ₹21 Cr, an outstanding 126.8% YoY growth, reflecting excellent financial performance.
Trade Plan:
Entry: At current levels with confirmation of continued rebound.
Target: ₹990 (initial resistance), ₹1078 (key resistance). Further upside expected on breach of ₹1078.
Stop Loss: Below ₹760 to manage downside risks.
Note: SELAN’s combination of robust fundamentals, impressive RSI, and strong chart patterns positions it for a potential breakout rally. Watch for volume confirmation near resistance levels to validate the upward move.
Disclaimer:
This analysis is for educational and informational purposes only and should not be considered as financial advice. Please conduct your own research or consult a financial advisor before making any investment decisions.

Zeel Trading View: Bullish Momentum Signals Potential Breakout tZeel has been exhibiting promising signs of bullish momentum in recent trading sessions, hinting at a potential breakout above the 150 mark. This surge in momentum suggests a favorable outlook for the stock, with the possibility of a sustained upward trend towards the 180 level. In this analysis, we'll delve into the technical indicators and market dynamics supporting this view.
Technical Analysis:
Breakout Above 150: Zeel has shown resilience around the 150 level, indicating strong buying interest. A decisive breakout above this key resistance level could trigger further buying pressure and propel the stock towards higher price targets.
Moving Averages: The moving averages, particularly the 50-day and 200-day moving averages, are trending upwards, suggesting a bullish sentiment in the medium to long term. This reinforces the positive outlook for Zeel's price action.
Volume Analysis: Accompanying the recent price surge, trading volume has notably increased, indicating significant participation from buyers. Elevated volume during price advances typically validates the strength of the prevailing trend, enhancing the probability of further upside movement.
Relative Strength Index (RSI): The RSI indicator is currently indicating bullish momentum, with Zeel's RSI hovering in the overbought territory. While this may signal a potential short-term pullback, it also suggests underlying strength in the stock's uptrend.
Chart Patterns: Additionally, chart patterns such as ascending triangles or bullish flag formations may be observed, further supporting the bullish case for Zeel.
Market Dynamics:
Sectoral Momentum: Zeel operates within a sector that is witnessing heightened investor interest and positive sentiment. Favorable industry dynamics and company-specific catalysts could fuel further upside potential for Zeel.
Fundamental Factors: Fundamental factors such as strong earnings growth, favorable industry trends, and potential corporate developments could act as tailwinds for Zeel's stock price.
Conclusion:
With the stock poised for a potential breakout above the 150 level, Zeel presents an attractive opportunity for traders and investors alike. The confluence of bullish technical indicators, robust trading volume, and favorable market dynamics suggests that Zeel may be on the verge of a significant uptrend. While short-term volatility may be expected, a sustained move above 150 could pave the way for Zeel to target the 180 level and potentially beyond. As always, traders should conduct their own research and risk assessment before making any investment decisions.

JUBILIANT INDUSTRIES LOOK GOOD...➟ Everything on Chart !!!! ➘
📌 I have found 15 new patterns on the charts. These are original and unique patterns that can achieve their target almost 80-90% times. Here, I have posted one of my favourite 💕 chart patterns.
☆ I will post the remaining patterns one by one every month. For more, you can check out my previous studies 😍 as well.
☆ Follow me @ tradingview for more updates. Kindly like the chart ❤ & share this analysis.
☆ Thank you. Happy Trading!!!
Best Regards,
JINESH MEHTA
GROW MORE GROUP...
✮ Disclaimer ✮
--------------------------------------------------------
All investments involve risk, and the past performance of a security, industry, sector, market, financial product, trading strategy, or individual’s trading does not guarantee future results or returns. Investors are fully responsible for any investment decisions they make. Such decisions should be based solely on an evaluation of their financial circumstances, investment objectives, risk tolerance, and liquidity needs.
--------------------------------------------------------

▰ Stock of The Month #2: JUBLINDS ▰► Stock of The Month #2 ◄
➟ Everything on Chart !!!! ➘
📌 I have found 15 new patterns on the charts. These are original and unique patterns that can achieve their target almost 80-90% times. Here, I have posted one of my favourite 💕 chart patterns.
☆ I will post the remaining patterns one by one every month. For more, you can check out my previous studies 😍 as well.
☆ Follow me @ tradingview for more updates. Kindly like the chart ❤ & share this analysis.
☆ Thank you. Happy Trading!!!
Best Regards,
𝘿𝙧. 𝙎𝙝𝙖𝙢𝙧𝙖𝙟𝙖 𝙉𝙖𝙙𝙖𝙧
𝙋𝙝𝘿 𝙞𝙣 𝙏𝙚𝙘𝙝𝙣𝙤𝙡𝙤𝙜𝙮.
✮ Disclaimer ✮
--------------------------------------------------------
All investments involve risk, and the past performance of a security, industry, sector, market, financial product, trading strategy, or individual’s trading does not guarantee future results or returns. Investors are fully responsible for any investment decisions they make. Such decisions should be based solely on an evaluation of their financial circumstances, investment objectives, risk tolerance, and liquidity needs.
--------------------------------------------------------

MANGLMCEM - Om mangalam mangalam!!Expecting an upmove tomo(22nd Jul 2021). On 15mins chart i see multiple chart patterns forming and also multiple flag patterns.. Likely upside moment.
Keep a watch.
Disclaimer : this is just my view/opinion and not a recommendation or suggestion. Pls analyse it yourself before investing/trading.

▰ Stock of The Month #4: SUNPHARMA ▰▰ Stock of The Month #4: SUNPHARMA ▰
📌 I have found 25 new patterns on the charts. These are original and unique patterns that can achieve their target almost 80-90% times. Here, I have posted one of my favourite 💕 chart patterns.
☆ I will post the remaining patterns one by one every month. For more, you can check out my previous studies 😍 as well. Kindly see my announcement section for all the latest.
▣ Key Highlights:
➟ Time frame Weekly ₩
➟ W pattern ⓦ
➟ Trend line ⍩
➟ Rounding Arc ◡
➟ Flag Pattern 🎌
➟ Unique Confluence Ⓤ
📌 Levels are:
Entry: ▲ 710
SL: ☢ 660
Target: ➚ 920/1080
RR: ☈ 1:7.5
Return: 50%+
☆ Follow me @ tradingview for more updates. Kindly like the chart 💗 & share this analysis.
☆ Thank you. Happy Trading!!!
Best Regards,
𝘿𝙧. 𝙎𝙝𝙖𝙢𝙧𝙖𝙟𝙖 𝙉𝙖𝙙𝙖𝙧
𝙋𝙝𝘿 𝙞𝙣 𝙏𝙚𝙘𝙝𝙣𝙤𝙡𝙤𝙜𝙮.
✮ Disclaimer ✮
--------------------------------------------------------
All investments involve risk, and the past performance of a security, industry, sector, market, financial product, trading strategy, or individual’s trading does not guarantee future results or returns. Investors are fully responsible for any investment decisions they make. Such decisions should be based solely on an evaluation of their financial circumstances, investment objectives, risk tolerance, and liquidity needs.
--------------------------------------------------------

▰ Stock of the Month #3: INGIDO ▰▰ Stock of The Month #3: JUNE ▰
📌 I have found 15 new patterns on the charts. These are original and unique patterns that can achieve their target almost 80-90% times. Here, I have posted one of my favourite 💕 chart patterns.
☆ I will post the remaining patterns one by one every month. For more, you can check out my previous studies 😍 as well. Kindly see my announcement section for all the latest.
▣ Key Highlights:
➟ Time frame Weekly ₩
➟ W pattern ⓦ
➟ Trend line ⍩
➟ Flag Pattern 🎌
➟ Unique Confluence Ⓤ
📌 Levels are:
Entry: ▲ 1818
SL: ☢ 1717
Target: ➚ 2121
RR: ☈ 1:3
Return: 17%+
☆ Follow me @ tradingview for more updates. Kindly like the chart 💗 & share this analysis.
☆ Thank you. Happy Trading!!!
Best Regards,
𝘿𝙧. 𝙎𝙝𝙖𝙢𝙧𝙖𝙟𝙖 𝙉𝙖𝙙𝙖𝙧
𝙋𝙝𝘿 𝙞𝙣 𝙏𝙚𝙘𝙝𝙣𝙤𝙡𝙤𝙜𝙮.
✮ Disclaimer ✮
--------------------------------------------------------
All investments involve risk, and the past performance of a security, industry, sector, market, financial product, trading strategy, or individual’s trading does not guarantee future results or returns. Investors are fully responsible for any investment decisions they make. Such decisions should be based solely on an evaluation of their financial circumstances, investment objectives, risk tolerance, and liquidity needs.
--------------------------------------------------------

▰ Stock of Month #1: LUPIN ▰► Stock of Month #1 ◄
♒ E͙V͙E͙R͙Y͙T͙H͙I͙N͙G͙ ͙ O͙N͙ ͙ C͙H͙A͙R͙T͙ ♒
📌 I have found 15 new patterns on the charts. These are original and unique patterns that can achieve their target almost 80-90% times. Here, I have posted one of my favourite 💕 chart patterns.
☆ I will post the remaining patterns one by one on Sunday. For your reference, you can check out my previous studies as well. Please find the stocks and comment their name in the comment ⌨ section.
☆ Follow me @ Tradingview for more updates and like the chart ❤!!!
☆ Thank you. Happy Trading!!!
Best Regards,
𝘿𝙧. 𝙎𝙝𝙖𝙢𝙧𝙖𝙟𝙖 𝙉𝙖𝙙𝙖𝙧
𝙋𝙝𝘿 𝙞𝙣 𝙏𝙚𝙘𝙝𝙣𝙤𝙡𝙤𝙜𝙮.
✮ Disclaimer ✮
--------------------------------------------------------
All investments involve risk, and the past performance of a security, industry, sector, market, financial product, trading strategy, or individual’s trading does not guarantee future results or returns. Investors are fully responsible for any investment decisions they make. Such decisions should be based solely on an evaluation of their financial circumstances, investment objectives, risk tolerance, and liquidity needs.
--------------------------------------------------------

► Stock Characteristics #3: KAJARIACER ◄► Stock Characteristics #3: Flag Pattern!!! ◄
📌 I have found that some stocks follow their own pathways. These are original and unique patterns that can achieve their target almost 80-90% times. Here, I have posted one of my favourite 💕 chart patterns.
☆ I will post the remaining patterns one by one on Sunday. For your reference, you can check out my previous studies as well. Please find the stocks and comment their name in the comment ⌨ section.
☆ Follow me @ tradingview for more updates and like the chart ❤ for more interesting patterns and analysis.!!!
☆ Please comment for any queries and kindly like & share this analysis and studies. Comment with what do you think.
Thank you. Happy Trading!!!
Best Regards,
𝘿𝙧. 𝙎𝙝𝙖𝙢𝙧𝙖𝙟𝙖 𝙉𝙖𝙙𝙖𝙧
𝙋𝙝𝘿 𝙞𝙣 𝙏𝙚𝙘𝙝𝙣𝙤𝙡𝙤𝙜𝙮.
✬ Disclaimer ✬
--------------------------------------------------------
All investments involve risk, and the past performance of a security, industry, sector, market, financial product, trading strategy, or individual’s trading does not guarantee future results or returns. Investors are fully responsible for any investment decisions they make. Such decisions should be based solely on evaluating their financial circumstances, investment objectives, risk tolerance, and liquidity needs.
---------------------------------------------------------

▰ Time to Learn Advance Pattern #2: CENTURYTEX ▰► Time to learn Advance Pattern #2 ◄
♒ E͙V͙E͙R͙Y͙T͙H͙I͙N͙G͙ ͙ O͙N͙ ͙ C͙H͙A͙R͙T͙ ♒
📌 I have found 15 new patterns on the charts. These are original and unique patterns that can achieve their target almost 80-90% times. Here, I have posted one of my favourite 💕 chart patterns.
☆ I will post the remaining patterns one by one on Sunday. For your reference, you can check out my previous studies as well. Please find the stocks and comment their name in the comment ⌨ section.
☆ Follow me @ Tradingview for more updates and like the chart ❤!!!
☆ Thank you. Happy Trading!!!
Best Regards,
𝘿𝙧. 𝙎𝙝𝙖𝙢𝙧𝙖𝙟𝙖 𝙉𝙖𝙙𝙖𝙧
𝙋𝙝𝘿 𝙞𝙣 𝙏𝙚𝙘𝙝𝙣𝙤𝙡𝙤𝙜𝙮.
✮ Disclaimer ✮
--------------------------------------------------------
All investments involve risk, and the past performance of a security, industry, sector, market, financial product, trading strategy, or individual’s trading does not guarantee future results or returns. Investors are fully responsible for any investment decisions they make. Such decisions should be based solely on an evaluation of their financial circumstances, investment objectives, risk tolerance, and liquidity needs.
--------------------------------------------------------

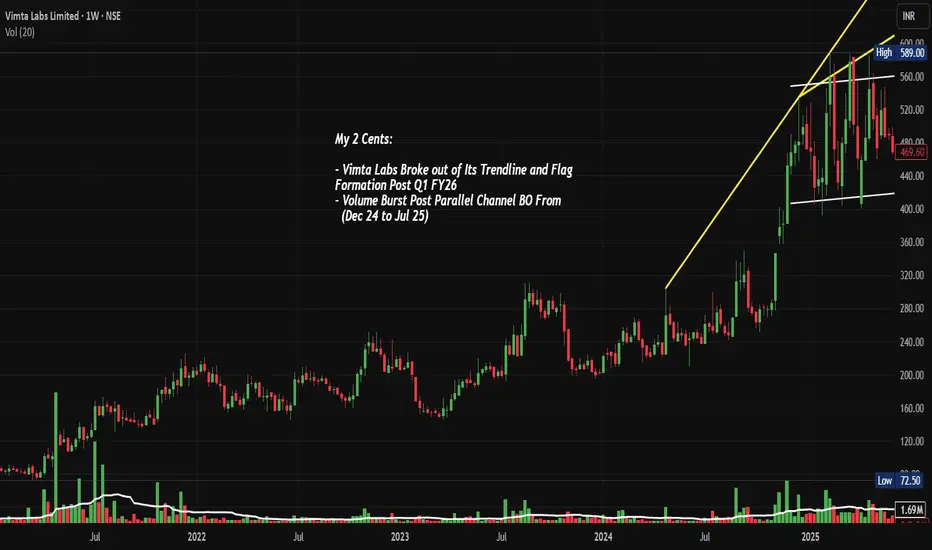
VIMTALABS: Parallel Channel & Flag BO, Chart of the WeekNSE:VIMTALABS Explodes 50%: From Parallel Channel Prison to Trendline Freedom Post Q1 FY26 Flag Breakout. Let's analyse it in the "Chart of the Week"
As per the Latest SEBI Mandate, this isn't a Trading/Investment RECOMMENDATION nor for Educational Purposes; it is just for Informational purposes only. The chart data used is 3 Months old, as Showing Live Chart Data is not allowed according to the New SEBI Mandate.
Disclaimer: "I am not a SEBI REGISTERED RESEARCH ANALYST AND INVESTMENT ADVISER."
This analysis is intended solely for informational purposes and should not be interpreted as financial advice. It is advisable to consult a qualified financial advisor or conduct thorough research before making investment decisions.
Price Action Analysis:
- Current Price: ₹887.20 (as per chart)
- 52-Week Range: ₹252 to ₹903
- Market Cap: ₹3,901 Crores
- Recent Performance: Stock has shown exceptional momentum with 171% returns in the past year
Volume Spread Analysis:
- Breakout Volume: Exceptional volume spike during the August 2025 breakout
- Volume Confirmation: Higher volumes on up-moves, lower on corrections
- Accumulation Phase: Steady volume during the consolidation phase indicates smart money accumulation
Chart Patterns:
- Long-term Ascending Trendline: Yellow trendline acting as dynamic support since May 2024
- Parallel Channel Breakout: Stock consolidated in a 6-month parallel channel (₹400-550) from December 2024 to July 2025
- Flag and Pennant Formation: Classic continuation pattern post Q1 FY26 results
- Volume Breakout: Massive volume surge accompanying the breakout, confirming genuine momentum
Key Technical Levels:
- Base Formation: ₹400-450 level established during Dec 2024 - Jul 2025 consolidation
- Primary Support: ₹550-600 (previous resistance turned support)
- Secondary Support: ₹500 (parallel channel upper boundary)
- Immediate Resistance: ₹700-750 (psychological levels)
- Final Resistance: ₹900-1000
Fundamental and Sectoral Backdrop:
Company Overview:
- Contract Research and Testing Organization serving biopharmaceutical, food, consumer goods, electronic, electrical, agrochemical, healthcare, and medical device sectors
Financial Performance:
- Q1 FY26 Results: Net profit rose 53.83% to ₹19 Crore, sales increased 30.29% to ₹98 crore
- Recent Quarter: EBITDA margins at 35.7%
- Debt Position: The Company is almost debt-free
Sector Dynamics:
- CRO/CRAMS Sector: Strong tailwinds from global pharmaceutical outsourcing
- Biologics Focus: Company expanding in high-growth biologics testing segment
- Regulatory Compliance: Successfully completed US FDA GCP certification
Other Highlights:
- Consistent revenue growth across quarters
- Strong margin expansion and operational efficiency
- Debt-free balance sheet providing financial flexibility
- Expanding service offerings in high-margin biologics
- Beneficiary of the global pharma outsourcing trend
Key Risk Factors:
- High valuation metrics post recent rally
- Dependence on the pharmaceutical sector cycles
- Regulatory compliance requirements
- Competition from larger CRO players
Market Sentiment:
- Recent 31% surge to hit a new 52-week high of ₹902, reflecting strong investor interest
- Strong institutional interest evidenced by consistent buying
- Positive analyst coverage post strong quarterly results
Full Coverage on my Newsletter this Week
Keep in the Watchlist and DOYR.
NO RECO. For Buy/Sell.
📌Thank you for exploring my idea! I hope you found it valuable.
🙏FOLLOW for more
👍BOOST if you found it useful.
✍️COMMENT below with your views.
Meanwhile, check out my other stock ideas on the right side until this trade is activated. I would love your feedback.
As per the Latest SEBI Mandate, this isn't a Trading/Investment RECOMMENDATION nor for Educational Purposes, it is just for Informational purposes only. The chart data used is 3 Months old, as Showing Live Chart Data is not allowed according to the New SEBI Mandate.
Disclaimer: "I am not a SEBI REGISTERED RESEARCH ANALYST AND INVESTMENT ADVISER."
This analysis is intended solely for informational purposes and should not be interpreted as financial advice. It is advisable to consult a qualified financial advisor or conduct thorough research before making investment decisions.
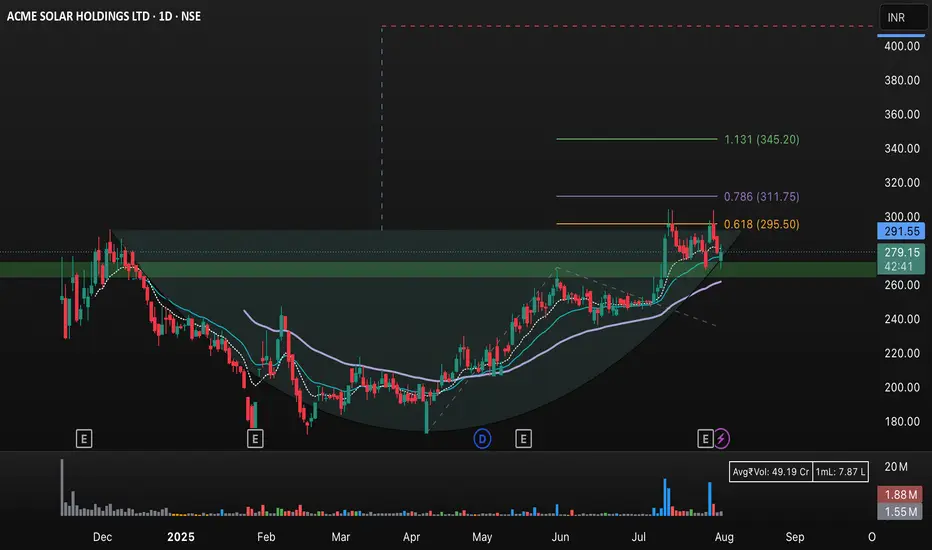
ACME Solar Holdings Ltd (NSE: ACMESOL) – Daily Chart Analysis This image displays the daily candlestick chart of ACME Solar Holdings Ltd (NSE: ACMESO) on TradingView. The chart highlights key technical analysis indicators and chart patterns:
• Fibonacci retracement levels at 0.618 (₹295.50), 0.786 (₹311.75), and an extension to 1.131 (₹345.20).
• Support and resistance zones are shaded green, with significant activity around the ₹260–₹300 range.
• A potential cup-and-handle formation is visible, supporting the bullish momentum.
• The current price is ₹279.50, slightly above the 50- and 200-day moving averages (shown as blue lines).
• Volume bars at the bottom indicate substantial trading activity during recent movement.
• The chart suggests a bullish breakout if the price sustains above resistance, with targets at ₹295.50, ₹311.75, and ₹345.20 based on Fibonacci projections, while ₹260 acts as a critical support.
This setup can be used to monitor future price actions, possible breakouts, and key zones for traders and investors.
XAU/USD Analysis Today (June 28, To 04 July 2025)XAU/USD Analysis Today (June 28, 2025)
As of June 28, 2025, the Gold Spot/US Dollar (XAU/USD) pair is trading around $3,295–$3,330, reflecting a corrective phase after recent volatility. Below is a detailed analysis of the current market dynamics, incorporating technical and fundamental factors, as well as sentiment from recent sources.
# Price and Market Overview
Current Price: Approximately $3,295–$3,330, with a slight downward bias following a recent peak near $3,450. The pair has been consolidating after a sharp decline triggered by easing geopolitical tensions.
Recent Performance: Gold fell by ~0.12%–0.42% in recent sessions, settling below the key $3,300 support level intraday, with volatility driven by U.S. economic data and Middle East developments.
Market Sentiment: The 14-day RSI is around 49.83–51.66, indicating neutral conditions, neither overbought nor oversold. Volatility over the past 30 days has been moderate at ~1.46%.
Technical Analysis
Support and Resistance Levels:
Support: Key support lies at $3,280–$3,240 (recent low and pivot point), with stronger support at $3,250 and $3,200 if selling pressure persists. A break below $3,280 could target $3,040–$3,100.
Resistance: Immediate resistance is at $3,300–$3,350, with a stronger barrier at $3,375–$3,400. A sustained break above $3,440 could signal a bullish reversal toward $3,488–$3,500.
Indicators:
Moving Averages: The 20-day EMA ($3,349.73) and 10-day EMA ($3,356.43) suggest a short-term sell signal, while the 50-day SMA ($3,323.61) and 100-day SMA ($3,162.10) indicate a buy signal, reflecting mixed trends. The 200-day SMA (~$2,919.95) supports a long-term bullish trend.
Chart Patterns: A bear flag pattern was noted on the 1-hour chart, signalling a continuation of the downtrend if $3,280 support fails. However, a potential reversal pattern is forming on the 15-minute chart near $3,313, suggesting a possible short-term bounce.
Chart for your reference
- Disclaimer --
This analysis is based on recent technical data and market sentiment from web sources. It is for informational purposes only and not financial advice. Trading involves high risks, and past performance does not guarantee future results. Always conduct your own research or consult a SEBI-registered advisor before trading.
#Boost and comment will be highly appreciated

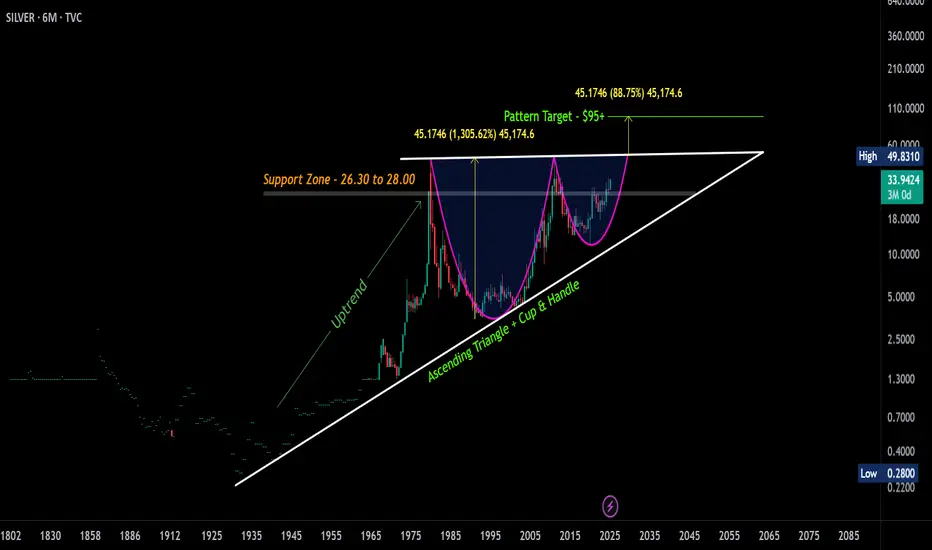
Silver Long-Term ViewSilver is forming major chart patterns: the " Ascending Triangle " and " Cup & Handle " on the long-term charts. The Cup formed from 1980 and completed in 2011, with the handle now forming since 2011.
🔹 Current Price: $33.96
🔹 Support Zone: $26.30-$28.00
🔹 Cup Depth: $45.00
🔹 Breakout level: ~$52 (for both patterns)
🔹 Target: $95+
🔹 Potential to hit $115-$130 in the long run.
A breakout may take years, but the upside potential is huge! 🚀
#Silver | #AscendingTriangle | #CupnHandle
#Nmdc stock longLet's dive into the analysis of **NMDC Limited (National Mineral Development Corporation)**. I'll provide both a **technical** and **fundamental** analysis based on the current data available.
### **Fundamental Analysis**
#### **Overview of NMDC**
- **Sector:** Mining & Metals
- **Industry:** Iron Ore Mining
- **Market Cap:** Approx. ₹37,000 crore (as of the last update)
- **Headquarters:** Hyderabad, India
NMDC is one of India’s largest iron ore producers, with operations in Chhattisgarh and Karnataka. The company is largely involved in the extraction, production, and sale of iron ore, which is a key input for steel manufacturing.
#### **Key Financials (Latest Report)**
- **Revenue Growth:** The company has witnessed fluctuating revenue growth, largely driven by global demand for iron ore, and domestic supply-demand dynamics. For the fiscal year, revenue growth can be influenced by iron ore price changes.
- **Profitability:** NMDC has a strong profitability profile, with solid margins driven by the strategic positioning in the mining industry. The profitability tends to be cyclical, linked to iron ore prices.
- **Debt Levels:** NMDC is considered financially stable with moderate debt levels.
- **Dividends:** Historically, NMDC has been a consistent dividend payer, which is attractive to income-focused investors.
#### **Valuation Ratios**
- **P/E Ratio:** This can vary based on market conditions. A lower P/E ratio could indicate the stock is undervalued, while a high P/E suggests higher growth expectations.
- **P/B Ratio:** Reflects how the market values the company’s assets.
- **Dividend Yield:** Historically around 6-7%, making it an attractive stock for dividend investors.
#### **Industry & Macro Trends**
- **Iron Ore Prices:** The profitability of NMDC is closely tied to global iron ore prices, which are affected by demand from countries like China, and trends in the steel industry.
- **Domestic Demand:** The demand for iron ore in India is rising as infrastructure projects and steel production increase.
- **Regulatory Risks:** NMDC’s operations could be impacted by changes in government policy and regulations related to mining in India.
---
### **Technical Analysis**
Let’s analyze the stock's technical position as of today.
#### **Price Action**
- **Current Price:** This fluctuates frequently, so it's important to get the exact data from a live market feed.
- **Chart Patterns:** Keep an eye on whether the stock is showing signs of consolidation, upward/downward trends, or forming specific patterns like triangles, head and shoulders, etc.
#### **Key Levels:**
- **Support Levels:**
- **₹95-₹100**: Historically, this zone has provided strong support, where buyers have stepped in during price declines.
- **₹85-₹90**: Another level of support if the stock experiences a sharp decline.
- **Resistance Levels:**
- **₹120-₹125**: This level has acted as resistance in the past, where selling pressure increased.
- **₹130-₹135**: A critical resistance zone; breaking this could signal a stronger bullish trend.
#### **Moving Averages:**
- **50-Day Moving Average (50-MA):** If the stock is trading above the 50-day MA, it indicates bullish momentum.
- **200-Day Moving Average (200-MA):** Acts as a long-term trend indicator. A stock trading above the 200-MA is considered to be in a long-term uptrend.
#### **Momentum Indicators:**
- **RSI (Relative Strength Index):** Measures the strength of a trend. If RSI is above 70, the stock could be overbought; if below 30, it could be oversold.
- **Current RSI:** Check for signs of overbought or oversold conditions.
- **MACD (Moving Average Convergence Divergence):** A helpful trend-following indicator. Positive MACD signals could point to bullish momentum, while negative signals indicate a possible bearish reversal.
#### **Volume Analysis:**
- **Volume Trends:** Rising volume with an upward price trend confirms the strength of a bullish move, while increasing volume during a decline signals selling pressure.
- **Volume Spikes:** Can indicate strong interest in either buying or selling, especially during breakout or breakdown scenarios.
#### **Recent Price Action and Trend:**
- **Uptrend/Downtrend:** Evaluate whether the stock is in an uptrend or downtrend over the past 6-12 months.
- **Breakouts/Breakdowns:** Look for any signs of breakout (price above resistance) or breakdown (price below support) in recent charts.
---
### **Conclusion:**
- **Fundamental Strengths:**
- NMDC is well-positioned within the mining sector in India, with strong market positioning in iron ore production.
- The company's stable financial health and regular dividend payouts make it attractive for long-term investors.
- **Technical Outlook:**
- The stock has been in a range-bound movement recently, with significant support around ₹100 and resistance near ₹125.
- Any break above ₹125 might see further bullish momentum, while a fall below ₹100 might trigger a bearish trend.
- RSI, MACD, and volume indicators can give further insights into short-term market moves.
This analysis should be cross-verified with real-time market data and investor sentiment for more accurate decision-making.

ACC Support & Resistance levelsSupport and resistance levels: Key price points
where the stock tends to bounce or face selling
pressure.
Trend lines: To identify the overall direction of the
stock over the medium term.
Moving averages: Such as 50-period and 200-
period moving averages on the 4h timeframe.
Technical indicators: RSI, MACD, or other
indicators that traders use for analysis.
Chart patterns: Any recognizable patterns forming
over multiple 4-hour

#Bitcoin Buy Setup**Technical Analysis Chart Description:**
Welcome to my Technical Analysis charts on TradingView! Before we dive into the analysis, it's essential to understand some important warnings:
1. **Subjectivity Alert:** Technical analysis involves interpreting market data and chart patterns, which can be subjective. Different analysts may interpret the same data differently, leading to varied conclusions.
2. **Historical Performance Doesn't Guarantee Future Results:** Past price movements do not guarantee future price movements. While historical data can provide insights, it's crucial to consider other factors that could influence price action.
3. **Risk of False Signals:** Technical indicators and chart patterns can produce false signals, leading to potential losses if relied upon blindly. Always cross-verify signals with other indicators or fundamental analysis.
4. **Market Volatility:** Crypto markets are highly volatile and can experience rapid price fluctuations. Be prepared for sudden and unexpected price movements, which may invalidate previously identified patterns.
5. **Risk Management:** Proper risk management is essential. Never invest more than you can afford to lose, and consider using stop-loss orders to mitigate potential losses.
6. **Emotional Bias:** Avoid emotional decision-making based on short-term price movements. Stick to your trading plan and strategy, and don't let fear or greed influence your decisions.
**Disclaimer for Crypto Trading:**
Trading cryptocurrencies carries inherent risks, and it's important to understand the following:
Cryptocurrency markets are highly speculative and can be subject to extreme volatility. Prices can fluctuate significantly within short periods, leading to substantial gains or losses.
Investing in cryptocurrencies involves the risk of total loss of capital. Unlike traditional assets, cryptocurrencies are not backed by any tangible assets or central authority, making them inherently risky.
Regulatory uncertainty and market manipulation are additional risks associated with cryptocurrency trading. Regulatory changes or negative news can have a significant impact on prices.
This analysis is for informational purposes only and should not be construed as financial advice. It's crucial to conduct thorough research and consult with a qualified financial advisor before making any investment decisions in the cryptocurrency markets.
By using this analysis, you acknowledge and accept the risks associated with cryptocurrency trading and agree to trade at your own discretion. The author of this analysis shall not be held responsible for any losses incurred as a result of using the information provided.

#Bitcoin Buy Trade**Technical Analysis Chart Description:**
Welcome to my Technical Analysis charts on TradingView! Before we dive into the analysis, it's essential to understand some important warnings:
1. **Subjectivity Alert:** Technical analysis involves interpreting market data and chart patterns, which can be subjective. Different analysts may interpret the same data differently, leading to varied conclusions.
2. **Historical Performance Doesn't Guarantee Future Results:** Past price movements do not guarantee future price movements. While historical data can provide insights, it's crucial to consider other factors that could influence price action.
3. **Risk of False Signals:** Technical indicators and chart patterns can produce false signals, leading to potential losses if relied upon blindly. Always cross-verify signals with other indicators or fundamental analysis.
4. **Market Volatility:** Crypto markets are highly volatile and can experience rapid price fluctuations. Be prepared for sudden and unexpected price movements, which may invalidate previously identified patterns.
5. **Risk Management:** Proper risk management is essential. Never invest more than you can afford to lose, and consider using stop-loss orders to mitigate potential losses.
6. **Emotional Bias:** Avoid emotional decision-making based on short-term price movements. Stick to your trading plan and strategy, and don't let fear or greed influence your decisions.
**Disclaimer for Crypto Trading:**
Trading cryptocurrencies carries inherent risks, and it's important to understand the following:
Cryptocurrency markets are highly speculative and can be subject to extreme volatility. Prices can fluctuate significantly within short periods, leading to substantial gains or losses.
Investing in cryptocurrencies involves the risk of total loss of capital. Unlike traditional assets, cryptocurrencies are not backed by any tangible assets or central authority, making them inherently risky.
Regulatory uncertainty and market manipulation are additional risks associated with cryptocurrency trading. Regulatory changes or negative news can have a significant impact on prices.
This analysis is for informational purposes only and should not be construed as financial advice. It's crucial to conduct thorough research and consult with a qualified financial advisor before making any investment decisions in the cryptocurrency markets.
By using this analysis, you acknowledge and accept the risks associated with cryptocurrency trading and agree to trade at your own discretion. The author of this analysis shall not be held responsible for any losses incurred as a result of using the information provided.

#GAL BUY Trade**Technical Analysis Chart Description:**
Welcome to my Technical Analysis charts on TradingView! Before we dive into the analysis, it's essential to understand some important warnings:
1. **Subjectivity Alert:** Technical analysis involves interpreting market data and chart patterns, which can be subjective. Different analysts may interpret the same data differently, leading to varied conclusions.
2. **Historical Performance Doesn't Guarantee Future Results:** Past price movements do not guarantee future price movements. While historical data can provide insights, it's crucial to consider other factors that could influence price action.
3. **Risk of False Signals:** Technical indicators and chart patterns can produce false signals, leading to potential losses if relied upon blindly. Always cross-verify signals with other indicators or fundamental analysis.
4. **Market Volatility:** Crypto markets are highly volatile and can experience rapid price fluctuations. Be prepared for sudden and unexpected price movements, which may invalidate previously identified patterns.
5. **Risk Management:** Proper risk management is essential. Never invest more than you can afford to lose, and consider using stop-loss orders to mitigate potential losses.
6. **Emotional Bias:** Avoid emotional decision-making based on short-term price movements. Stick to your trading plan and strategy, and don't let fear or greed influence your decisions.
**Disclaimer for Crypto Trading:**
Trading cryptocurrencies carries inherent risks, and it's important to understand the following:
Cryptocurrency markets are highly speculative and can be subject to extreme volatility. Prices can fluctuate significantly within short periods, leading to substantial gains or losses.
Investing in cryptocurrencies involves the risk of total loss of capital. Unlike traditional assets, cryptocurrencies are not backed by any tangible assets or central authority, making them inherently risky.
Regulatory uncertainty and market manipulation are additional risks associated with cryptocurrency trading. Regulatory changes or negative news can have a significant impact on prices.
This analysis is for informational purposes only and should not be construed as financial advice. It's crucial to conduct thorough research and consult with a qualified financial advisor before making any investment decisions in the cryptocurrency markets.
By using this analysis, you acknowledge and accept the risks associated with cryptocurrency trading and agree to trade at your own discretion. The author of this analysis shall not be held responsible for any losses incurred as a result of using the information provided.

#High Is Ready to Fly High**Technical Analysis Chart Description:**
Welcome to my Technical Analysis charts on TradingView! Before we dive into the analysis, it's essential to understand some important warnings:
1. **Subjectivity Alert:** Technical analysis involves interpreting market data and chart patterns, which can be subjective. Different analysts may interpret the same data differently, leading to varied conclusions.
2. **Historical Performance Doesn't Guarantee Future Results:** Past price movements do not guarantee future price movements. While historical data can provide insights, it's crucial to consider other factors that could influence price action.
3. **Risk of False Signals:** Technical indicators and chart patterns can produce false signals, leading to potential losses if relied upon blindly. Always cross-verify signals with other indicators or fundamental analysis.
4. **Market Volatility:** Crypto markets are highly volatile and can experience rapid price fluctuations. Be prepared for sudden and unexpected price movements, which may invalidate previously identified patterns.
5. **Risk Management:** Proper risk management is essential. Never invest more than you can afford to lose, and consider using stop-loss orders to mitigate potential losses.
6. **Emotional Bias:** Avoid emotional decision-making based on short-term price movements. Stick to your trading plan and strategy, and don't let fear or greed influence your decisions.
**Disclaimer for Crypto Trading:**
Trading cryptocurrencies carries inherent risks, and it's important to understand the following:
Cryptocurrency markets are highly speculative and can be subject to extreme volatility. Prices can fluctuate significantly within short periods, leading to substantial gains or losses.
Investing in cryptocurrencies involves the risk of total loss of capital. Unlike traditional assets, cryptocurrencies are not backed by any tangible assets or central authority, making them inherently risky.
Regulatory uncertainty and market manipulation are additional risks associated with cryptocurrency trading. Regulatory changes or negative news can have a significant impact on prices.
This analysis is for informational purposes only and should not be construed as financial advice. It's crucial to conduct thorough research and consult with a qualified financial advisor before making any investment decisions in the cryptocurrency markets.
By using this analysis, you acknowledge and accept the risks associated with cryptocurrency trading and agree to trade at your own discretion. The author of this analysis shall not be held responsible for any losses incurred as a result of using the information provided.

#Turbo Buy Trade**Technical Analysis Chart Description:**
Welcome to my Technical Analysis charts on TradingView! Before we dive into the analysis, it's essential to understand some important warnings:
1. **Subjectivity Alert:** Technical analysis involves interpreting market data and chart patterns, which can be subjective. Different analysts may interpret the same data differently, leading to varied conclusions.
2. **Historical Performance Doesn't Guarantee Future Results:** Past price movements do not guarantee future price movements. While historical data can provide insights, it's crucial to consider other factors that could influence price action.
3. **Risk of False Signals:** Technical indicators and chart patterns can produce false signals, leading to potential losses if relied upon blindly. Always cross-verify signals with other indicators or fundamental analysis.
4. **Market Volatility:** Crypto markets are highly volatile and can experience rapid price fluctuations. Be prepared for sudden and unexpected price movements, which may invalidate previously identified patterns.
5. **Risk Management:** Proper risk management is essential. Never invest more than you can afford to lose, and consider using stop-loss orders to mitigate potential losses.
6. **Emotional Bias:** Avoid emotional decision-making based on short-term price movements. Stick to your trading plan and strategy, and don't let fear or greed influence your decisions.
**Disclaimer for Crypto Trading:**
Trading cryptocurrencies carries inherent risks, and it's important to understand the following:
Cryptocurrency markets are highly speculative and can be subject to extreme volatility. Prices can fluctuate significantly within short periods, leading to substantial gains or losses.
Investing in cryptocurrencies involves the risk of total loss of capital. Unlike traditional assets, cryptocurrencies are not backed by any tangible assets or central authority, making them inherently risky.
Regulatory uncertainty and market manipulation are additional risks associated with cryptocurrency trading. Regulatory changes or negative news can have a significant impact on prices.
This analysis is for informational purposes only and should not be construed as financial advice. It's crucial to conduct thorough research and consult with a qualified financial advisor before making any investment decisions in the cryptocurrency markets.
By using this analysis, you acknowledge and accept the risks associated with cryptocurrency trading and agree to trade at your own discretion. The author of this analysis shall not be held responsible for any losses incurred as a result of using the information provided.

#IO Buy Trade **Technical Analysis Chart Description:**
Welcome to my Technical Analysis charts on TradingView! Before we dive into the analysis, it's essential to understand some important warnings:
1. **Subjectivity Alert:** Technical analysis involves interpreting market data and chart patterns, which can be subjective. Different analysts may interpret the same data differently, leading to varied conclusions.
2. **Historical Performance Doesn't Guarantee Future Results:** Past price movements do not guarantee future price movements. While historical data can provide insights, it's crucial to consider other factors that could influence price action.
3. **Risk of False Signals:** Technical indicators and chart patterns can produce false signals, leading to potential losses if relied upon blindly. Always cross-verify signals with other indicators or fundamental analysis.
4. **Market Volatility:** Crypto markets are highly volatile and can experience rapid price fluctuations. Be prepared for sudden and unexpected price movements, which may invalidate previously identified patterns.
5. **Risk Management:** Proper risk management is essential. Never invest more than you can afford to lose, and consider using stop-loss orders to mitigate potential losses.
6. **Emotional Bias:** Avoid emotional decision-making based on short-term price movements. Stick to your trading plan and strategy, and don't let fear or greed influence your decisions.
**Disclaimer for Crypto Trading:**
Trading cryptocurrencies carries inherent risks, and it's important to understand the following:
Cryptocurrency markets are highly speculative and can be subject to extreme volatility. Prices can fluctuate significantly within short periods, leading to substantial gains or losses.
Investing in cryptocurrencies involves the risk of total loss of capital. Unlike traditional assets, cryptocurrencies are not backed by any tangible assets or central authority, making them inherently risky.
Regulatory uncertainty and market manipulation are additional risks associated with cryptocurrency trading. Regulatory changes or negative news can have a significant impact on prices.
This analysis is for informational purposes only and should not be construed as financial advice. It's crucial to conduct thorough research and consult with a qualified financial advisor before making any investment decisions in the cryptocurrency markets.
By using this analysis, you acknowledge and accept the risks associated with cryptocurrency trading and agree to trade at your own discretion. The author of this analysis shall not be held responsible for any losses incurred as a result of using the information provided.
