NIFTY for 16th AugustWe are moving from FALL to CONSOLIDATION it seems, provided world markets remain the way they are- and that's a big challenge! Trump is tweeting day in and day out and American markets are reacting or overreacting to every piece of news or data. Yesterday Dow Jones lost 800 points because 10 year bond yield curve dipped below 2yr bond yield curve. And if you are thinking what's the big deal, then whenever this has happened (7 times) since 1969, America went into recession a year or two later. So DJIA even today is not looking to recover from yesterday's low. At the time of writing this piece, it is 26 points down. Let's look at our data points now.
1) Provisional data show that both FIIs and DIIs were Net buyers by 1615 Crs and 1620 Crs respectively. The final data, however, show that FIIs were Net Sellers in Equity by 540 Crs, in index futures by around 153 Crs and in stock futures by 970 Crs. So it shows FIIs did sell but volume looks smaller to me as compared to earlier figures.
2) Option chain data, expiry 22nd August, show on PUT side total highest OI (9.63 lakhs) and fresh highest Put writing (7.90 lakhs) at 11000 strike. Comparable figures are at 10900 strike and since Nifty closed at 11029 (quite near 11000), we can safely assume that both 11000 and 10900 will act as good supports. On CALL side, total highest OI (9.07 lakhs) and fresh highest Call writing (6.06 lakhs) at 11200 strike. Data is yet to be populated but as of now 11200 can be seen as credible resistance.
3) On charts, Nifty closed with lower high and higher low finishing as a Doji candle. Till it breaks 13th August low of 10901, it will not fall further. So that is our lower limit. Our upper limit is at 21 day DEMA of 11667. The buying area and selling area shows where we can take long and short trades with good RR. whether we open Gap up or down will be dictated by tonight's DJIA and tomorrow's Hang Seng & SgX movements.
all the best. Happy trading.
Search in ideas for "DJIA"
dow JonesI just didnt see what the Historical charts were showing Me in this DOWNTREND. I have very very clearly marked out what I caught last night on the DJIA. I think WORLD MARKETS are ALMOST READY/SETUP for the LONGEST WAVE IN BULL MARKET HISTORY. It only requires a Little patience a keen Eye and some Effort.
The projection of the breakthrough result...The projection of the breakthrough result: If a breakthrough is exist, the price will fall with acceleration. I will project in a later post after concrete evidence.
There are series of supports exist such as 17456, 17383, etc which were performed well in history.
Look closely at Dow Jones's recent broad move in price action:
The end of Dow Jones Industrial AverageAs I am writing this, Dow Jones closing at 25800 climbing 547 points (+2.17%), one of the biggest rises we have seen in recent times on DJIA. With this bounce, it seems to have concluded the corrective wave and is on its course to start its downward journey from hereon. If my guess is true, we may not see 26000 again on Dow for a very long time and the fall from here is likely to be steep. Expect initial levels of 22000 on Dow in the coming couple of months with the possibilities of extension of the fall wide open
US 30 Price Behaviour Analysis - Dow Jones is currently trading at 40,2584
- DOW showed us a major sell-off as well where all its major constituents getting slaughtered
- Dow still has a better price action when compared to SPX & NAS
- Dow is also waiting for the CPI print to be laid out and then only we will see a possible bounce back
DJIENTRY TARGET SL Mention in the chart.
ALWAYS TAKE TRADE WITH CONFIRMATION
Note : Trading in any financial market is very risky. I post ideas for educational purpose only. It is not financial advice. Do not hold us responsible for any potential loss you may incur. Please consult your financial adviser before trading.
DJI - Likely to start a wave 3 upwards? To make a new high?DJI has formed three sub-fractal i,ii, i,ii, i,ii since the impulse upwards since the Oct 22 bottom.
It should eventually materialize in a wave iii upwards i.e. 3 sub-fractals of iii,iv, iii,iv, iii,iv.
In all possibility the recent wave ii is complete in a five wave C downwards. Today's price action at NYSE opening would be crucial.
Comparison of leading markets to anticipate the future movementAn attempt to anticipate the future movement of different markets over next 5 to 10 years. If we see the movement of 6 markets, we can have some insights.
Among the 6, Germany (DAX- purple) and India (NIFTY50 - red) look like being in the middle zone of the direction of movement since 1991.
Hong Kong (HSI - green ) came down gradually from around early 2018 to 2022, now looks at a fair level (may fall further to form a bottom).
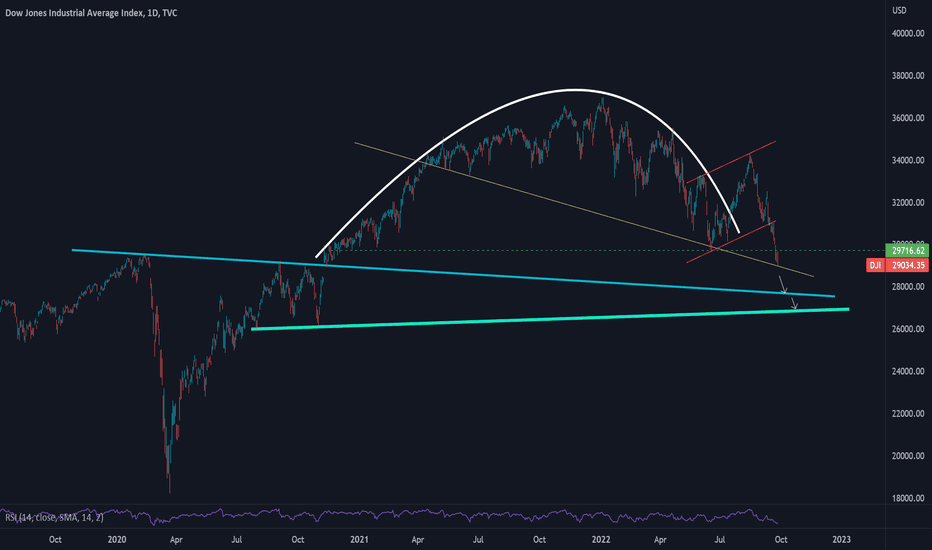
USA(DJI - blue ) has recently started falling after forming a sharp peak, I am expecting a fall probably to 27500 levels or may go to 22000.
India (Nifty50 - red ) looks bullish for long term but may see a pullback to 15000 levels or even to 12000 levels in coming years.
UK (UKX - yellow) looks sideways and lacks long term strength as evident in the economy in recent times for United Kingdom.
France (CAC40-brown) looks sideways from a long term perspective.
Germany(Dax-purple) looks the most balanced in terms of bear and bull phases.
Overall it looks like the bear phase has started for most markets and it may take several years for healthy bull phase to be back.


