BANKNIFTY predeiction for today 01 JULYAs we discussed, BANKNIFTY opened sideways and retested 53000 levels, which started to fall and gave a nice bearish momentum.
If we look at the chart now:
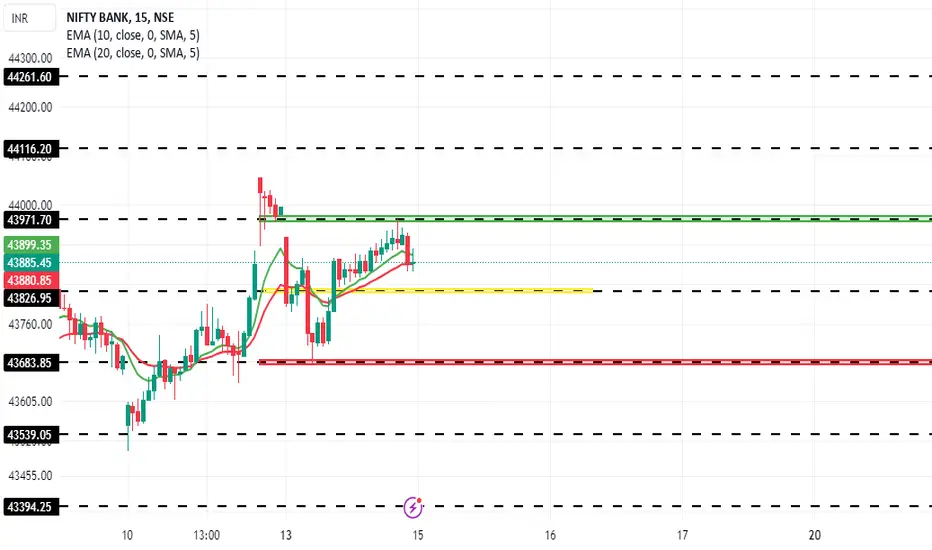
The market has broken the resistance to the downside with a good bearish momentum.
Support levels: 52023, 51830, and 200 EMA
Resistance levels: 50 EMA, 52403, 52689
If we look at the OI data:
PCR = 0.64, which has changed from 1.32, shows bears are making their position and selling high points. So, some correction can be expected here. 53500 is Max-Pain.
I am expecting a correction in the market till 200 EMA.
Reason:
RSI < 40 falling and also having divergence, which might lead the market to some correction.
EMA(200) < Price < EMA(13, 50), which indicates the market can take some correction till 200 EMA.
PCR = 0.64, which shows that the market is strongly Bearish.
Price < VWAP shows a Bearish market structure.
Verdict: Sideways or Bearish
Plan of action:
wait for 15 min candle. Let the market take resistance at 13 EMA or 50 EMA. Once you see the direction bearish.
Sell 52400 CE (Hedge it with 20/- premium)
Search in ideas for "EMA"

Can Render Price Rise From The Support Or Continue To Plunge? Can Render Price Rise From The Support Or Continue To Plunge?
Render Price fell sharply after the breakdown below the Psychological level of $10.
The RNDR token price currently seems to be stabilizing near the 200 day Exponential moving average.
The Render crypto seemed to be stabilizing near the 200 day Exponential moving average in the recent sessions. The bears seem to be dominating the short term trend as the price slumped nearly 25% in the last two weeks.
The RNDR price crashed sharply after a breakdown below the $10 level and made its way towards the 200 day EMA. Moreover, the $7 level may act as a strong demand zone from which the price may bounce back. Moreover, the social metrics seem to be cooling down indicating a waning interest of the investors and community members.
Social Metrics Shows Waning Interest of The Investors.
As per the data obtained from a financial website app.santiment.net the social metrics like social volume and social dominance seem to be cooling down. The Social sentiment curve has been on a continuous decline since the third week of may and has dropped to a three month low indicating the losing interest among the community members and investors.
Furthermore, the volume analysis reveals a drop in the demand. The volume inflow was $78.95 Million having dropped by 37.% a day. The volume to market cap ratio at 2.73% suggests a low volatility.
Render crypto ranks 29th with a live market capitalization of $2.86 Billion. Out of a total 532.073 Million RNDR tokens, over 388.65 million tokens are presently in circulation.
Can Bulls Defend The $7 Level?
At the time of writing, the Render price was trading close to $7.6 reporting a swift intraday gain of 0.20%. On the lower side, the $7 level may act as a strong support and the price may bounce back.
However, if the bulls fail to defend the $7 level, the strong selling pressure may cause a breakdown of the support thus dragging the price close to $5.5 levels.
From a technical point of view, the breakdown below the 50 day EMA has turned the short term trend bearish. Currently, the price is looking to gain support from the 200 day EMA to keep the long term trend positive.
Conclusion.
Render (RNDR) crypto is experiencing a bearish short-term trend, with a 25% price drop in two weeks after the price fell below $10 mark. Currently, the price seemed to be stabilizing near the 200-day EMA, with $7 as a potential rebound zone.
Moreover, the trading volume has decreased by 37%, and the low volume-to-market cap ratio suggests minimal volatility. RNDR is 29th in market cap at $2.86 billion, with 388.65 million tokens in circulation.
Currently trading at $7.6, if $7 support fails, the price may loom towards the $5.5 level. The 50-day EMA breach suggests short-term bearishness, while the 200-day EMA could maintain the long-term uptrend.

EURUSD: Still discounted!Hello traders! 👋
As we approach the end of the trading week, EURUSD remains in the red on this Friday, currently hovering around the 1.071 mark. The outlook remains bearish as the pair continues to trade within a tightening wedge pattern, and both the EMA 34 and EMA 89 are favoring the sellers.
Key Observations:
Current Level: EURUSD is trading near 1.071, struggling to find upward momentum.
Bearish Wedge Pattern: The pair is confined within a narrowing wedge, indicating potential for further downward movement.
EMA Indicators: Both the 34-day EMA and 89-day EMA are aligning with the bearish trend, providing additional resistance to any bullish attempts.
Trading Outlook:
With the prevailing bearish sentiment and technical indicators supporting the sellers, the focus remains on short positions.
Stay vigilant and consider these factors in your trading strategy. Happy tradi

Bajaj Finance : Momentum Building Bajaj Finance Momentum building up after yearly results.
- Public holding only 10.2% - historical low since 2017
- DII's holding 14.33%, up from 14% in Dec'23
- Marginal decrease in promoter and FII holding
- Ex dividend date approaching on 6/21 - Dividend of Rs 36
On daily charts
- RS1 56
- EMA 9 and EMA 21 have crossed EMA 63
- EMA 63 just below EMA 200
Fundamentals
- PE around 31
- PEG around 1.05
Buy and hold for target of 8000

Banknifty Prediction for tomorrow 30 May As we discussed, the Banknifty bearish structure market gave a very nice momentum to the downside.
If we look at the chart now:
The market is trading at 200 EMA(30 min TF), which can provide potential support. Also, bank nifty is trading between fib 0.50 and 0.61, which might also be a good support zone. The price is trading lower than EMA(13,50) and above EMA(200). this zone is perfect for taking support for Banknifty.
If we look at the OI data:
PCR = 0.63 shows a bearish signal in the market. There is good writing on both sides at 48400 and 48500. 48000 has good PE writing, so it is going to provide a good support zone. on the upper side, 49000 is going to be a hard resistance zone because of heavy CE writing.
I am expecting
Case 1: Sideways in range 48400-48853.
Case 2: if the market breaks 48400 to the downside- Bearish
With a good volatility market in upcoming sessions because VIX is 24.2.
Reason:
RSI < 40 shows a weak bull structure. (Bearish)
EMA(13) > Price >= EMA(200), which indicates indecisive or rather sideways market. The market might receive support at 200 EMA.
The market has given a good volume spike that shows this level is good support.
PCR = 0.63 indicates bearish.
price < VWAP shows that a weak market structure can lead to a bearish market.
Verdict: Bearish or Sideways.
Plan of action:
Case 1: Sideways: Sell 48400 PE & 48850 CE (Hedge it with 15/- premium options)
Case 2: Bearish: Sell 48400 CE (Hedge it with 15/- CE option)

NIFTY Prediction for tomorrow 29 May 24As we discussed, Nifty has a sideways or bearish structure; it ended sideways in 1st half, then bearish later 2nd half.
If we look at the chart now:
The market has broken 50 EMA and a good support zone to the downside. Also, an EMA(13, 50) bearish crossover is about to happen, which might lead to a bearish market structure. The market is making an HNS pattern and has broken the neckline to the downside, which might lead to a target of 22600 levels.
If we look at the OI data:
PCR = 0.80, which has fallen from 0.89, shows good CE writing at higher levels. 23000 will be acting as hard resistance at higher levels. Other than that, Nifty has good resistance at 23100, 23200, and 23300.
Looking at the data, Nifty might go bearish in the upcoming session with a target of 22600 .
Reasons:
RSI < 40 falling from the upside shows a good bearish strength.
EMA(13) > Price > EMA(50, 200), which indicates an indecisive or rather sideways market.
The market has formed a lower high that indicates the market is bearish.
PCR = 0.80 indicates mild bullishness, but this has fallen from 0.89, which shows good CE writing at higher levels.
Price < VWAP shows that a weak market structure can lead to a bearish market.
Verdict: Bearish
Plan of action : 22800 PE (Hedge it with 10/-) if the market continues bearish momentum.
Note: you can target 200 EMA targets.

Banknifty Prediction for tomorrow 17 May 24As we discussed Banknifty sideways or Bullish; it ended-up sideways with high volatility.
If we look at the chart:
The market is trading at resistance (Price action + 200 EMA resistance) right now. the important levels for tomorrow are 47401, 47000 will be working as very good support. while 200 EMA, 47970, and 48332 will be working as nice resistance.
If we look at OI data:
PCR = 0.88 shows bullish structure. if we notice today after 11 AM they is a very heavy CE winding up in the market. 48000 CE was removed approx 33% that shows big players are winding up CE positions in heavy quantity. which might push the market to upside.
FII and DII not yet available.
I nam expecting market to go Higher in uppcoming sessions.
Reasons:
RSI crossing 60 to upside that might be a starting of new bullish trend.
Price > EMA (13) but less than 200 EMA(resistance), which shows the market still has to break 200 EMA to go bullish.
PCR = 0.88 shows a bullish sign.
Price > VWAP means bulls are getting strength.
The market has already given a breakout it was a good accumulation today; soon, it will shoot to the upside.
Verdict:
Sideways or Bullish
Plan of action:
Sell 48000 CE and 47600 PE (Hedge with 20/- Premium)

Solana Price Shows Consecutive Gains: Are Buyers Taking Charge? The Solana price witnesses the formation of a bullish pin bar candlestick on the daily chart.
The daily chart showcases that the SOL price is stuck between the 50 day and 200 day EMA.
The Solana price has been trading higher on the second consecutive day and is trying to stretch higher after stabilizing above the 200 day EMA. The price surge may help the crypto recover the recent losses caused after a double top pattern formation near the $200 level.
The daily chart suggests that the SOL crypto loomed sharply after the buyers failed to surpass the $200 level. A double top pattern was observed after which the price dropped breaking below the 50 day Exponential moving average.
Currently, the Solana price is stuck between the 50 day EMA on the higher side and the 200 day EMA on the lower side. The long term trend outlook is bullish until the price is maintained above the 200 day EMA.
However, the short term trend outlook seems to have weakened after the recent fall. Now, the breakout or breakdown on either side of the EMA may indicate a clear trend in the short term.
Solana Crypto: Social Sentiment Data Study
The social dominance and social volume of Solana price reveals the activity performed by the social media users. Social media tools like Twitter (X), Telegram, Instagram are a medium to increase the awareness and news about the SOL crypto.
The above chart reveals that the social volume and social sentiments were comparatively high in December and dropped in January and February. However, a sharp growth in the social volume and social sentiment was observed in March. The social dominance was 2.8% in February which surged to 12.1% by the end of March suggesting a 600% growth. However, the social dominance curve witnessed a drop in April and currently stands at 6%.
The Sentiments Curve Suggest A Slightly Positive Outlook.
The weighted sentiment data displays the short term bias among the traders and Investors. As per the chart, the weighted sentiment was bullish in January and turned negative in February indicating a short term correction.
Moreover, the overall sentiments turned positive in March and a sharp rally was observed on the charts. Currently, the weighted sentiment curve has fallen back near the mean line indicating a short term correction in the price. The short term trend outlook is neutral to slightly bullish on a combined analysis of sentiment curve and price data.
Solana Crypto Forecast 2024
The analysts have a wide range of price targets for April 2024. The most optimistic view of analysts assumes the Solana price could advance to a high of $202.05 suggesting a potential gain of over 39.3%. The lower price target which the crypto could attain as per the analysts is $108.7 if it breaks the recent support and 200 day exponential moving average.
Conclusion.
Solana price is rising for the second consecutive session hinting at a recovery from recent losses. Recently, the buyers failed to break above the recent swing high and psychological level of $200 triggered a profit booking and slumped below the 50-day EMA.
Currently, the SOL crypto is wedged between the 50-day and 200-day EMAs suggesting a bullish long-term outlook but a shaky short-term trend. Also, Social media buzz, reflected in social volume and dominance, peaked in March, signaling increased interest. The sentiment data is neutral to mildly bullish, suggesting a possible short-term price correction. The Breakout of the EMAs on either side may indicate a clear trend.
Technical levels:
Support levels: $122.61 and $108.37
Resistance levels: $204.09 and $224.86
Disclaimer
The views and opinions stated by the author, or any people named in this article, are for informational purposes only and do not establish financial, investment, or other advice. Investing in or trading crypto or stock comes with a risk of financial loss.

Are Bulls Gaining Traction In Coreum Price Or Bears Keep On?The Coreum price faced a strong selling pressure from the upper supply zone and has loomed near the monthly low.
The coreum price currently trades at $0.139 reporting a positive intraday development of 2.80%.
The Coreum price jumped higher intraday from the monthly low value indicating the presence of buyers at the lower levels. At the time of writing, the COREUM price was up nearly 2.80% and was trading close to 0.139 USD.
Earlier this week also, the crypto experienced a buying from the same monthly low value. However, the bullish momentum faded away when the price hit the 20 day EMA. The price dropped to the same demand zone after a strong bearish candle was noted on the daily chart.
On the higher side, the key EMAs of 20 day and 50 day are acting as a dynamic resistance and are preventing the price from drawing further upward trajectory. The bulls need to surpass the dynamic resistance in order to reverse the short term trend.
Furthermore, the short term trend has turned slightly bearish after a continuous selloff from the recent supply in the last few weeks. However, there is still some hope left for the bulls as the coreum price still hovers above the monthly low value which is also the recent demand zone.
Coreum Crypto Volatility Analysis
The volatility of coreum crypto measures the fluctuation in the price. The above chart describes a contrast between the price and volatility metrics. As per the chart the volatility surged in the first two weeks of March as the price gained traction.
However, the volatility as well as the price experienced a drop in the later weeks of March 2024. The drop in volatility shows the stability of the crypto at the CMP.
Coreum Crypto: Social Users Are Increasing!
The social dominance and social volume are the metrics that depict the current activity of the social users about the Coreum crypto. It includes the users over the various social platforms like Telegram, Twitter, Facebook etc.
The social volume and social dominance curve display a positive trajectory in the last couple of months indicating an increment in the number of users. The rise in the number of users suggests the increasing popularity and awareness of the crypto. It indicates a long term growth in the crypto.
Technical Indicators Imply a Mixed Outlook.
From a technical point of view, the COREUM crypto showcases a neutral to bearish outlook as per the key exponential moving averages of 20 and 50 days. The price hovers below both the 20 and 50 day EMA and both the EMAs are aligned in a bearish way.
At the time of writing, the RSI line was hovering close to 43.87 points and that of the SMA line was placed at 39.37 points. Both the RSI and SMA line have withdrawn below the mean line indicating a bearish outlook in the short term.
Coreum Crypto Price Prediction April 2024.
On the most optimistic note, Coreum crypto could gain to a high of $0.177 as the highest value in April if the bulls are able to surpass the recent dynamic resistance of 20 and 50 days. On the other hand, the most pessimistic prediction of our analysts is for the price to reach $0.120 if it breaks below the recent support level of $0.133.
Conclusion.
Coreum's price has shown resilience, bouncing back from monthly lows, signaling buyer interest. At the time of writing, the Coreum price up by 2.80% and was trading around $0.139. The price faced resistance at the 20-day EMA, leading to a drop back to the demand zone.
Overcoming the 20 and 50-day EMA resistance is crucial for reversing the short-term trend bearish trend. Social metrics on platforms like Telegram and Twitter show increased user activity, hinting at Coreum's growing popularity. As per the positive view of our analysts, the Coreum price could rise to $0.177 in April if resistance is breached.
Technical levels:
Support levels: $0.133 and $0.120
Resistance levels: $0.153 and $0.177
Disclaimer
The views and opinions stated by the author, or any people named in this article, are for informational purposes only and do not establish financial, investment, or other advice. Investing in or trading crypto or stock comes with a risk of financial loss.

Can Kava Crypto Flourish From Support Or Show A Descent Soon?The Kava crypto has withdrawn below the 20 day EMA suggesting weakness over the daily chart.
The Kava crypto is down nearly 0.50% in intraday and was trading at 0.936 USD.
The Kava crypto trades lightly in intraday with a slight negative development of 0.50%. The crypto was trading close to $0.936. The bears are extending the losses on the third consecutive session and the crypto has withdrawn below the 20 day EMA.
The breakdown below the 20 day exponential moving average has weakened the short term positive trend. The price currently hovers near the 50 day EMA and is trying to get support from it. The long term trend outlook is bullish until the price hovers above the 200 day EMA.
The crypto has taken multiple support from the dynamic support of 50 and 200 day EMA. Now, if the price bulls make a comeback and the price recovers, it may again resume its way on the higher side. The short term traders and investors may target $1.11 and $1.25 on the higher side if the price surpasses the key EMA of 20 days.
Kava Crypto Development Activity Foresights
The Kava crypto development activity chart illustrates a healthy developer activity over the weekly chart. The development activity and developers activity contributors count curve has noted an upward trajectory in the last two months.
The development activity shows the undergoing changes and updates in the crypto. A positive curve in the development activity generally indicates the long term growth in the crypto.
Kava Crypto: Social Sentiments Analysis
Social indicators like social dominance, social volume and twitter followers also play a major role in deciding the current sentiment of the social media users about Kava crypto. The above chart mentions the social volume and social dominance of the crypto along with the number of twitter followers and telegram followers.
As per the data, the total number of the active telegram users are 1193 till date and the total number of twitter users were 2045. Telegram users have increased gradually in the last one month. However, the total active users on Twitter have decreased by nearly 30% in the past month.
Technical Indicators Imply Weakness In The Trend.
From a technical point of view, the Kava price has dropped below the 20 day exponential moving average suggesting weakness in the short term trend. However, the long term trend outlook is still bullish as the price still hovers above the 50 and 200 day moving average.
Moreover, the RSI line has fallen below the mean line and was currently placed at 48.03 points. On the other hand, the SMA line was placed at 51.08 points. Both the RSI and SMA line were hovering close to the mean line and a bearish crossover of both the lines was observed indicating a neutral to slightly bearish outlook in the short term.
Kava Crypto Forecast April 2024.
The Kava price prediction for April 2024 shows that the crypto may advance to a high of $1.256 if buyers are able to surpass the recent resistance of $1.11 on the higher side. Whereas, the less optimistic analysts estimate a price target of $0.803 on the lower side after the breakdown below 50 and 200 day EMA.
Conclusion.
Kava crypto is experiencing a slight decline, trading near $0.936. The crypto has withdrawn below the 20-day EMA, signaling a short-term bearish trend. However, it might find support at the 50-day EMA. The long term trend outlook is bullish as long as it stays above the 200-day EMA.
Further, Recovery above the 20-day EMA could see targets of $1.11 and $1.25. Development activity is positive, indicating growth. Social metrics show increasing Telegram users but a 30% drop in Twitter activity, affecting sentiment.
Technical levels:
Support levels: $0.886 and $0.739
Resistance levels: $1.11 and $1.256
Disclaimer
The views and opinions stated by the author, or any people named in this article, are for informational purposes only and do not establish financial, investment, or other advice. Investing in or trading crypto or stock comes with a risk of financial loss.

Rollbit Coin Sinks Below Yearly Low: Can It Fall More Or RecoverAt press time, the Rollbit Coin was trading close to 0.104 suggesting an intraday loss of 1.68%.
The technical indicators imply a bearish outlook below the key moving average of 20 day EMA.
The Rollbit Coin is extending the losses on the second consecutive day and has slid near its weekly low value. The price suffered rejection from the 50 day EMA, which has been acting as a dynamic resistance and dragging the price on the lower side.
Earlier, the RBL crypto witnessed a beamish trend in the last two months and kept on declining continuously. The key EMAs played a key role in dragging the price towards the lower side. The crypto price suffered multiple rejections and fell down.
The daily chart suggests that the bears retained control of the trend and made aggressive short positions after every rise. The price currently hovers near the yearly low value and is at a risk of breakdown.
The bulls are attempting for a recovery after the price broke down below the monthly low value. However, they seem to be failing as the price suffered rejection from the 50 day EMA.
Any breakdown on the lower side may be anticipated as a trend continuation and the price may drop more. However, the bulls need to accumulate and surpass the lows and surpass above the key EMAs in order to shift the trend.
Rollbit Coin Crypto Volume Analysis
The Rollbit Coin volume analysis illustrates that the intraday volume received was 2.135 Million USD which is 4.56 less than the previous day. The volume has dropped in the recent sessions indicating a trend weakening. The current market capitalization of RLB is 345.63 Million USD.
The volume to market capitalization ratio is 0.57% suggesting low volatility in the market. It has 3.29 Million RLB tokens in the circulating supply.
Social Indicators Draw a Bearish Curve
The social data including social dominance and twitter followers reveal the increasing or decreasing participation of the social media users in the RLB crypto. The above chart shows that the social dominance of crypto has dropped in the recent sessions. It suggests the loss of interest among the users in Rollbit coin.
However, the twitter followers seems to be constant in the last few months. Twitter is one of the most important social sentiment indicators due to the news and development updates are available on twitter.
Technical Analysis of Rollbit Coin.
The directional technical indicators like exponential moving average impart a bearish outlook in the short term. The RLB price hovers below the key EMAs of 20, 50 and 200 days suggesting a negative outlook in the short term as well as long term.
At the time of writing, the RSI line was placed at 45.60 below the mean line and that of the SMA line was placed at 46.89 points. Both the RSI and SMA line were placed below the mean line suggesting a weak outlook in the short term.
Rollbit Coin Crypto Forecast 2024
On the most optimistic note, RLB cryptocurrency could gain to a high of $0.166 as the highest price in April if the bulls are able to surpass the exponential moving average of 50 days. On the other hand, the most pessimistic prediction of our analysts is for the price to reach $0.051 if it breaks below the recent swing low of $0.083.
Conclusion.
The Rollbit Coin is at the risk of falling lower after the price extended ist losses on the second consecutive session. The price suffered rejection from the 50 day EMA and slid down indicating a bearish trend continuation. The price hovers near the yearly low value and might resume on the lower side if it continues on the lower side.
The volume and social dominance has dropped in the recent sessions. Also, the technical indicators imply the prevailation and continuation of a bearish trend.
Technical levels:
Support levels: $0.083 and $0.516
Resistance levels: $0.116 and $0.166.
Disclaimer
The views and opinions stated by the author, or any people named in this article, are for informational purposes only and do not establish financial, investment, or other advice. Investing in or trading crypto or stock comes with a risk of financial loss.

Bitcoin Price Edges Higher: Is New ATH Possible Ahead Of HalvingBitcoin price hovers close to All time high value and is showing accumulation in the last few sessions.
The BTC price currently trades close to $69,400 and has dropped nearly 2.60% in Intraday.
The Bitcoin price started off the week with a negative note on Monday and has dropped nearly 2.60% in Intraday on Monday. At press time, the crypto was hovering close to $69,400 and has loomed towards the lower boundary of the accumulation.
Earlier, the BTC/USD pair has been witnessing an accumulation near the previous all time high value. The accumulation has been of nearly six intraday sessions and the pride hasn’t been able to find a clear direction since then.
On the higher side, the $71,600 level has been acting as a supply and stooping to price to rise further. Whereas, on the lower side, $68,076 level has been acting as a demand and preventing further fall.
The long term trend outlook is bullish due to which a breakout of the range is anticipated. Also, the key moving averages are leaving a positive note which adds a confirmation for a breakout.
Whereas, if the BTC price breaks the lower boundary of the accumulation and 20 day EMA, it may head straight towards the 50 day EMA. The 50 day EMA is currently placed at $62,700 which is also the previous support zone.
Bitcoin Crypto Volume Analysis
The volume analysis shows that Bitcoin received $24.25 Billion volume inflow in the past 24 hours which is nearly 38% higher than the previous day. The live market capitalization of BTC cryptocurrency is 1.371 Trillion USD. The volume to market capitalization ratio is 1.74% indicating low volatility.
It has a current circulating supply of 19.67 Million BTC tokens which is 93.67% of the total supply. The total supply of Bitcoin is 21 Million tokens.
Bitcoin Price Holdings Analaysis
The above chart demonstrates the number of addresses holding a particular amount of Bitcoin along with the change in time. Starting from the smaller one, given below is the number of wallets holding from 0 to 1,000,000 Bitcoins by the end of March 2024.
No of Bitcoins No of addresses
0 to 0.0001 BTC:- 28.2 Million
0.0001 to 0.01 BTC:- 11.79 Million
0.01 to 0.1 BTC: 7.91 Million
0.1 to 1 Bitcoin: 3.51 Million
1 to 10 BTC: 856.19 K
10 to 100 BTC: 137.16 K
100 to 1,000 BTC: 13897
1,000 to 10,000 BTC: 1961
10,000 to 100,000 BTC: 106
100,000 to 1,000,000 BTC: 3
Bitcoin Price Technical Outlook
The technical indicators imply a bullish outlook in the short term as BTC price hovers higher than the key exponential moving averages of 20, 50 and 200 days. The short term EMAs are aligned above the larger EMA of 200 days suggesting a trend continuation until the price is maintained above the 20 day EMA.
At the time of writing, the RSI line was placed at 55.98 points and that of the SMA line 55.66 points. Both the RSI and SMA line were placed above the mean line suggesting a positive outlook in the short term. Also, a bearish crossover of both the lines is observed indicating a possible correction in the price.
Bitcoin Price Prediction April 2024.
The short term trend outlook positive which may trigger a breakout of the current accumulation range. On the higher side, the short term traders and investors may target previous ATH as the 1st level of profit booking. If the momentum resumes, then the Investors may hold till the $80,000 level.
Also, in case of breakdown of the accumulation, the BTC price may go volatile and might retrace the 50 day EMA if it lowers below the 20 day EMA.
Conclusion.
The Bitcoin price is exhibiting an accumulation near the $70,00 level for the last six consecutive sessions. The crypto started off the week on a negative note and has lowered by 2.60% in Intraday indicating the intention to stay in the range as of now.
The long term trend outlook is bullish due to which a breakout is anticipated. Any sustained move above $71,600 level may drive the price near the next targets of $75,000 and $80,000.
Technical levels:
Support levels: $65,500 and $62,000
Resistance levels: $71,650 and $73,890
Disclaimer
The views and opinions stated by the author, or any people named in this article, are for informational purposes only and do not establish financial, investment, or other advice. Investing in or trading crypto or stock comes with a risk of financial loss.

NIFTY prediction for tomorrow 16th FEB 24As we discussed NIFTY for today, it ended sideways.
Now, if we look at the chart data:
The market has already given a breakout as it expired today. It ended sideways to the upside while facing resistance at 21950. The market will be sideways in the range of 21800-21950.
EMA has given bullish-crossover EMA(50,200). Which shows the market is in a good bullish phase.
If we look at the OI data:
Pcr = 0.96 shows a bullish signal. Also, 21900 has very good PE writing, which shows it's going to provide good support. On the upper side, there is good resistance CE writing at 21900, 21950, and 22000. that will provide nice resistance.
FII & DII have yet to be released.- I will update you in the comments.
The market should be sideways in the range of 21800-21950. if it breaks 21950 to the upside, I can expect a good bullish momentum till 22110, as has been marked in the chart.
Reasons:
Price > EMA(13,50,200) which shows nice bulls power.
EMA golden crossover EMA(50,200) shows bullish trend.
RSI ~ 60 but sideways with bullish divergence, which shows the market can move to the upside.
OI data Pcr = 0.96 shows bulllish market sentiments.
Price ~ VWAP, which shows market price and volume both are balanced. The market has a good range to go upside down.
Verdict:
Sideways in the range 21800-21950.
Bullish if it breaks 21950 to the upside.
Plan of Action:
Iron condor in range(21800-21950)
if it breaks to the upside, add a bullish position and exit a short position.

BTC/USDT ~ Weekly Overviewn the crypto world, last week was a rollercoaster. It started on a high note with the SEC approving 11 Bitcoin Spot ETFs, generating excitement about institutional involvement. However, things soured quickly.
As ETF providers revelled in the influx of new investments, Grayscale's GBTC faced a challenging situation, marked by significant outflows coinciding with the fund's discount to net asset value reaching its lowest point since February 2021.
Turning to the technical analysis, Bitcoin (BTC) appeared to pause in the vicinity of the $42,000 mark, following a weekly descent of 3.15%. The Fibonacci retracement analysis now suggests the emergence of a potential resistance zone, spanning from the 0.236 to the 0.382 FIB levels.
In the context of moving averages, the EMA-20 experienced an adverse crossover against the EMA-50, EMA-100, and EMA-200, signalling a bearish outlook for the near term.
Nevertheless, there remains a glimmer of hope, as BTC contemplates the possibility of surpassing the EMA-20, which could potentially alter its momentum to the positive side.
The RSI level, which briefly plunged into the oversold region, swiftly rebounded into the neutral zone. From a technical standpoint, one should anticipate resistance at $43,000 and $45,000, respectively, while support levels are identifiable at $42,000 and $40,000

Analysis of banknifty for 17th NovemberAs compared to nifty banknifty is slightly bearish. So there is sell on resistance. If banknifty is below yellow and red zone you can sell on yellow zone . And banknifty will become full bearish after the breakdown of red zone. Banknifty will be sideways above yellow and green zone and will become bullish only above green zone ..... Also see the ema's if 10 ema is above 20 ema then the trend is bullish and if 10 ema is below 20 ema the trend is bearish but also see the zones....... subscribe if you want to learn i will upload videos on this channel @tradewithgau @tradewithgau @tradewithgau

Analysis of BankNifty for 15th NovemberThis is an educational post. I am not a SEBI registered . BankNifty will be bullish to buy on dip above yellow and green zone. But 10 ema and 20 ema should be rising price must be near 10 ema and 20 ema. And sideways movement between yellow and red zone. And Banknifty will be bearish below red zone but 10 ema and 20 ema should be falling. And the black line is for profit booking if there is breakout or breakdown of green and red area respectively.
Analysis of Nifty for 15th NovemberThis is an educational post. I am not a SEBI registered . Nifty will be bullish to buy on dip above yellow and green zone. But 10 ema and 20 ema should be rising price must be near 10 ema and 20 ema. And sideways movement between yellow and red zone. And nifty will be bearish below red zone but 10 ema and 20 ema should be falling. And the black line is for profit booking if there is breakout or breakdown of green and red area respectively.

Unlocking the Power of Confluence Zones for Nifty ChartHey fellow traders! Today, I'm excited to dive into the world of technical analysis and unveil the power of confluence zones in trading. We'll be focusing on the Nifty, a popular index among Indian traders. So, fasten your seatbelts and let's embark on this educational journey together!
Understanding Confluence Zones
Confluence zones are critical areas on a price chart where multiple technical indicators align, creating a strong support or resistance level. In simpler terms, it's like having several bodyguards protecting your trade. Here's what we're looking at for Nifty:
Currently, Nifty is trading on its daily demand zone.
Nifty is also very close to its uptrend line.
The daily EMA 50 is in the mix too.
This confluence of the demand zone, EMA 50, and trend line can act as a strong barrier for Nifty's price and we may witness reversal. 🪂✨
Why EMA 50 Matters 📊
The EMA 50 (Exponential Moving Average) is like the heartbeat of a trend. It smooths out price data and helps us identify the overall direction of the market. Many traders use it as a support or resistance level. History tells us that Nifty has bounced off the EMA 50 multiple times, as you can see in the circles on the chart . 🔄💡
If you find this analysis insightful, show your support by hitting the 🚀 icon, leaving a comment, and following my TradingView profile in.tradingview.com . Your feedback keeps the trading community thriving! 📈🔥

PASUPTAC's Chart: Breakout, Retest, Momentum, and DivergenceIn this analysis, we will explore the chart of PASUPTAC, focusing on the breakout of a falling trendline, completion of a retest, gaining momentum, and the breakout of the 100 EMA (Exponential Moving Average). Additionally, we will consider the completion of a divergence on the weekly chart. It's important to note that PASUPTAC is a small-cap stock with a market capitalization of just 269.2 Crore. With that in mind, let's proceed with the analysis.
Chart Analysis:
Upon reviewing the provided TradingView chart for PASUPTAC, we can observe several key technical factors that may influence the stock's future price action. These include the breakout of a falling trendline, completion of a retest, gaining momentum, the breakout of the 100 EMA, and the completion of a divergence on the weekly chart.
Breakout of Falling Trendline and Retest:
The chart indicates that PASUPTAC has experienced a breakout of a falling trendline, which suggests a potential shift in the stock's trend from bearish to bullish. The subsequent completion of a retest after the breakout further validates the breakout's strength. A successful retest indicates that the previous resistance has now turned into support, potentially supporting further upward movement.
Gaining Momentum and Breakout of 100 EMA:
Additionally, the stock is gaining momentum again after the breakout and retest, indicating increasing buying interest. Furthermore, PASUPTAC has also experienced a breakout of the 100 EMA, which is a significant technical milestone. The breakout of a major moving average like the 100 EMA suggests a potential shift in the stock's overall trend and could attract further buying interest.
Completion of Divergence on Weekly Chart:
The analysis reveals that there was a divergence on the weekly chart's RSI (Relative Strength Index), which now seems to be completed. Divergence occurs when the price and an oscillator like the RSI move in opposite directions. The completion of the divergence suggests a potential reversal or continuation of the stock's current trend.
Buy Setup and Targets:
Based on the analysis, a potential buying opportunity arises at the current CMP (Current Market Price). Traders may consider initiating a long position with a stop loss set at 28, which helps limit potential losses if the anticipated upward movement does not materialize.
In terms of target levels, a target of 37 can be considered. However, it is important to monitor the price action and adjust the profit-taking strategy based on individual risk appetite and trading plan.
Considerations for Small-Cap Stock:
It's important to note that PASUPTAC is a small-cap stock with a market capitalization of just 269.2 Crore. Small-cap stocks tend to be more volatile and have lower liquidity compared to large-cap stocks. Therefore, traders should exercise caution and be mindful of the risks associated with trading small-cap stocks.
Conclusion:
Based on the technical analysis, PASUPTAC's chart indicates a breakout of a falling trendline, completion of a retest, gaining momentum, and a breakout of the 100 EMA. Furthermore, the completion of a divergence on the weekly chart adds weight to the potential upward movement. However, as a small-cap stock, traders should consider the associated risks and exercise caution when trading PASUPTAC.
Traders should carefully assess their risk tolerance and consider implementing appropriate risk management strategies, such as setting stop-loss levels. It is essential to closely monitor price action and any changes in the technical landscape to make informed trading decisions.
Disclaimer: The information provided in this analysis is for educational purposes only and should not be considered as financial advice. Trading stocks involves risks, and past performance is not indicative of future results. It is advisable to consult with a financial advisor or conduct further research before making any financial decisions.

Ethereum Important Levels and Trade ZoneChart - Heikin Ashi
Timeframe - 4H
Resistance Zone - 1635 to 1647
20 ema - 1634.25
50 ema - 1643.36
100 ema - 1664.89
200 ema - 1710.45
Fib Retracement :- 38.20% level 1732.88
50% level 1789.44
Note :- The breakout of 1647 level will also give us the breakout of 20 ema and 50 ema.
Trade Setup :-
1. Enter on the breakout of 1647 level
2. 1st Target is 1732.88 (Fib retracement level of 38.20%)
Exit half the quantity on the first target and leave the other half for the second target with a
trailing stoploss of 1710.
3. 2nd Target is 1789.44 (Fib retracement level of 50%)
Disclaimer: This is my pre market analysis and my trading journal. Not a suggestion to buy or sell. This material is for educational purposes only.
Thanks
Sardar Simranjit Singh Virdi

IRFC - VCPEntry: above 33.65
Target: 40.5
SL: below 32.3
Pattern: VCP
EMA's : EMA 21 > EMA 50 > EMA 150 > EMA 200.
Price breaking out from 11 Week consolidation.
Price Up by more than 40% before forming VCP.

RVNL - BreakoutEntry: above 130
Target: 180
SL: below 119
EMA's : EMA 21 > EMA 50 > EMA 150 > EMA 200.
Price breaking out from 10 Week base.
Price Up by more than 100% before forming base.

'Bullish' on Union Bank for Short TermThe scrip was in a corrective phase after reaching a 52W high of 96.40.The scrip gave a breakout from the triangle pattern on daily time frame forming a large bullish candle on 03.03.2023 rising 8.3 percent to 72.40 with above average volumes.
The stock is trading higher than 8 day, 21 day, 100 day and 200 day EMA . However, it is trading below its 50 day EMA of 75.51. Price crossed 21 EMA of 70.54 on 03/03/23 with above average volumes. Delivery volumes were more than 2x higher than weekly average Del. volume and nearly 4x the monthly average del. volumes.This suggests that the price action is bullish for the short term.
In its forward journey the price might take resistance near its 50 EMA of 75.51. A cross above 50 EMA will signal going long for medium term.
Target 1 : 77
Target 2 : 84
Target 3 : 89
