Search in ideas for "Ethereum"

Ethereum Analysis |9 Oct 2021 | AyushAryaETH got good trendline breakdown and at retest level now chances to go down ETH can see some rejection from 3625 it will be good entry for short position stops above 3700 and the targets we can make of around 3500 , GOOD 1:8 Risk Reward Ratio

Ethereum chart breakoutbuying idea for Ethereum for short time period
after break and given successfully closing above the level 3340
in a month we can see the level of 4173
if 4173 level crosses potentially will see 4900 as next target

ETH IN A CRITICAL ZONEETHEREUM is in a critical area from where it could likely breakdown. But the confirmation comes if it breaks the demand zone as well. Breaking the consolidation zone in the upper side with good volumes could give upward rally as well but that doesn't seem to be a likely case currently.

Ethereum creating upside parrallel pattern 15M If ethereum will break this pattern it could give a huge breakout either side.

ETHEREUM BREAKOUT BUYTRADING SUGGESTION:
Now we looking to the market got breakout to resistance zone ,so take a buy trade GOOD LUCK
Take profit on-1598,1648
.
.
.
.
TAKE A TRADE, SIT BACK AND RELAX
LIKE AND SHARE

ETHEREUM GO UP BUY Now we looking to the market got breakout on trend line,so take a buy trade,GOOD LUCK
.
.
.
.
TAKE A TRADE, SIT BACK AND RELAX
LIKE AND SHARE

Ethereum short-term ideaThe only way this idea would go bust is if ETH closes above the 50% Fib at $3,050.
As always, DYOR. NFA!

Ethereum LevelsThe analysis provided by me is just an analysis. And if these levels happen, then you can buy as well as sell according to the given levels and your condition. But remember for long term investment this is the best oppurtunity where you can wait and watch any invest your money in the dip.

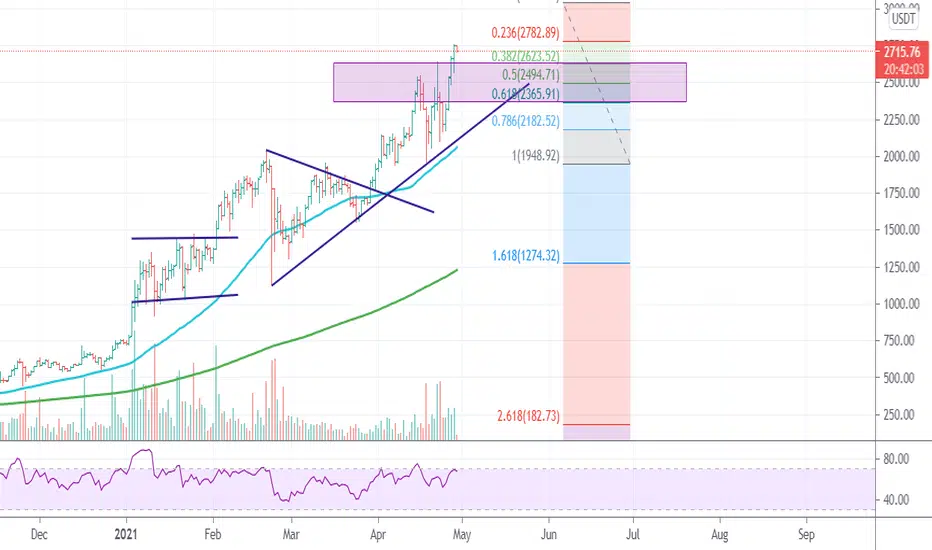
Ethereum-Already in momentum move to $3kBest accumulation zone for ETH/USDT is 2300-2600 assuming it hits 3000 in this upmove itself, and even a retracement from that level will land it in this zone only. Downside capped at hard base of $2,000.
Capital(10,000) Allocation strategy-
1000- Buy now
3000- around level of $2500 in the retracement move.
6000- wait for sharp correction and buy around $21-22,00.

Ethereum (ETH) Weekly | $3440 & $4000+ If $2500 Breaks...The weekly chart for our beloved Ethereum (ETHUSD), the #1 altcoin, is really looking good...
Meaning, there is lots of potential/room still left available for growth.
Hit LIKE to read the chart!
The first thing to notice here is that the EMA10 green line has never been 'breached' since April 2020.
Trading above EMA10 = BULLISH.
Here we have the proof.
Now, this week we have a green candle that is challenging resistance.
We know that the longer a resistance level is challenged the weaker it becomes.
When prices are high and set to drop they tend to do so suddenly and strong, yet we are still above EMA10 which is super bullish... That's all my friends.
There are more signals coming from this chart but basically, this is it, simple is best.
If ETHUSD can break and close above $2550 on the weekly timeframe, we can expect higher prices to $3400+ and even $4000+.
Conditions for change
A correction can happen/take place when prices move and close below EMA10, now sitting at $1953.
Thanks a lot for reading.
Feel free to leave a comment if you have any questions and hit LIKE to share in support.
Namaste.

ETHEREUM ON DAILY TIMEFRAME.We shared this analysis on 3rd April. ETH had formed Bullish pennant & with a good breakout its sustaining up. Half way through.

Ethereum next support is 1210.00 levelsIf 1210.00 holds then ethereum can push to 2038.0 once more. If 1210.00 does not hold on a daily closing basis then 1041.00 will be exposed.

Ethereum (ETH) Below EMA10 Weekly, Lower Prices Coming...Just like Bitcoin, Ethereum (ETHUSD) will also resume growing but only after seeing lower prices.
It is normal to have a correction after such strong bullish action.
Here we can see that ETHUSD is already trading below EMA10 weekly, sending out a strong bearish signal.
(Note: Candle closure later today is needed for confirmation of this signal. ETHUSD most close below $1361 to confirm the bearish potential).
After we test EMA21 at $1050, we can see a bounce before lower prices.
The RSI has been trending lower strong and this week we have a full bearish candle.
We also have a volume breakout favoring the bears.
Visit my profile for the Bitcoin (BTCUSD) daily analysis as well.
Thanks a lot for your continued support.
Namaste.

Ethereum Ready To Move Lower (Goes Below EMA10)Hello, my favorite cryptocurrency trader... Here we go again.
I will keep this one short because I am on "vacation", AKA, reading, studying, exercising, and work...
Anyways, we already know that Bitcoin (BTCUSD) is now bearish as well as Ripple (XRPUSD), the same is happening with Ethereum (ETHUSD).
We can see prices moving below EMA10 just before the day closes.
Closing below this level means "signal confirmed".
In this case, a bearish signal.
The RSI is trending down.
The MACD is trending down after both showed bearish divergence.
The red/bear volume bars are bigger/higher than the green bars... You see, we don't need to be "experts" here... We just look at the charts for repeating patterns and "signals" and use these to try and predict what will happen next.
Based on these signals...
We will see ETHUSD drop to at least $486 or more...
We will see how it goes, the daily candle hasn't close and that's when the signal is confirmed.
Conditions for change | If prices move back above EMA10...
We can continue waiting, tracking, but the potential for a drop remains and stays strong unless the last high is taken out.
ETHUSD is likely to move lower now.
Namaste.


Ethereum trading in range !!!After touching 289 ethereum has corrected quite well . A range can be seen in 240 chart which it is struggling to break . A breakout to any side can happen . One should trade only after breakout . If upward breakout happened one can buy for target of 302 and if downward breakout happened one can sell for target of 230 or 200 ema in 4 hrs. Triangle formation is getting narrow and breakout can happen anytime soon.

ETHUSD $150.00 now keyEthereum remains under heavy downside pressure after breaking under the October monthly trading low, following the broader digital currency market decline. Going forward, continued weakness below the $150.00 level will be bad for ETHUSD trading sentiment. Bulls need to stage a major rally above the $180.00 level to encourage traders to buy ETHUSD again.
• If the ETHUSD pair trades above the $150.00 level, key resistance is found at the $180.00 and $198.00 levels.
• If the ETHUSD pair trades below the $150.00 level, key support is found at the $143.00 and $125.00 levels.

ETHUSD struggling under $180.00Ethereum is under pressure on Tuesday, with short-term bulls taking back control of the cryptocurrency below the $180.00 support level. Going forward, the ETHUSD pair still has a strong correlation to Bitcoin, many altcoins are also breaking lower. Overall, a bearish head and shoulders pattern with strong downside potential has been triggered on the lower time frames.
• If the ETHUSD pair trades below the $180.00 level, key support is found at the $165.00 and $150.00 levels.
• If the ETHUSD pair trades above the $180.00 level, key resistance is found at the $200.00 and $250.00 levels.

ETHUSD bullish biasEthereum is performing fairly well despite the recent heavy losses seen across the broader cryptocurrency market this week. Continued gains above the $180.00 level are now needed to challenge towards the top of the ETHUSD pair’s short-term trading range. Crypto market sentiment is still weak at present, although the altcoin space appears to be performing better than Bitcoin at present.
• If the ETHUSD pair trades above the $180.00 level, key resistance is found at the $200.00 and $250.00 levels.
• If the ETHUSD pair trades below the $180.00 level, key support is found at the $170.00 and $155.00 levels.
