A trading opportunity to buy in POLYETHTechnical analysis:
. POLYMATH/ETHEREUM is in a range bound and the beginning of uptrend is expected.
. The price is above the 21-Day WEMA which acts as a dynamic support.
. The RSI is at 59.
Trading suggestion:
. There is a possibility of temporary retracement to suggested support zone (0.00072900 to 0.00063240). if so, traders can set orders based on Price Action and expect to reach short-term targets.
Beginning of entry zone (0.00072900)
Ending of entry zone (0.00063240)
Entry signal:
Signal to enter the market occurs when the price comes to "Buy zone" then forms one of the reversal patterns, whether "Bullish Engulfing" , "Hammer" or "Valley" in other words,
NO entry signal when the price comes to the zone BUT after any of the reversal patterns is formed in the zone.
To learn more about "Entry signal" and the special version of our "Price Action" strategy FOLLOW our lessons:
Take Profits:
TP1= @ 0.00080150
TP2= @ 0.00086840
TP3= @ 0.00096640
TP4= @ 0.00109970
TP5= @ 0.00123360
TP6= @ 0.00142320
TP7= @ 0.00166570
TP8= Free
Search in ideas for "Ethereum"

There is a possibility for the beginning of an uptrend in XZCETHTechnical analysis:
. ZCOIN/ETHEREUM is in a range bound and the beginning of uptrend is expected.
. The price is below the 21-Day WEMA which acts as a dynamic resistance.
. The RSI is at 50.
. While the RSI and the price downtrend in the Daily chart are not broken, bearish wave in price would continue .
Trading suggestion:
. There is a possibility of temporary retracement to suggested support zone (0.040570 to 0.030460). if so, traders can set orders based on Price Action and expect to reach short-term targets.
Beginning of entry zone (0.040570)
Ending of entry zone (0.030460)
Entry signal:
Signal to enter the market occurs when the price comes to "Buy zone" then forms one of the reversal patterns, whether "Bullish Engulfing" , "Hammer" or "Valley" in other words,
NO entry signal when the price comes to the zone BUT after any of the reversal patterns is formed in the zone.
To learn more about "Entry signal" and the special version of our "Price Action" strategy FOLLOW our lessons:
Take Profits:
TP1= @ 0.051860
TP2= @ 0.061900
TP3= @ 0.081200
TP4= @ 0.096900
TP5= @ 0.112200
TP6= @ 0.134400
TP7= @ 0.162700
TP8= Free

A trading opportunity to buy in POWERETHTechnical analysis:
. POWERLEDGER/ETHEREUM is in a range bound and the beginning of uptrend is expected.
. The price is below the 21-Day WEMA which acts as a dynamic resistance.
. The RSI is at 50.
. While the RSI and the price downtrend in the Daily chart are not broken, bearish wave in price would continue .
Trading suggestion:
. There is a possibility of temporary retracement to suggested support zone (0.00062400 to 0.00055000). if so, traders can set orders based on Price Action and expect to reach short-term targets.
Beginning of entry zone (0.00062400)
Ending of entry zone (0.00055000)
Entry signal:
Signal to enter the market occurs when the price comes to "Buy zone" then forms one of the reversal patterns, whether "Bullish Engulfing" , "Hammer" or "Valley" in other words,
NO entry signal when the price comes to the zone BUT after any of the reversal patterns is formed in the zone.
To learn more about "Entry signal" and the special version of our "Price Action" strategy FOLLOW our lessons:
Take Profits:
TP1= @ 0.00075400
TP2= @ 0.00088300
TP3= @ 0.00097400
TP4= @ 0.00115000
TP5= @ 0.00132700
TP6= @ 0.00157900
TP7= @ 0.00190000
TP8= Free

There is a trading opportunity to buy in AIONETHTechnical analysis:
. AION/ETHEREUM is in a range bound and the beginning of uptrend is expected.
. The price is below the 21-Day WEMA which acts as a dynamic resistance.
. The RSI is at 46.
. While the RSI and the price downtrend in the Daily chart are not broken, bearish wave in price would continue .
Trading suggestion:
. There is a possibility of temporary retracement to suggested support zone (0.001830 to 0.001250). if so, traders can set orders based on Price Action and expect to reach short-term targets.
Beginning of entry zone (0.001830)
Ending of entry zone (0.001250)
Entry signal:
Signal to enter the market occurs when the price comes to "Buy zone" then forms one of the reversal patterns, whether "Bullish Engulfing" , "Hammer" or "Valley" in other words,
NO entry signal when the price comes to the zone BUT after any of the reversal patterns is formed in the zone.
To learn more about "Entry signal" and the special version of our "Price Action" strategy FOLLOW our lessons:
Take Profits:
TP1= @ 0.002500
TP2= @ 0.003170
TP3= @ 0.003820
TP4= @ 0.004360
TP5= @ 0.005320
TP6= @ 0.006285
TP7= @ 0.007650
TP8= @ 0.009395
TP9= @ 0.00
TP10= Free

A trading opportunity to buy in KMDETHTechnical analysis:
. KOMODO/ETHEREUM is in a range bound and the beginning of uptrend is expected.
. The price is below the 21-Day WEMA which acts as a dynamic resistance.
. The RSI is at 53.
. While the RSI and the price downtrend in the Daily chart are not broken, bearish wave in price would continue .
Trading suggestion:
. There is a possibility of temporary retracement to suggested support zone (0.004940 to 0.004070). if so, traders can set orders based on Price Action and expect to reach short-term targets.
Beginning of entry zone (0.004940)
Ending of entry zone (0.004070)
Entry signal:
Signal to enter the market occurs when the price comes to "Buy zone" then forms one of the reversal patterns, whether "Bullish Engulfing" , "Hammer" or "Valley" in other words,
NO entry signal when the price comes to the zone BUT after any of the reversal patterns is formed in the zone.
To learn more about "Entry signal" and the special version of our "Price Action" strategy FOLLOW our lessons:
Take Profits:
TP1= @ 0.005660
TP2= @ 0.006200
TP3= @ 0.007140
TP4= @ 0.009770
TP5= @ 0.011890
TP6= @ 0.014000
TP7= @ 0.017000
TP8= Free

There is a possibility for the beginning of an uptrend in ZILETHTechnical analysis:
. ZILLIQA/ETHEREUM is in a range bound and the resumption of uptrend is expected.
. The price is below the 21-Day WEMA which acts as a dynamic resistance.
. The RSI is at 45.
Trading suggestion:
. There is a possibility of temporary retracement to suggested support zone (0.00015000 to 0.00013880). if so, traders can set orders based on Price Action and expect to reach short-term targets.
Beginning of entry zone (0.00015000)
Ending of entry zone (0.00013880)
Entry signal:
Signal to enter the market occurs when the price comes to "Buy zone" then forms one of the reversal patterns, whether "Bullish Engulfing" , "Hammer" or "Valley" in other words,
NO entry signal when the price comes to the zone BUT after any of the reversal patterns is formed in the zone.
To learn more about "Entry signal" and the special version of our "Price Action" strategy FOLLOW our lessons:
Take Profits:
TP1= @ 0.00016100
TP2= @ 0.00016580
TP3= @ 0.00017400
TP4= @ 0.00018000
TP5= @ 0.00018770
TP6= @ 0.00021700
TP7= @ 0.00028000
TP8= Free

There is a possibility for the beginning of an uptrend in GASETHTechnical analysis:
. GAS/ETHEREUM is in a range bound and the beginning of uptrend is expected.
. The price is above the 21-Day WEMA which acts as a dynamic support.
. The RSI is at 51.
. While the RSI and the price uptrend in the Daily chart are not broken, Bullish wave in price would continue .
. The price downtrend in the daily chart is broken, so the probability of the resumption of an uptrend is increased.
Trading suggestion:
. There is a possibility of temporary retracement to suggested support zone (0.02500000 to 0.02150000). if so, traders can set orders based on Price Action and expect to reach short-term targets.
Beginning of entry zone (0.02500000)
Ending of entry zone (0.02150000)
Entry signal:
Signal to enter the market occurs when the price comes to "Buy zone" then forms one of the reversal patterns, whether "Bullish Engulfing" , "Hammer" or "Valley" in other words,
NO entry signal when the price comes to the zone BUT after any of the reversal patterns is formed in the zone.
To learn more about "Entry signal" and the special version of our "Price Action" strategy FOLLOW our lessons:
Take Profits:
TP1= @ 0.03200000
TP2= @ 0.03770000
TP3= @ 0.04340000
TP4= @ 0.05150000
TP5= @ 0.06190000
TP6= @ 0.07290000
TP7= @ 0.08360000
TP8= Free

There is a probability of resuming the uptrend in LSKETHTechnical analysis:
. LISK/ETHEREUM is in a range bound and the resumption of the uptrend is expected.
. The price is above the 21-Day WEMA which acts as a dynamic support.
. The RSI is at 45.
Trading suggestion:
. There is a possibility of temporary retracement to suggested support zone (0.014410 to 0.012660). if so, traders can set orders based on Price Action and expect to reach short-term targets.
Beginning of entry zone (0.014410)
Ending of entry zone (0.012660)
Entry signal:
Signal to enter the market occurs when the price comes to " Buy zone " then forms one of the reversal patterns, whether " Bullish Engulfing ", " Hammer " or " Valley " in other words,
NO entry signal when the price comes to the zone BUT after any of the reversal patterns is formed in the zone.
To learn more about " Entry signal " and the special version of our " Price Action " strategy FOLLOW our lessons:
Take Profits:
TP1= @ 0.017200
TP2= @ 0.018660
TP3= @ 0.019493
TP4= @ 0.021320
TP5= @ 0.022868
TP6= @ 0.024030
TP7= @ 0.026240
TP8= @ 0.031060
TP9= @ 0.037180
TP10= Free

A trading opportunity to buy in LRCETHTechnical analysis:
. LOOPRING/ETHEREUM is in a range bound and the beginning of uptrend is expected.
. The price is above the 21-Day WEMA which acts as a dynamic support.
. The RSI is at 53.
. The RSI downtrend & The price downtrend in the daily chart are broken, so the probability of the resumption of an uptrend is increased.
Trading suggestion:
. There is a possibility of temporary retracement to suggested support zone (0.00044300 to 0.00038850). if so, traders can set orders based on Price Action and expect to reach short-term targets.
Beginning of entry zone (0.00044300)
Ending of entry zone (0.00038850)
Entry signal:
Signal to enter the market occurs when the price comes to "Buy zone" then forms one of the reversal patterns, whether "Bullish Engulfing" , "Hammer" or "Valley" in other words,
NO entry signal when the price comes to the zone BUT after any of the reversal patterns is formed in the zone.
To learn more about "Entry signal" and the special version of our "Price Action" strategy FOLLOW our lessons:
Take Profits:
TP1= @ 0.00056080
TP2= @ 0.00063120
TP3= @ 0.00081630
TP4= @ 0.00096570
TP5= @ 0.00111550
TP6= @ 0.00132780
TP7= @ 0.00159920
TP8= Free

There is a possibility for the beginning of an uptrend in BCNETHTechnical analysis:
. BYTECOIN/ETHEREUM is in a range bound and the resumption of uptrend is expected.
. The price is above the 21-Day WEMA which acts as a dynamic support.
. The RSI is at 55.
Trading suggestion:
. There is a possibility of temporary retracement to suggested support zone (0.00000880 to 0.00000770). if so, traders can set orders based on Price Action and expect to reach short-term targets.
Beginning of entry zone (0.00000880)
Ending of entry zone (0.00000770)
Entry signal:
Signal to enter the market occurs when the price comes to "Buy zone" then forms one of the reversal patterns, whether "Bullish Engulfing" , "Hammer" or "Valley" in other words,
NO entry signal when the price comes to the zone BUT after any of the reversal patterns is formed in the zone.
To learn more about "Entry signal" and the special version of our "Price Action" strategy FOLLOW our lessons:
Take Profits:
TP1= @ 0.00001050
TP2= @ 0.00001250
TP3= @ 0.00001750
TP4= Free

A trading opportunity to buy in PIVXETHTechnical analysis:
. PIVX/ETHEREUM is in a range bound and the beginning of uptrend is expected.
. The price is above the 21-Day WEMA which acts as a dynamic support.
. The RSI is at 57.
. The RSI downtrend & The price downtrend in the daily chart are broken, so the probability of the resumption of an uptrend is increased.
Trading suggestion:
. There is a possibility of temporary retracement to suggested support zone (0.004400 to 0.003900). if so, traders can set orders based on Price Action and expect to reach short-term targets.
Beginning of entry zone (0.004400)
Ending of entry zone (0.003900)
Entry signal:
Signal to enter the market occurs when the price comes to "Buy zone" then forms one of the reversal patterns, whether "Bullish Engulfing" , "Hammer" or "Valley" in other words,
NO entry signal when the price comes to the zone BUT after any of the reversal patterns is formed in the zone.
To learn more about "Entry signal" and the special version of our "Price Action" strategy FOLLOW our lessons:
Take Profits:
TP1= @ 0.005120
TP2= @ 0.005810
TP3= @ 0.006260
TP4= @ 0.007180
TP5= @ 0.008110
TP6= @ 0.009420
TP7= @ 0.011090
TP8= Free

A trading opportunity to buy is near in BCHETHTechnical analysis:
. BITCOINCASH/ETHEREUM is in a range bound and beginning of uptrend is expected.
. The price is below the 21-Day WEMA which acts as a dynamic resistance.
. The RSI is at 41.
Trading suggestion:
. The price is in a range bound and we forecast the uptrend would begin.
. There is a possibility of temporary retracement to suggested support zone (1.71 to 1.62). if so, traders can set orders based on Price Action and expect to reach short-term targets.
Beginning of entry zone (1.71)
Ending of entry zone (1.62)
Entry signal:
Signal to enter the market occurs when the price comes to "Buy zone" then forms one of the reversal patterns, whether "Bullish Engulfing" , "Hammer" or "Valley" in other words,
NO entry signal when the price comes to the zone BUT after any of reversal patterns is formed in the zone.
To learn more about "Entry signal" and the special version of our "Price Action" strategy FOLLOW our lessons:
Take Profits:
TP1= @ 1.90
TP2= @ 2.00
TP3= @ 2.23
TP4= @ 2.73
TP5= @ 3.23
TP6= @ 3.72
TP7= @ 5.30
TP8= Free

A trading opportunity to buy in NANOETHTechnical analysis:
. NANO/ETHEREUM is in a range bound and the beginning of uptrend is expected.
. The price is below the 21-Day WEMA which acts as a dynamic resistance.
. The RSI is at 45.
Trading suggestion:
. Price is in the support zone (0.010041 to 0.008938), traders can set orders based on Daily-Trading-Opportunities and expect to reach short-term targets.
Beginning of entry zone (0.010041)
Ending of entry zone (0.008938)
Entry signal:
Signal to enter the market occurs when the price comes to "Buy zone" then forms one of the reversal patterns, whether "Bullish Engulfing" , "Hammer" or "Valley" in other words,
NO entry signal when the price comes to the zone BUT after any of the reversal patterns is formed in the zone.
To learn more about "Entry signal" and the special version of our "Price Action" strategy FOLLOW our lessons:
Take Profits:
TP1= @ 0.011500
TP2= @ 0.012660
TP3= @ 0.013485
TP4= @ 0.014110
TP5= @ 0.016336
TP6= @ 0.019970
TP7= Free

A trading opportunity to buy in IOSETHTechnical analysis:
IOSTOKEN/ETHEREUM is in a range bound and the beginning of uptrend is expected.
The price is above the 21-Day WEMA which acts as a dynamic support.
The RSI is at 51.
While the price downtrend in the Daily chart is not broken, bearish wave in price would continue .
Trading suggestion:
. There is a possibility of temporary retracement to suggested support zone (0.00005400 to 0.00004744). if so, traders can set orders based on Price Action and expect to reach short-term targets.
Beginning of entry zone (0.00005400)
Ending of entry zone (0.00004744)
Entry signal:
Signal to enter the market occurs when the price comes to "Buy zone" then forms one of the reversal patterns, whether "Bullish Engulfing" , "Hammer" or "Valley" in other words,
NO entry signal when the price comes to the zone BUT after any of the reversal patterns is formed in the zone.
To learn more about "Entry signal" and the special version of our "Price Action" strategy FOLLOW our lessons:
Take Profits:
TP1= @ 0.000060
TP2= @ 0.000066
TP3= @ 0.000071
TP4= @ 0.000079
TP5= @ 0.000096
TP6= Free

There is a possibility for the beginning of an uptrend in VIBETHTechnical analysis:
. VIBERATE/ETHEREUM is in a range bound and the beginning of uptrend is expected.
. The price is above the 21-Day WEMA which acts as a dynamic support.
. The RSI is at 54.
. While the RSI and the price uptrend in the Daily chart are not broken, bullish wave in price would continue .
. The price downtrend in the daily chart is broken, so the probability of the resumption of an uptrend is increased.
Trading suggestion:
. There is a possibility of temporary retracement to suggested support zone (0.00017140 to 0.00013250). if so, traders can set orders based on Price Action and expect to reach short-term targets.
Beginning of entry zone (0.00017140)
Ending of entry zone (0.00013250)
Entry signal:
Signal to enter the market occurs when the price comes to "Buy zone" then forms one of the reversal patterns, whether "Bullish Engulfing" , "Hammer" or "Valley" in other words,
NO entry signal when the price comes to the zone BUT after any of the reversal patterns is formed in the zone.
To learn more about "Entry signal" and the special version of our "Price Action" strategy FOLLOW our lessons:
Take Profits:
TP1= @ 0.00023450
TP2= @ 0.00029250
TP3= @ 0.00034650
TP4= @ 0.00049900
TP5= @ 0.00071490
TP6= Free

There is a probability for resuming of the uptrend in ETPETHTechnical analysis:
. ETP/ETHEREUM is in a range bound and the Resumption of uptrend is expected.
. The price is above the 21-Day WEMA which acts as a dynamic support.
. The RSI is at 55.
. While the RSI and the price uptrend in the Daily chart are not broken, bullish wave in price would continue .
Trading suggestion:
. There is a possibility of temporary retracement to suggested support zone (0.0141240 to 0.0126770). if so, traders can set orders based on Price Action and expect to reach short-term targets.
Beginning of entry zone (0.0141240)
Ending of entry zone (0.0126770)
Entry signal:
Signal to enter the market occurs when the price comes to "Buy zone" then forms one of the reversal patterns, whether "Bullish Engulfing" , "Hammer" or "Valley" in other words,
NO entry signal when the price comes to the zone BUT after any of the reversal patterns is formed in the zone.
To learn more about "Entry signal" and the special version of our "Price Action" strategy FOLLOW our lessons:
Take Profits:
TP1= @ 0.0167070
TP2= @ 0.0181620
TP3= @ 0.0199670
TP4= Free

There is a probability of resuming the uptrend in LINKETHTechnical analysis:
. ChainLink/Ethereum is in an uptrend and the continuation of uptrend is expected.
. The price is above the 21-Day WEMA which acts as a dynamic support.
. The RSI is at 62.
. While the price uptrend in the Daily chart is not broken, bullish wave in price would continue .
Trading suggestion:
. There is a possibility of temporary retracement to suggested support zone (0.00123000 to 0.00103000). if so, traders can set orders based on Price Action and expect to reach short-term targets.
Beginning of entry zone (0.00123000)
Ending of entry zone (0.00103000)
Entry signal:
Signal to enter the market occurs when the price comes to "Buy zone" then forms one of the reversal patterns, whether "Bullish Engulfing" , "Hammer" or "Valley" in other words,
NO entry signal when the price comes to the zone BUT after any of the reversal patterns is formed in the zone.
To learn more about "Entry signal" and the special version of our "Price Action" strategy FOLLOW our lessons:
Take Profits:
TP1= @ 0.00142900
TP2= @ 0.00167600
TP3= @ 0.00207500
TP4= Free

There is a possibility for the beginning of an uptrend in ICNETHTechnical analysis:
. ICN/ETHEREUM is in a range bound and the beginning of uptrend is expected.
. The price is below the 21-Day WEMA which acts as a dynamic resistance.
. The RSI is at 44.
Trading suggestion:
. There is a possibility of temporary retracement to suggested support zone (0.001600 to 0.001100). if so, traders can set orders based on Price Action and expect to reach short-term targets.
Beginning of entry zone (0.001600)
Ending of entry zone (0.001100)
Entry signal:
Signal to enter the market occurs when the price comes to "Buy zone" then forms one of the reversal patterns, whether "Bullish Engulfing" , "Hammer" or "Valley" in other words,
NO entry signal when the price comes to the zone BUT after any of the reversal patterns is formed in the zone.
To learn more about "Entry signal" and the special version of our "Price Action" strategy FOLLOW our lessons:
Take Profits:
TP1= @ 0.002500
TP2= @ 0.003540
TP3= @ 0.004380
TP4= @ 0.005040
TP5= @ 0.006270
TP6= @ 0.007480
TP7= @ 0.009220
TP8= @ 0.011430
TP9= @ 0.00
TP10= Free

A trading opportunity to buy in CHATETHTechnical analysis:
. CHATCOIN/ETHEREUM is in the uptrend and the continuation of the uptrend is expected.
. The price is above the 21-Day WEMA which acts as a dynamic support.
. The RSI is at 71.
. While the RSI uptrend in the Daily chart is not broken, Bullish wave in price would continue .
. The price downtrend in the daily chart is broken, so the probability of the resumption of an uptrend is increased.
Trading suggestion:
. There is a possibility of temporary retracement to suggested support zone (0.00009260 to 0.00006940). if so, traders can set orders based on Price Action and expect to reach short-term targets.
Beginning of entry zone (0.00009260)
Ending of entry zone (0.00006940)
Entry signal:
Signal to enter the market occurs when the price comes to "Buy zone" then forms one of the reversal patterns, whether "Bullish Engulfing" , "Hammer" or "Valley" in other words,
NO entry signal when the price comes to the zone BUT after any of the reversal patterns is formed in the zone.
To learn more about "Entry signal" and the special version of our "Price Action" strategy FOLLOW our lessons:
Take Profits:
TP1= @ 0.000120
TP2= @ 0.000139
TP3= @ 0.000155
TP4= @ 0.000168
TP5= @ 0.000206
TP6= @ 0.000244
TP7= @ 0.000299
TP8= @ 0.000369
TP9= Free

There is a possibility for the beginning of an uptrend in ONTETHTechnical analysis:
. ONT/ETHEREUM is in a range bound and the resumption of uptrend is expected.
. The price is below the 21-Day WEMA which acts as a dynamic resistance.
. The RSI is at 47.
. While the price downtrend in the Daily chart is not broken, bearish wave in price would continue .
Trading suggestion:
. There is a possibility of temporary retracement to suggested support zone (0.008128 to 0.007406). if so, traders can set orders based on Price Action and expect to reach short-term targets.
Beginning of entry zone (0.008128)
Ending of entry zone (0.007406)
Entry signal:
Signal to enter the market occurs when the price comes to "Buy zone" then forms one of the reversal patterns, whether "Bullish Engulfing" , "Hammer" or "Valley" in other words,
NO entry signal when the price comes to the zone BUT after any of the reversal patterns is formed in the zone.
To learn more about "Entry signal" and the special version of our "Price Action" strategy FOLLOW our lessons:
Take Profits:
TP1= @ 0.009346
TP2= @ 0.010601
TP3= @ 0.012390
TP4= @ 0.014620
TP5= @ Free

There is a possibility for the beginning of an uptrend in SNTETHTechnical analysis:
. StatusNetworkToken/Ethereum is in a range bound and the beginning of uptrend is expected.
. The price is above the 21-Day WEMA which acts as a dynamic support.
. The RSI is at 54.
. The price downtrend in the daily chart is broken, so the probability of the resumption of an uptrend is increased.
Trading suggestion:
. There is a possibility of temporary retracement to suggested support zone (0.00015620 to 0.00014340). if so, traders can set orders based on Price Action and expect to reach short-term targets.
Beginning of entry zone (0.00015620)
Ending of entry zone (0.00014340)
Entry signal:
Signal to enter the market occurs when the price comes to "Buy zone" then forms one of the reversal patterns, whether "Bullish Engulfing" , "Hammer" or "Valley" in other words,
NO entry signal when the price comes to the zone BUT after any of the reversal patterns is formed in the zone.
To learn more about "Entry signal" and the special version of our "Price Action" strategy FOLLOW our lessons:
Take Profits:
TP1= @ 0.00017590
TP2= @ 0.00019370
TP3= @ 0.00021180
TP4= @ 0.00023750
TP5= @ 0.00027000
TP6= @ 0.00029110
TP7= Free

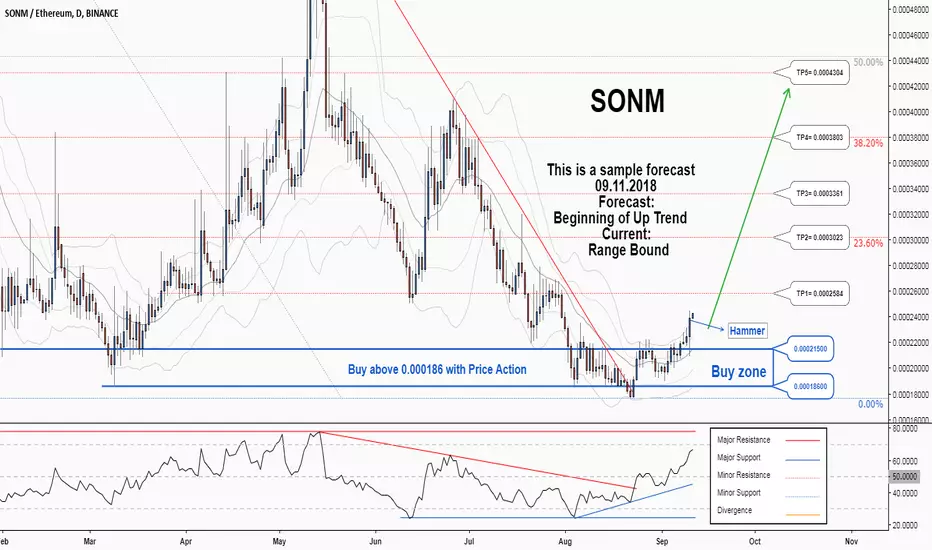
There is a possibility for the beginning of an uptrend in SNMETHTechnical analysis:
. SONM/ETHEREUM is in a range bound and the beginning of uptrend is expected.
. The price is above the 21-Day WEMA which acts as a dynamic support.
. The RSI is at 66.
. The RSI downtrend & The price downtrend in the daily chart are broken, so the probability of the resumption of an uptrend is increased.
Trade Setup:
We opened 8 BUY trade(s) @ 0.00023921 based on ' Hammer ' entry method at 09.10.2018.
Trading suggestion:
. There is still a possibility of temporary retracement to suggested support zone (0.00021500 to 0.00018600). if so, traders can set orders based on Price Action and expect to reach short-term targets.
Beginning of entry zone (0.00021500)
Ending of entry zone (0.00018600)
Entry signal:
Signal to enter the market occurs when the price comes to "Buy zone" then forms one of the reversal patterns, whether "Bullish Engulfing" , "Hammer" or "Valley" in other words,
NO entry signal when the price comes to the zone BUT after any of the reversal patterns is formed in the zone.
To learn more about "Entry signal" and the special version of our "Price Action" strategy FOLLOW our lessons:
Take Profits:
TP1= @ 0.0002584
TP2= @ 0.0003023
TP3= @ 0.0003361
TP4= @ 0.0003803
TP5= @ 0.0004304
TP6= @ 0.0005391
TP7= @ 0.0007097
TP8= Free
A trading opportunity to buy in ZILETHTechnical analysis:
. ZILLIQA/ETHEREUM is in a range bound and the continuation of uptrend is expected.
. The price is above the 21-Day WEMA which acts as a dynamic support.
. The RSI is at 53.
Trading suggestion:
. There is a possibility of temporary retracement to suggested support zone (0.00015200 to 0.00013880). if so, traders can set orders based on Price Action and expect to reach short-term targets.
Beginning of entry zone (0.00015200)
Ending of entry zone (0.00013880)
Entry signal:
Signal to enter the market occurs when the price comes to "Buy zone" then forms one of the reversal patterns, whether "Bullish Engulfing" , "Hammer" or "Valley" in other words,
NO entry signal when the price comes to the zone BUT after any of the reversal patterns is formed in the zone.
To learn more about "Entry signal" and the special version of our "Price Action" strategy FOLLOW our lessons:
Take Profits:
TP1= @ 0.00016580
TP2= @ 0.00017400
TP3= @ 0.00018000
TP4= @ 0.00018770
TP5= @ 0.00021700
TP6= @ 0.00028000
TP7= Free
