Ethereum (ETH) Moves Ahead, Back Above EMA10 +Altcoins UpdateEthereum (ETH) Moves Ahead, Back Above EMA10 +Altcoins Update
Ethereum (ETHUSD) peaked 16-April reaching a new All-Time High, what followed was a sudden but fast correction that took prices all the way down to EMA50 on a wick... Let's see what happens next.
Ethereum Bullish Chart Signals @alanmasters
Yesterday we saw ETHUSD bounce off the EMA21 line to close daily above EMA10 ($2294), this is a bullish signal.
The short-term potential of any altcoin trading pair can be determined depending on where the current active candle is trading compared to the EMA10 indicator.
Above EMA10 we are bullish.
Below EMA10 we are bearish, but this is only short-term.
We also have a very strong RSI above 62 and the MACD on the bullish side as well.
We have an ascending channel/higher highs and higher lows.
The altcoins market, in general, continues to do great, we've seen some short corrections, small retraces, just like Bitcoin did in 2020.
After these small corrections and retraces, we continue growing more and more.
This is expected to continue for the entire year of 2021 and beyond.
What's your take?
Both Bitcoin & The Altcoins Market will continue blessing us with tons of opportunities.
It is a great time to be trading altcoins now.
Remember that patience is key.
Thanks a lot for your continued support.
Namaste.
Search in ideas for "Ethereum"

Ethereum One Day Trend is Started .at least hit 3k $Ethereum One Day Trend is Started .at least hit 3k $

ETHEREUM Still goin good ETHEREUM as we shared, has given a good reversal from the support zone. Fibonacci 38.2% level and 200 MA has acted as a strong support.
Stay updated about Crypto news and different stock analysis on my blog & website
(Coinexpress.tech)

Ethereum looks good if moves above 1690Ethereum moving in a symmetrical triangle pattern and is consolidating near its short term resistance zone. If it starts trading above 1690 it looks good till 1830 level.


Ethereum Technical analysis ETHUSDT Ethereum Technical analysis
ETHUSDT
Flag Target : 445.4
First Target: 393.15
Stop Loss: Below 61.1 (Fibonacci)

EthereumTriangle pattern had been observed on 4 hour ethereum charts.
Entery point - anywhere below $2,800
Target - $3,700
Ethereum had been consolidating inside a fixed range for a while now, this is a potential breakout. If the target hits, there is more potential since it will be above many important moving averages, and EIP1559 will start burning token from 15july, these all signs indicate that Ethereum is currently undervalued mainly because of media FUD, but charts and data shows that long term investors and big players had been accumulating more and more ethereum during this dip.

ethereumare we ready for this
merge is near
and ethereum showing a strong move against BTC
it has formed a ascending triangle in 4hr time if it breaks out we can see a good rally in it
price expectations are 18k in sort time and longer duration if merge goes well eth can be seen at 20-21k


ETHEREUM USDT PERPETUALWait for structure to develop in ethereum and you can go long/short depending on BO/BD

Ethereum Long Term Analysis!Ethereum Long Term Analysis!
Ethereum Monthly Analysis!
Bearish Pennant PAttern formation in Ethereum on Monthy Timeframe!
If price breaks and closes below trendline support we can see further downmove in Ethereum
Ethereum is forming Bearish Pennant pattern. We can see a sharp downmove in Ethereum from 1 dec 2021 after that price is moving in that way like it is forming a Triangle. So the pattern is established. Many of us won't believe for a Ethereum to move this much downward upto 456.75USD. But it's all about Technical Analysis and Pattern identification. I have identified this pattern on Monthly Timeframe. This is how we identify pattern on various timeframe. Greater the timeframe more reliable it would be, So i have done my analysis on Monthly timeframe to predict long term move of an Ethereum. Crypto is very uncertain instrument so we can't imagine how it will move, right? But this is how we perform technical analysis! That's all i have to say!
The downward possible target for an Ethereum is 456.75 USD!

Ethereum: Bearish view for this monthThis is not an investment advise!!!
Head and shoulders pattern formation on ethereum on a Daily timeframe
Target should be around 3400 levels.
* I'm not an expert analyst. This is something is just learnt, so I'm sharing this with public.
If you guys find anything wrong with this post, you can tell me about that in comments.
Have a nice day!😄

Ethereum 1D Update- The real bottom for Ethereum is in and I do not think Ethereum is going to fall any further
- After BTC ETF Approval too we saw BTC Crashing 20-30% and the same is happening with Ethereum as well
- Ethereum point of interest should be 2700-2850$
- Any underneath that things can get very scary IMO
- As long as your horizon is long term you shouldn't get bothered much at all
- For short term traders you can look for swing around 2800$

Ethereum Technical Analysis - ETH has been very dominant in the crypto market recently because of its ETF Approval
- A lot of people are missing out on the S-1 Form Approval and bought the FOMO
- Institutions are going to bring back prices to the equilibrium and make sure they are accumulating things for cheap
- 3100-3400$ can act as a very strong Demand/Area Of Interest that can easily bring price down and then show another impulsive move towards 5000$
- Ethereum looks bearish as of now/short term so take decisions accordingly

ETHEREUM Broken Bull Flag so Now Target is $2800 as per Chart#Ethereum Market Update: On the Way to $2800!
Current Status:
Ethereum (#ETHUSDT) has shattered the $2300 resistance mentioned in the last post and is now trading above $2400.
Bull Flag Resistance Broken at $2255, with a successful retest at $2200.
Analysis:
Bullish momentum continues, setting the stage for a push towards $2800.
Caution: In the event of a market downturn due to negative news, anticipate a potential retest at $2290-$2300 before the upward journey to $2800.
Critical Levels:
Resistance Broken: $2255
Retest Completed: $2200
Bullish Target: $2800
Important Note:
Sustaining below $2200 may shift #ETHUSDT into Bearish Mode.
Stay tuned for real-time updates!
Join And follow me for More Quality analysis.
Thank you.
#EthereumUpdate #CryptoTrading #ETHAnalysis

ETHEREUM STRONG UPSIDEWith technical analysis, Ethereum will break its current level and reach 2200 USD. Bullish in long term, with increasing in volume.

Ethereum Trading Plan for 6-7 FebMy view on Ethereum today is extremely bullish. But overall I am expecting it to give a good move on either side which I am sure would be caught by my system. Here's what it looks like:
In this chart of Ethereum I have marked 4 price levels which have been determined based on a proprietary calculation that I have developed. The zone between the top-most and bottom-most price levels is a strict "No Trade Zone".
If Ethereum's price crosses the top-most price level, we will be looking for long opportunities and if Ethereum's price crosses the bottom-most price level, we will be looking for short opportunities.
Entry criteria:
Bullish case: Enter as soon as a 5-minute candle CLOSES above the top-most price level.
Bearish case: Enter as soon as a 5-minute candle CLOSES below the bottom-most price level.
Stop Loss criteria:
Risk: 2% of capital of per trade.
Bullish case: Just below the second price level from the top.
Bearish case: Just above the second price level from the bottom.
Take profit criteria:
I personally follow a system wherein I do nothing until 1:1 RR is achieved. But post 1:1 RR is achieved, I adjust stop loss to cost. I then exit 1/3rd of entered quantity based on 5 minute candle close below ( bullish case) or above ( bearish case) 15 EMA . I exit 1/3rd of entered quantity at fixed take-profit level of 1:3 RR. And I exit the final 1/3rd of entered quantity based on a system of setting stop losses that are dynamically adjusted to the nearest retracement after a Day High Breakout (in bullish case) or Day Low Breakout (in bearish case).
I have also experimented with systems wherein you can set take-profit at a fixed level of 1:3 RR or alternatively after 1:1 is achieved book full quantity vased on 5 minute candle close below ( bullish case) or above ( bearish case) 15 EMA . Both of these alternative systems have also been profitable.
Please note the given zones are valid only until the end of the day. Any open positions must be closed by 05:25 AM IST which is around when the day is about to end in the cryptocurrency markets.
Also please note: according to the rules of my system, I don't take more than 3 trades per day on any asset.

#Ethereum Trading Plan 24-25 Jan 2022In this chart of Ethereum I have marked 4 price levels which have been determined based on a proprietary calculation that I have developed. The zone between the top-most and bottom-most price levels is a strict "No Trade Zone".
If Ethereum's price crosses the top-most price level, we will be looking for long opportunities and if Ethereum's price crosses the bottom-most price level, we will be looking for short opportunities.
Entry criteria:
Bullish case: Enter as soon as a 5-minute candle CLOSES above the top-most price level.
Bearish case: Enter as soon as a 5-minute candle CLOSES below the bottom-most price level.
Stop Loss criteria:
Risk: 2% of capital of per trade.
Bullish case: Just below the second price level from the top.
Bearish case: Just above the second price level from the bottom.
Take profit criteria :
I personally follow a system wherein I do nothing until 1:1 RR is achieved. But post 1:1 RR is achieved, I adjust stop loss to cost. I then exit 1/3rd of entered quantity based on 5 minute candle close below ( bullish case) or above ( bearish case) 15 EMA . I exit 1/3rd of entered quantity at fixed take-profit level of 1:3 RR. And I exit the final 1/3rd of entered quantity based on a system of setting stop losses that are dynamically adjusted to the nearest retracement after a Day High Breakout (in bullish case) or Day Low Breakout (in bearish case).
I have also experimented with systems wherein you can set take-profit at a fixed level of 1:3 RR or alternatively after 1:1 is achieved book full quantity vased on 5 minute candle close below ( bullish case) or above ( bearish case) 15 EMA . Both of these alternative systems have also been profitable.
Please note the given zones are valid only until the end of the day. Any open positions must be closed by 05:25 AM IST which is around when the day is about to end in the cryptocurrency markets.
Also please note: according to the rules of my system, I don't take more than 3 trades per day on any asset.
P.S. Give the prevailing sentiment - I am biased towards the downside today.

ETHEREUM important levels and in a parallel channel ETD/USD has been following a parallel channel for a couple of months.
Ethereum has been following a rise and fall pattern while being in a parallel channel and following the channel.
Keeping in mind the current crypto rush we can expect Ethereum to follow the same channel unless there is a breakout from the resistance zone or a sell-off from the support zone.

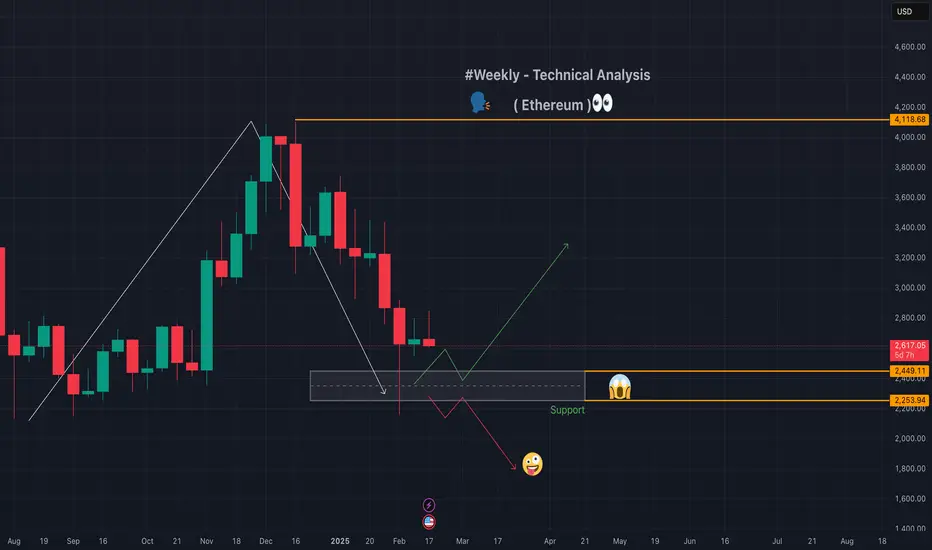
Ethereum - Technical - Weekly❣️#Ethereum has been experiencing a downward trend with lower highs and lower lows, suggesting a bearish outlook in the short term. However, there are signs of a potential sideways movement in the very short term.
sharing a 📉chart for your reference so any body can learn and make decision.💟
Ethereum: The Sleeping Giant!It is pretty evident that Ethereum is forming a falling wedge pattern, which mostly breaks to the upside. We are in for a treat!
The breakout could be anytime soon, with TRUMP already taking office and signing crypto orders from DAY 1 !
The Time Is Now. if you are not holding ETH. it's about time!

Ethereum Swing Trade Update- Bitcoin has moved up massively
- It's time for Ethereum to move up and show some great impulsive moves as well.
- Hold Eth do not trade it or sell it cheap
- ETH can easily reach 5,000$ conservative target and a realistic one
- Not selling dreams of 10-20k$ but yeah 5,000$ looks easy for ETH

Ethereum crash might continue. The current trend in Ethereum is on the downside in the daily time frame and also the MACD is indicating a sell signal.
