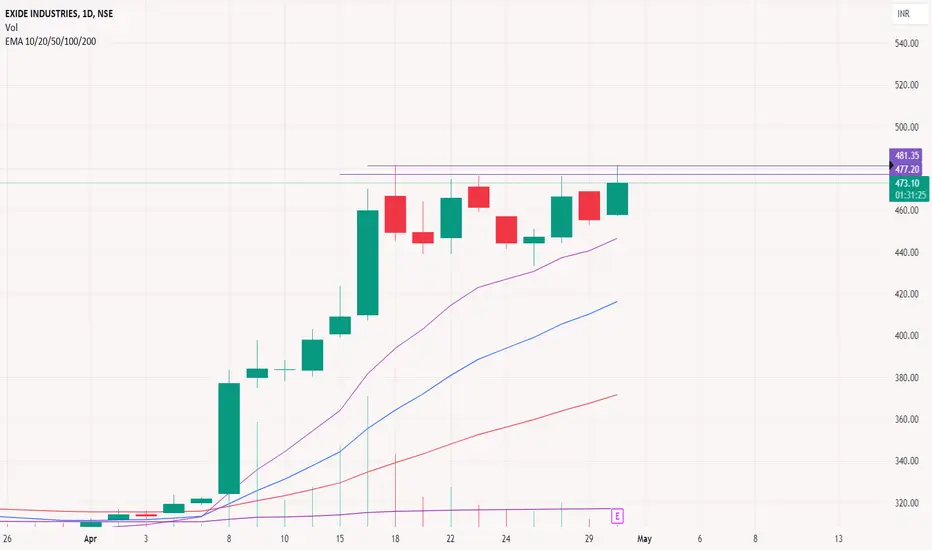
EXUDENSE:EXIDEIND
One Can Go long with a Strict SL below the Trendline or Swing Low of Daily Candle.
Close should be good, and Clean.
R:R ratio should be 1 :2 .
Disclaimer : You are responsible for your Profits and loss, Shared for Educational purpose
Search in ideas for "Exide"


Amara Raja Batteries - Target 1110 Upside 60%Stock seems to have entered minor wave 3 of the third intermediate of fifth primary. Stock took long time consolidating in wave 4 from 2015 to 2020 which marked the end of a double correction. The next upswing that started from 23 march 2020 (post corona) could either be X - paving way for triple correction or wave 1 of primary fifth. Both the interpretations are convincing. The upswing that ended in the week of 3rd July, should have been a 3 wave structure, if triple correction was underway. Moreover, the goal of fourth primary was attained far more than what was adequate and the stock lingered sideways. I am convinced that the wave that ended in week of 3 July 23 was an impulse, and should have retraced to 535, but the previous primary 4 which overarched itself, its 50% level prevented decline. Its primary 3 was highly exaggerated and therefore primary 4 took a very long time. Current wave, being termed as minor 3, may, if it proves to be triple correction, most likely be a flat or triangle in tight range bound movement as retracement targets have been met with spillover and the only target left is to do some more time-pass before marching on next journey. I am opening longs with target of 1,110 suggesting an upside of 60%. This is the target of cycle three and reasonably estimated primary 5 too. Since its a huge upside, the stop loss levels are deep, which I am willing to face as I believe in the fundamental story and future growth from Li-ion batteries project. What impresses me further is that in past 5 years it has invested nearly INR 3000 crores all from cash flows, despite paying back to lenders. Virtually a debt free company, second in market size, better in profitability, growth and valuations than Exide, low beta of approx. 0.6, the company is a nugget of gold in the portfolio - and - available at mouth watering valuation. Its peer, Exide, the market leader is twice as costly and has higher unlevered beta. Since wave theory itself is giving me enough confidence, am not spending any energy on alternative confirmation from deep technical analysis, though top 10 indicators support the view.
Basis swing theory, it has touched the reactive 50% level and the stock may face some turbulence there, if it falls down, it may not fall much for lack of any targets to be achieved.
Disclaimer : The contents herein are my personal views, for me to make an investment decision, shared here with an objective of seeking views and comments from traders community at trading view platform. Nothing contained herein should be construed as an advice, offer, inducement or encouragement to buy or sell any shares, security, derivatives linked to the security, debt security or any other security of the company mentioned herein. The readers must make their own independent assessment, evaluation and valuation of the company and/or any of the securities issued by it or referenced to it. The reader is advised to take advice from their professional financial advisors before entering into any transaction or making a financial decision, without relying on anything contained hereinabove, or views given as addendum or comments hereafter. The author shall not be responsible or liable, directly or indirectly, for any loss or damage, including loss of profits, caused to the reader, or any other person or third party, whether pecuniary or otherwise, whether in present or in future, whether incurred or probable. Any replication of the contents herein is strictly prohibited except with the prior written consent of the author.

CONCEPT OF TWIN TRENDLINES - A BULLISH CASE CONCEPT OF TWIN TRENDLINE
Long term wealth is generated through capture of trending move in a stock. The skill is in reading the chart and determining whether the trend has commenced. There are several means which are widely used to find the trend:-
-Oscillators
-EMA and its slope.
-Darvas box
-HH & HL market structure
-Formation of pivots
-Elliot Wave
All above methods are effective and can be used to take trade. However, to effectively time the trade I have put forth this concept of twin trendline. This is not a holy grail and several variations of this concept can be seen on the charts. The cardinal rule for following twin trendline concept is that the price shouldn’t have broken the previous swing low on weekly charts for a bullish long.
At times price breaks the box only to fall back in the box. It is not necessarily a false breakout but price needs more time to complete accumulation thereby preparing for next move. Twin trendline works best in such cases. This concept with its variations is applicable on all timeframes and on all asset classes. The twin trendline works most of the time but sometimes when the correction is deep even triple trendlines can be seen.
The price before trend reversal goes through motions of divergence, basing, retracement and time corrections. The stock alternates between time and price corrections within the box. After an extended price correction or retracement the price moves along the trendline thereafter to give a breakout from the first trendline to form a false higher high structure and later only to continue the trend along second trendline. (See above example)
The example of exide industries chart classically depicts the twin trendline concept. Reflex point (WILL ELABORATE SEPARATELY AGAIN) is penultimate point on the first/second trendline which needs to broken for establishment of trend. When price is consolidating a reflex point can be seen along second trendline. This point then forms a crucial pivot to understand the turn around in the price structure. In instant case of Exide industries 215 is the crucial resistance level(False HH) which needs to broken and sustained till the price reaches the mean of pitchfork ie around 240 levels. This will definitively give a HH structure for the stock.
Confluence of factors – Box being broken which should be with momentum and on volumes, reflex point on second trendline being broken, the price touches the mean of pitchfork, formation of HH structure.(One needs to monitor the period of time for all these happenings).
Time to take trade. It is felt after this price correction there may be a time correction wherein price may fall back to the box. A doji/hammer followed by a weekly green candle would be a time to take trade for capturing long term move or big move.
RSI. On both monthly and weekly charts is pointing northwards which is sure sign that stock should catch momentum. It is found that low priced stocks take time to catch momentum burst which happens only intermittently.
The angle of twin trendlines also matter to understand the geometry of vibration as to whether the stock is trending. Acute the angle longer it will take to catch momentum, obtuse the angle faster will be the move. The time spent in the box is also a measure for trend qualification. Sometimes extended time correction in the box is owing to bad results, overall directionless market, sector rotation or some bad news. When stock is in momentum the price at times crosses the reflex point on first trendline only to continue the trend.
Summary - Watch market structure of twin trendlines, wait for price to cross reflex point on second trendline, price should form HH structure, validate it through pitchfork, wait for retracement back to box, wait for candle sticks pattern of a doji and momentum candle on weekly chart to take trade.
Views Welcome
Regards
Disclaimer : This post is for educational purposes only

#HDFCLIFE on wkly close abv 617, opens up targets of 686#HDFCLIFE
Reverse Head and Shoulder pattern formation, with neck at 600 and shoulder at 520
on wkly close abv 617, opens up targets of 686
incidentally #exide was issued ~4% of #hdfclife stock at 685 post the Exide acquisition


JINDALSTEL GOOD BUY SIGNALJINDALSTEL
CMP 276.1
Above 278 may go upto 305
TGT 288/297
Keep on radar exide.
Disclaimer: Ideas for learning Only.

CIPLA GOOD BUY SIGNALCIPLA
CMP 821.6
Looks a breakout candidate for a up move all good till 804 lvs is intact clbs !!
TGT may be 839.3/859.4
Keep on radar exide.
Disclaimer: Ideas for learning Only.

intraday buy exideinda if break day highbuy above 160.60
sl 160 small risk high profit
trade ur own risk

Amara Raja Energy for 60% gainsDate: 30 Oct’24
Symbol: ARE_M
Timeframe: Daily
Amara Raja Energy & Mobility seems to have begun Wave V of 3 which is heading towards 2150 (60% from current price of 1350) as seen in the chart. Once it has crossed 1450, its five waves can be established. Both volume pop out and RSI strength support this view.
This is not a trade recommendation. Please do your own analysis.
HINGLISH VERSION
Aisa prateet hota hai ki Amara Raja Energy & Mobility ne 3 ki Wave V shuroo kar di hai jo 2150 (vartamaan price se 1350 se 60%) ki taraf badh rahi hai, jaisa ki chart mein dekha gaya hai. Ek baar jab yah 1450 ko paar kar jae, to iski 5 Wave sthaapit ki ja sakti hain. Volume pop out aur RSI ki majbooti donon is drshtikon ka samarthan karte hain.
Yah koi trade lene ki salah nahin hai. Kripya apna vishleshan khud karen.

EXCIDE ASCENDING TRIANGLE BREAKOUTExcideIndustreise breaking ascendig triangle pattern
with volume spike and strong rsi
trading above 20ema
#target 600
EDUCATIONAL IDEA ONLY

Inverse Head & Shoulder breakout on Monthly chart Considering the movement in the Auto sector and the major revolution going on in the EV industry, it is very likely that this stock can perform well in the next 6 months to 2 years.
1. the "Inverse Head & Shoulders" pattern has a clear breakout on the monthly charts.
2. The volumes are also increasing.
3. Target could be the all-time high price in a period of 6 months to 2 years.
Stop loss - below the current swing low on the monthly chart.
Disclaimer: This is for educational purposes only; kindly consult your financial advisor before investing.
-> Not a recommendation

breakout tradebreakout for targets to 236 and above
stop below 207
deeper 194
disclaimer - trade @ own risk


High conviction / value buy stock pick - EXIDEINDCheck this stock which has made an all time low and high chances that it makes a "V" shaped recovery.
> Taking support at last years support or breakout level
> High chances that it reverses from this point.
> Volume dried up badly in last few months / days.
> Very high suspicion based analysis and not based on chart patterns / candle patterns deeply.
> VALUABLE STOCK AVAILABLE AT A DISCOUNTED PRICE
> OPPURTUNITY TO ACCUMULATE ADEQUATE QUANTITY
> MARKET AFTER A CORRECTION / PANIC FALL TO MAKE GOOD INVESTMENT
DISCLAIMER : This is just for educational purpose. This type of analysis is equivalent to catching a falling knife. If you are a warrior, you throw all the knives back else you will be sorrow if it hits SL. Make sure to do your analysis well. This type of analysis only suits high risks investor and whose is willing to throw all the knives above irrespective of any sectoral rotation. BE VERY CAUTIOUS AS IT IS EXTREME BOTTOM FISHING.
HOWEVER, THIS IS HOW MULTIBAGGERS ARE CAUGHT !
STOCK IS AT RIGHT PE / RIGHT EVALUATION / MORE ROAD TO GROW / CORRECTED IV / EXCELLENT BOOKS / USING MARKET CRASH AS AN OPPURTUNITY / EPS AT SKY.
Time makes money, GREEDY & EGO will not make money.
The real deal is when to purchase and where to purchase the stock.
LET'S PUMP IN SOME MONEY AND REVOLUTIONIZE THE NATION'S ECONOMY!

Flag & Poll Pattern Flag & Poll Pattern
EXIDEIND
+ Building up at the resistance
+ Good Volume buildup
+ Above Key EMAs
-: Not a Buying recommendation

Short Term Swing Trading Idea in Muthoot Fin for > 15% UpsideHi,
EXIDEIND
has given a Bullish Flag Breakout on Daily charts with very good volume.
MACD is also on the bullish side on Weekly and Monthly time frames. RSI is also on the bullish side on daily, weekly and monthly time frames.
In the current market scenario, I am expecting that the bullish momentum will continue.
Complete price projection like entry, stop loss and targets mentioned on the charts for educational purpose.
Don't Forget to Follow me to get all the updates.
Please share your feedback or any queries on the study.
Disclaimer: Please consult your financial advisor before making any investment decision.

Flag & Poll Pattern Flag & Poll Pattern
EXIDEIND
+ Great prior uptrend with volume
+ Low Volume Halt
+ Above Key EMAs
-: Not a Buying recommendation
Amazing breakout on Weekly / Daily Timeframe - EXIDEINDCheckout an amazing breakout happened in the stock in Weekly timeframe, macroscopically seen in Daily timeframe. Having a great favour that the stock might be bullish expecting a staggering returns of minimum 25% TGT. IMPORTANT BREAKOUT LEVELS ARE ALWAYS RESPEECTED!
NOTE for learners: Place the breakout levels as per the chart shared and track it yourself to get amazed!!

📈 Exciting Bullish Pattern Alert! 🐂📈 Exciting Bullish Pattern Alert! 🐂
📊 Pattern: Broadning Pattern
📌 Symbol/Asset: EXIDEIND
🔍 Description: Stock is forming broadning pattern and around 255 there are multiple supports are coming.
👉 Disclosure: We are not SEBI registered analysts, this is not a buy or sell recommendation. Technical patterns are just one piece of the puzzle. Consider conducting further research, consulting with a financial advisor, and managing your risks appropriately.

BUY TODAY SELL TOMORROW for 5% DON’T HAVE TIME TO MANAGE YOUR TRADES?
- Take BTST trades at 3:25 pm every day
- Try to exit by taking 4-7% profit of each trade
- SL can also be maintained as closing below the low of the breakout candle
Now, why do I prefer BTST over swing trades? The primary reason is that I have observed that 90% of the stocks give most of the movement in just 1-2 days and the rest of the time they either consolidate or fall
Trendline Breakout in EXIDEIND
BUY TODAY SELL TOMORROW for 5%

Cup and Handle pattern breakoutToday I picked EXIDEIND because, it broken Cup and Handle resistance on closing basis. The following factors are considered by me for picking this.
1. Huge Volumes at breakout.
2. Cup and handle Pattern
For BTST trades Keep profit as 2% - 3%
Keep SL and Target profits mentioned on the chart for short term swing trades.
Please consider these for educational purposes
