Search in ideas for "Exide"

Exide Industries TrendlineExide industries is following a short term trend line. Indicators are positive.
Stock Reversed from the support of 177.
Bullish move can be seen in coming days.
Be cautious of the trend line break in opposite direction.
First Target will be 210.

#EXIDE INDUSTRIES #LONG Exide Industries has given a resistance breakout today at around 194.5- 195 levels and has successfully closed above the resistance at 196 levels. The breakout has come after 10 days of range bound price movement,hence a rally can be expected towards the next resistance point which is at 209-210 levels.

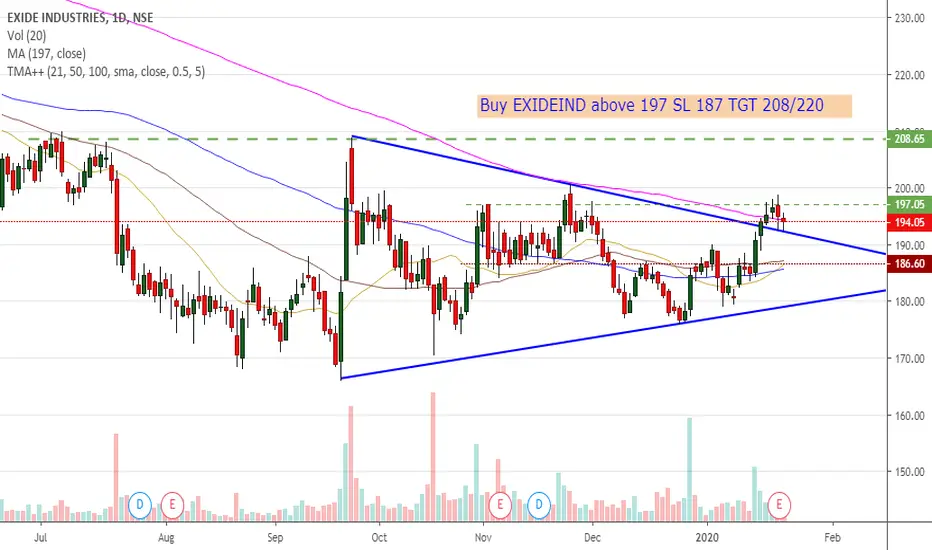
Exide industries to take long longExide industries at the BO level . Long after the Bo of TL above 193 TGT 212 SL 186. Good volume seen today. This is for your educational purpose only.

EXIDE IND BREAKOUT DONT MISS.Exide Ind is making a good breakout from its 200 to 208 resistance levels.

Exide Industries Re-entering its upward trendline - BULLISH VIEWExide Industries Limited is an Indian storage battery producing company. It is the largest manufacturer of automotive and industrial lead-acid batteries in India and the fourth-largest in the world. The fundamentals of the company are great. As per technical analysis, it has been in a primary upward move since march lows and after the recent downfall, it has again re-entered into its primary upward trendline and is supported by MACD and ADX positive signals, one can have a bullish view on it.


Exide India Trend OverviewExide CMP 182.05
For Short term buy level at 190 Target 194/198/203
Stop loss 187
Sell level 175.50 Target 173/170 stop loss 178
Overview: time to accumulate

Exide Industries Ltd - Breakout Setup, Move is ON...#EXIDEIND trading above Resistance of 527
Next Resistance is at 595
Support is at 445
Here are previous charts:
Chart is self explanatory. Levels of breakout, possible up-moves (where stock may find resistances) and support (close below which, setup will be invalidated) are clearly defined.
Disclaimer: This is for demonstration and educational purpose only. This is not buying or selling recommendations. I am not SEBI registered. Please consult your financial advisor before taking any trade.

Exide Industries Ltd - Breakout Setup, Move is ON...#EXIDEIND trading above Resistance of 415
Next Resistance is at 527
Support is at 304
Here are previous charts:
Chart is self explanatory. Levels of breakout, possible up-moves (where stock may find resistances) and support (close below which, setup will be invalidated) are clearly defined.
Disclaimer: This is for demonstration and educational purpose only. This is not buying or selling recommendations. I am not SEBI registered. Please consult your financial advisor before taking any trade.

Exide Industries Ltd - Long Setup, Move is ON...#EXIDEIND trading above Resistance of 304
Next Resistance is at 415
Support is at 235
Here are previous charts:
Chart is self explanatory. Levels of breakout, possible up-moves (where stock may find resistances) and support (close below which, setup will be invalidated) are clearly defined.
Disclaimer: This is for demonstration and educational purpose only. This is not buying or selling recommendations. I am not SEBI registered. Please consult your financial advisor before taking any trade.

Exide Industries Ltd - Long Setup, Move is ON...#EXIDEIND trading above Resistance of 266
Next Resistance is at 304
Support is at 214
Here are previous charts:
Chart is self explanatory. Entry, Resistances and Support are mentioned on the chart.
Disclaimer: This is for demonstration and educational purpose only. This is not buying or selling recommendations. I am not SEBI registered. Please consult your financial advisor before taking any trade.

Exide Industries Ltd - Long Setup, Move is ON...#EXIDEIND trading above Resistance of 235
Next Resistance is at 266
Support is at 193
Here is previous chart:
Chart is self explanatory. Entry, Resistances and Support are mentioned on the chart.
Disclaimer: This is for demonstration and educational purpose only. This is not buying or selling recommendations. I am not SEBI registered. Please consult your financial advisor before taking any trade.

EXIDEIND - Crossing 170 decisively could push higher EXIDEIND - Strong upmove after 170 seen if another session seen with buying

EXIDEIND retesting resistance zoneEXIDEIND price action retesting the resistance zone near 205. made cup and handle breakout at 205. go long for target of 240 keep stop loss below 190. from last three week stock is holding 193 has strong support zone.

Exide India Monthly support breakoutExide India broken the resistance which acted as support for multi year since 2009
support on
Mar 2009
Feb 2014
Feb 2016
broken the resistance on the monthly TF trendline now
Go Long

Exide Industries - Weekly Exide Industries - Weekly
Stock currently trading at multi year resistance, Crossing it will become support
Weekly close and now trading above 200 EMA, huge accumulation clearly shown in volume at 160-170 levels
one can buy only above 198 on closing basis for intermediate targets of 230-240.
Note- Weekly chart should be considered for 3-6months time span

#EXIDEIND #BANKNIFTY #NIFTY #TRADING #BANK #FINANCIAL #INVEST #EXIDEIND
CMP 185.80
Target 220++
May Hold After Target Reached.
If you like my work, KINDLY LIKE, SHARE, & FOLLOW THIS PAGE for latest stock recommendations for free.
NSE:EXIDEIND

EXIDEIND - SHORTING OPPORTUNITYExideind has given multiple confirmations for upcoming downward movement. 1. Trendline Breakout 2. Resistance 3. Shooting star Candle 4. Retracement from 0.38 level.

EXIDEIND monthly chart analysisEXIDEIND monthly chart analysis.
Buy after a monthly candle closes above the trendline with stop loss below 240

EXIDE BREAKOUTExide looks strong on weekly chart by breaking falling trendline resistance with good volume jump and breaking Bollinger upper band too and gives a bullish closing on above both so that we can see coming bullishness in this counter.
Cause of long-:
1- Falling resistance breakout.
2- Bollinger bands breakout.
3- Volume breakout.

EXIDE Hourly looking bullishEXIDE Hourly looking bullish.. having trendline brekout/flag and pole like structure..
Good to buy at 193 for target of 197,202 with sl below 190.50
