Fibonacci retracementFibonacci retracement in 1 hr time frame our level of buying is 61 and 78 levels if candle closed below 78 level we exited all positions
Search in ideas for "FIBONACCI"

Fibonacci Circles with Fibonacci WedgesFibonacci Circles with wedges..there are three points of concern..
1.high to low & low to high circles made with ther crosses made suport/resistance on lower & upper part.
2.low to high wedge made support with below line of wedge similarly high to low wedge are resistance with upper line of wedge.
3.circles crosses should be noted inside wedges & outside wedges.

Fibonacci Support AnalysisFibonacci retrenchment is universily verified thought that no body moves continuosly but it takes break in journey and this rule is more valid in the share market , there are so many Fibonacci percentage but I use Only three that is 0% 50% &100% . If any stock price touch to 0% and 100% it must move if there is no news...first axit at 50%.
Currently this stock about to touch 100 % so we will observe and when it comes to near we may buy...7808133909

Fibonacci Retracement on recent Bank Nifty SwingFibonacci Retracement (61.8%) on recent Bank Nifty Swing.
Disclaimer: No Trading advice, view for study purpose.

FIBONACCI not a great fan of fibonacci . . but found out some charts respecting fibonacci numbers.
infosys. on monthly charts on every swing the market retraces back to 50% fibonacci levels, i have marked the earlier two swing levels and its 50% retracement levels. if we consider the current swing levels 860-1400. its 50% retracement levels goes back to 1130. . will see what the market is doing . . any comments always welcome

FIBONACCI PROJECTIONS FOR BANKNIFTY SPOT - 26-APR-2023The plotted levels are Fibonacci projections for BANKNIFTY spot for 26-APR-2023. These levels are automatically plotted through my indicator.

FIBONACCI PROJECTIONS FOR NIFTY SPOT - 26-APR-2023The plotted levels are Fibonacci projections for NIFTY spot for 26-APR-2023. These levels are automatically plotted through my indicator.

Fibonacci confluence area The Fibonacci weekly retracement levels are at 0.5
On the daily chart the 1.2 fibonacci expansion is in confluence with the 0.5 retracement.
In my opinion the present rally might be over and the prices might retrace from thereon i.e. 500


Fibonacci confluenceJust dial is in an uptrend with good volumes. The area of 596-600 is a confluence of two Fibonacci ranges. Sustenance above 600 can be used to initiate longs till 615 where resistance from 200 EMA can be seen. If 615 levels are broken, stock can travel upto 630-633 levels Intra-day.

Fibonacci RetracementFibonacci retracement levels—stemming from the Fibonacci sequence—are horizontal lines that indicate where support and resistance are likely to occur.
The indicator is useful because it can be drawn between any two significant price points, such as a high and a low. The indicator will then create the levels between those two points.
Script = Heromotocorp
Time Frame = 1 Day

fibonacci reversal trade / falling parallel channel patternhindpetro : 209.20
trade set up :
1. buy range 208 to 210
2. stop loss 196 on closing basis
3. targets : 215/ 225 / 238 / 245 / 266+
technical setup :
1. midpoint parallel channel support trade
2. falling parallel channel
3. fibonacci 78.6% reversal
4. trend line support
5. value pick
6. support & resistance trade

Fibonacci Circles with wedgesFibonacci Circles with wedges..there are three points of concern..
1.high to low & low to high circles made with ther crosses made suport/resistance on lower & upper part.
2.low to high wedge made support with below line of wedge similarly high to low wedge are resistance with upper line of wedge.
3.circles crosses should be noted inside wedges & outside wedges.

Fibonacci levels 1.618 golden ratio Analysis 22.09.2021BUY 1876 TO 1949
TARGET 2542 TO 2658
Reason For Buying This Script :
In this script it is forming channel line & trend line in weekly time frame, Try to accumulate current levels.
And it also respecting the Fibonacci levels 1.618 golden ratio.
Note :
Above given levels are based on monthly & weekly time frame . So be patience it will take some days to achieve the target.
ALL THE BEST ..

Fibonacci Magic for Mahindra!A Fibonacci Retracement of 50% has been seen at 230 levels which are acting for the support.

Fibonacci Support Levels for Nifty in 2021Fibonacci Support Levels for Nifty in 2021 as shown on the chart. Important levels to look out for. Might be a good accumulation time when these levels are reached.

NIFTY Fibonacci retracement levelsFibonacci retracement levels indicate where support is likely to occur.
Here as per the rally taking place from recent bottom, 23.6% retracement can happen till 13600 which is also the bottom created before the Budget day and hence will act as strong support.
Below that, 38.2% level is 12430, which also happens to be the previous top, this again will act as very strong support during retracements.

Fibonacci Agreement PointFibonacci Agreement Point between 58 to 60.
This will be a good resistance level.

Fibonacci Confluence day trading idea 23/12/2019Go long above 580 with a SL of 574.5 with the first target at 596-600 levels and second target at 605. Stock is at the zone of two Fibonacci range confluence and has closed above 200 EMA on daily timeframe with good strength (volumes). Furthermore, RSI has entered the trending zone of >50 (three days ago) which makes the stock bullish.


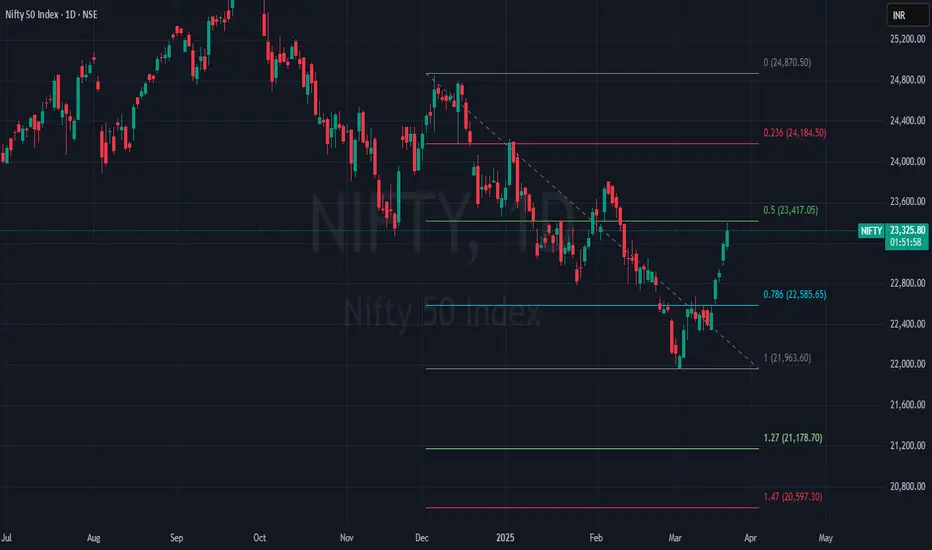
NIFTY 50 : Fibonacci Levels and Potential MovementsLooking at the recent Fibonacci retracements on Nifty, we’ve observed a pattern where the price tends to reverse from the 0.5 level and move towards the 1.47 extension level. Let’s take a closer look at the last three Fibonacci retracements:
1) 26777 to 23263
2) 24857 to 23460
3) 24857 to 22786
Now, if we plot Fibonacci from 24857 to 21965, the 0.5 level comes out to 23415. As we’ve seen in previous cases, the price tends to return from the 0.5 level.
If Nifty forms a red candle on a daily basis at this level (23415) and the next candle breaks the low of the previous candle, then there is a possibility for Nifty to reach the 1.47 extension level, which is around 20600.
VIP Industries - Fibonacci AnalysisVIP Industries - Fibonacci Analysis on a weekly time frame.
A perfect imbalance and Retracement has been observed. Price has entered the demand zone and now trending towards the uptrend.

HCL TECH - 1D TF Fibonacci retracementHCL Tech has perfectly moved up after taking retracement at 61.8% Fibonacci levels along with good volume.
Target 1- 1247
Target 2 - 1310
DO YOUR OWN ANALYSIS.
