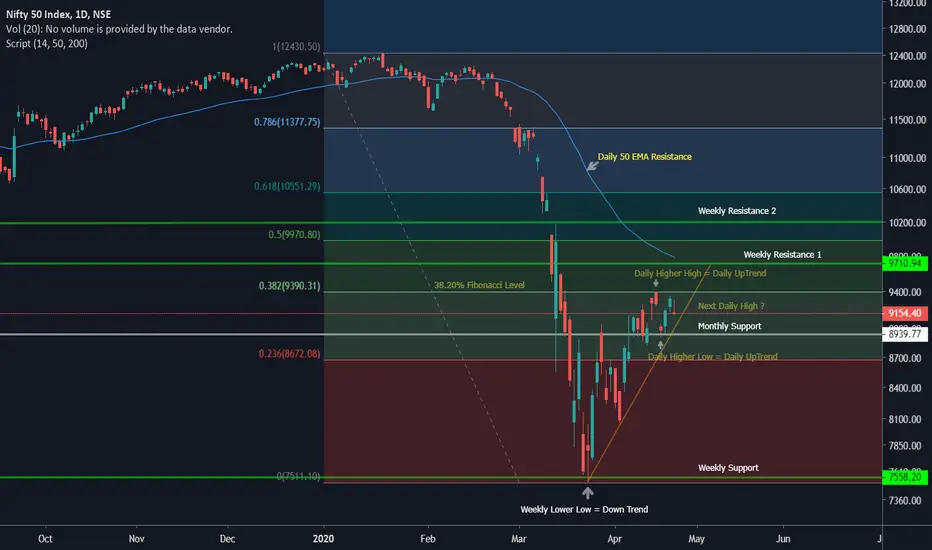
Nifty 50 near 38.20% Fibonacci Level 9400 = WAIT NEUTRAL
If Nifty 50 NSE:NIFTY does not Break the 38.20% Monthly Fibonacci Level = 9400, What Next?
Case 1: If Nifty stays Neutral and above 75mins 50EMA without retracing back to Monthly Support and Breaks the 38.20% in next few trading sessions = It is successful in making a Higher High Daily Swing more than 9390.85 of 20th April, indicating the continuation of Daily UpTrend.
Assuming the above case is false, then Case 2: If Nifty goes back to Monthly Support = It failed to make a Higher High Daily Swing more than 9390.85 of 20th April, Forming a Daily Lower Higher, indicating the end of Daily UpTrend + It also broke the 75mins 50EMA indicating a 75mins Down Trend + It also made 2 Weekly Hanging Man Candle on 13th April and 20th April which is a Bearish Reversal Pattern.
Assuming the above cases are false, then Case 3: If Nifty still Breaks the Monthly Support and goes below Low of 8909.40 of 21st April, Forming a Lower Low Swing in addition to a Higher Low = It's a confirmation of Daily Down Trend + Price is also below the 75mins 50EMA indicating a 75mins Down Trend.
Assuming the Case 3 is true, then Case 4: Continuing the Daily Down Trend, if Nifty makes a lower low than 7511.10 of 24th March, Then it's a Weekly Down Trend Confirmation as Weekly already made a Lower High of 9390.85 of 20th April compared to 12246.70 of 14th Feb.
If Nifty does Break the 38.20% Monthly Fibonacci Level = 9400, What Next?
The 38.20% Fibonacci Level of 9400 should become support from resistance
Price should take support at Daily Trend Lind and not make a Swing Low Lower than 8909.40 of 21st April, indicating the continuation of Daily Up Trend.
Price may test Weekly Resistance level at 9711
Price may test Daily 50 EMA Resistance
2nd Weekly Resistance at 10130
2nd Weekly Resistance at 10130
Key Level to test 50.00% (9950) to 61.80% (10550) High probability of a pullback ending in this level and retracing back continuing the Downtrends. Stay cautious in these levels.
Search in ideas for "FIBONACCI"
POWERGRID buy based on Fibonacci RetracementStock is showing strong support on 50% zone.
Expecting it to retrace to 220 zone.
stop loss should be immediate lower Fibonacci level

Fibonacci levels plot levels to watch out for around the $300 The $315 and $300 levels of resistance and support respectively have been important on the lower timeframes. Over the past 48 hours, BNB has declined from the local highs at $316.3 to trade at $308.5, at the time of writing.
On the 6-hour chart, the RSI was unable to climb above neutral 50, showing the persistence of the bears. Over the past week, the trading volume was low as well. This came at a time when BNB retested the $300 level.
With Bitcoin facing rejection from beneath the $27.8k resistance on Monday as well, it appeared likely that more losses were in store for the crypto market this week. If Binance Coin were to slip beneath the $295-$300 area, the Fibonacci extension levels highlighted some key areas to watch out for.
The 50% and 61.8% extension levels would likely be tested upon a move beneath $295, with the 23.6% level at $289 also expected to serve as minor support.
Meanwhile, a move above $316.3 would signify a break in the bearish market structure. Thereafter, buyers could begin to exert their will, but this was the less likely scenario.

Fibonacci retracement targetsAfter a high volume breakout VIDHIING targets decided by fibonacci retracement levels

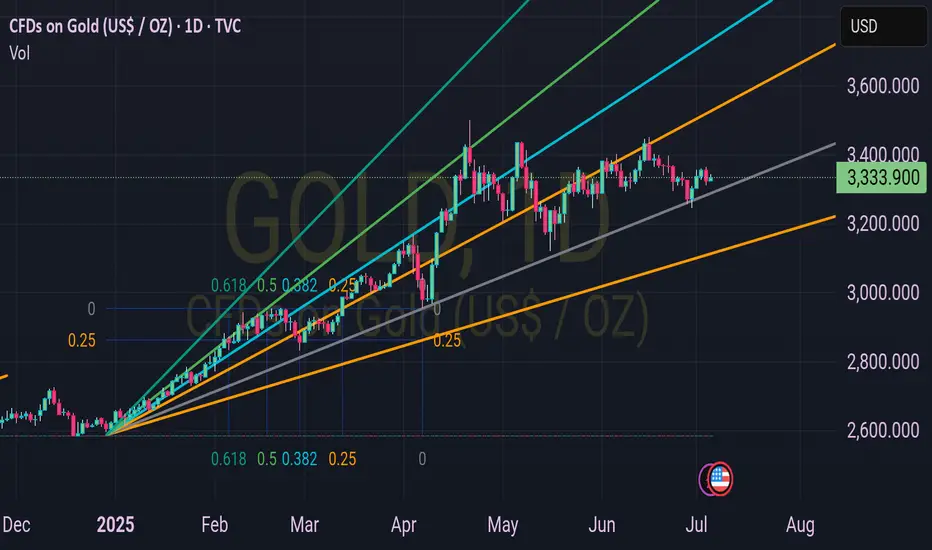
Beauty of Fibonacci Resistance Speed Fan on Gold as a Golden
1. Look at the Beauty of Fibonacci Resistance Speed Fan on Gold as a Golden View
The weekly chart of CFDs on Gold (USD/oz) showcases a stunning Fibonacci resistance fan, guiding price action with precision.
2. Fibonacci Levels as Key Resistance Zones
The fan, drawn from the 2025 low, highlights critical resistance levels: 0.25 at $3,250,000, 0.382 at $3,333,900 (current price), 0.5, 0.618, and beyond, acting as potential ceilings.
3. Current Price Action at $3,333.90
As of July 06, 2025, 01:16 PM +04, gold trades at $3,333.90 (+$8.48 or +0.26%), aligning perfectly with the 0.382 Fibonacci level, indicating a strong resistance test.
4. Upward Momentum Meets Resistance
The price has risen steadily from $2,500 in December 2024, but the Fibonacci fan suggests a potential pause or reversal as it approaches the 0.382 and 0.5 levels.
5. 0.5 Level at $3,500 as a Major Hurdle
The 0.5 Fibonacci resistance at $3,500 looms large, where gold may face significant selling pressure if it breaks through the current $3,333.90 mark.
6. 0.618 Level Signals Next Target
Should gold surpass $3,500, the 0.618 level around $3,750 could be the next psychological and technical barrier, testing bullish strength.
7. Trendline Support Aligns with Fibonacci
The ascending trendline, intersecting near $3,250, complements the Fibonacci fan, offering dynamic support if a pullback occurs from these resistance zones.
8. Recent Price Action Reflects Fibonacci Precision
The recent $8.48 uptick to $3,333.90 demonstrates gold’s adherence to the 0.382 level, reinforcing the fan’s predictive power over the past months.
9. Potential Breakout or Reversal Ahead
Traders should watch for a breakout above $3,333.90 towards $3,500 or a reversal back to $3,250, with the Fibonacci fan providing clear levels to monitor.
10. Strategic Trading with Fibonacci Insights
Use the Fibonacci resistance fan to plan entries and exits, leveraging its alignment with gold’s current $3,333.90 price to anticipate the next move in this golden market.
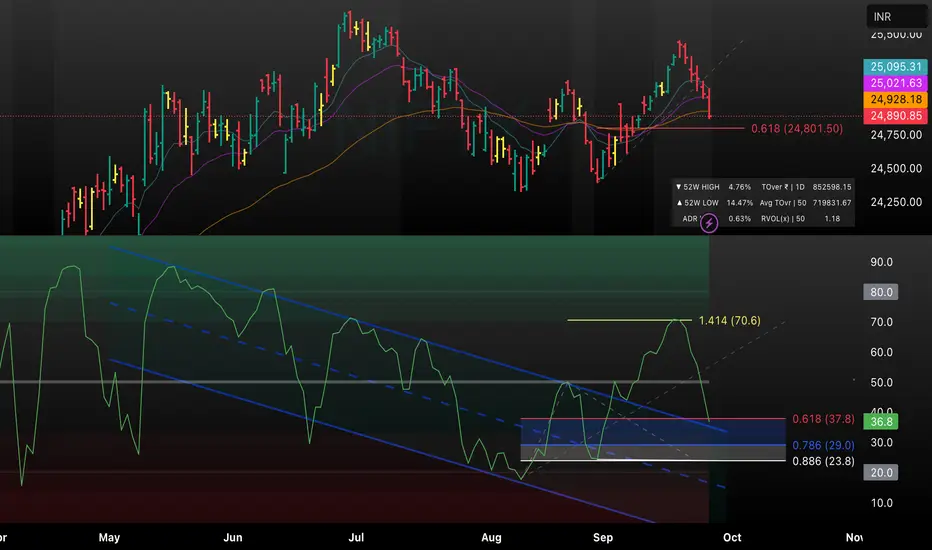
Will Fibonacci Levels Hold? Key Areas to WatchThis chart combines price action with key Fibonacci retracement and extension levels to anticipate potential support or reversal zones. Price is currently testing the crucial 0.618 retracement (24,801.50) after a notable downward move. RSI is also reacting near its own significant levels, aligning with both 0.618 on the downside (37.8) and the 1.414 extension (70.6) on the upside. Watch for reactions at these levels for clues on whether price will bounce or continue to the next fib zone, especially with momentum indicators confirming support/resistance confluence.
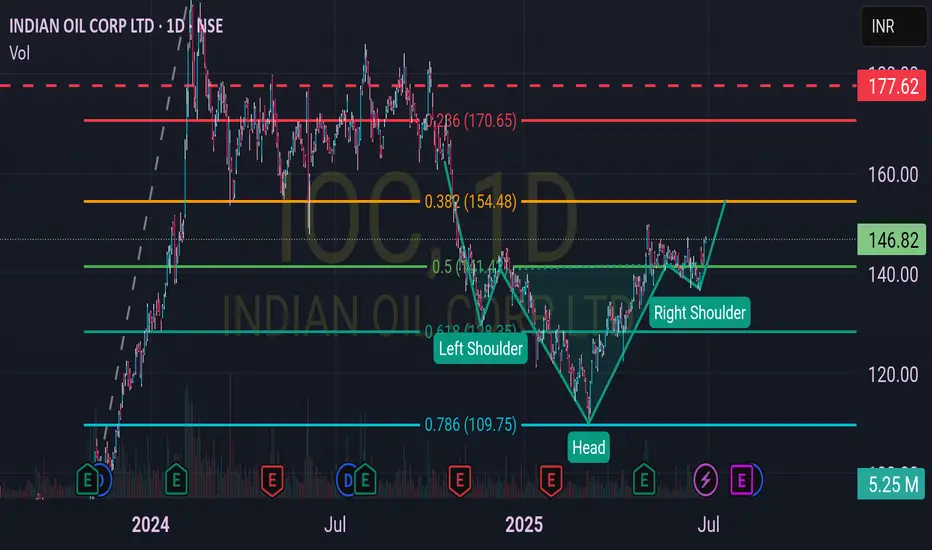
IOC - Fascinated by the Fibonacci!
Unveil the mesmerizing journey of Indian Oil Corp Ltd (IOC) on this captivating chart!
Behold the Fibonacci levels, meticulously drawn two months ago, revealing a fascinating truth.
Witness the price action align flawlessly with these golden ratios, a trader's dream come true.
Marvel at the emerging head and shoulder pattern, hinting at a potential trend reversal.
Anticipate an exhilarating uptrend as the pattern nears completion, sparking excitement.
Strategize with a trailing stop from entry, safeguarding your gains with precision.
Embrace proper risk management to navigate this thrilling market adventure.
The 0.618 level at ₹154.48 and 0.786 at ₹109.75 have held strong, guiding the price.
The current price of ₹146.73 teases a breakout, aligning with the right shoulder.
Prepare for an upward surge, blending Fibonacci magic with pattern perfection!
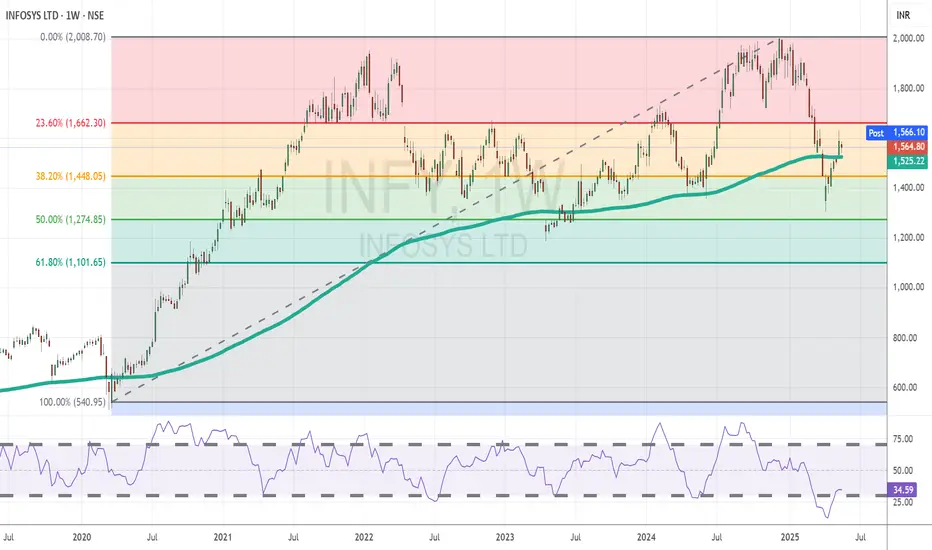
Infy Attempts Breakout After Rebounding from Key Fibonacci SuppoTopic Statement:
Infosys is showing signs of a steady recovery after a deep correction, though key resistance levels still challenge the upward momentum.
Key Points:
The stock found strong support at the 50% Fibonacci retracement during the recent correction, indicating solid buying interest at lower levels.
As the price recovers, the 23.6% Fibonacci level is acting as resistance, slowing the upward move.
Trading just above the 180-day EMA, Infosys remains technically oversold, hinting at continued recovery potential if resistance is breached.
Positional Trading Idea on L&T with Fibonacci LevelNSE:LT
Stock closed above ATH on 28th March 2024. If drawing Fibonacci Extension taken into account of recent High and Low then the 1.618 Fibonacci Extension level comes near 4038 level. Long Position may be initiated at CMP with Trailing SL 3700 for the target near 4038 level.

Reliance Industries Fibonacci Extension ProjectionNSE:RELIANCE
Fibonacci extension resistance at 1.618 level around 3035 level. If RIL closes above 3035 level on weekly basis then next target level at 2.618 Fibonacci extension level around 3686 level.

Aarti Industries - Fibonacci retracement & Tread-line Breakout !Aarti Industries is on a downward trend and is respecting the trendline. We are also seeing a small cup and handle pattern as well where on breakout we can expect a movement till 651. In any case once it breaks the trendline, we can expect the price till 745- 800, with no resistance. Expected price movement 651-745-800. Other parameters:
1. MACD - slowly getting positive
2. RSI - will slowly pick-up once the trend-line break out happens
3. Fibonacci retracement done - moving above from 0.618 levels
"Clean Charts, Easy Charts"
Learning & Earning!!
Cheers!!

IDFCFIRSTBank at BoS and taken Fibonacci Golden Zone as supportReasons for bullish reasons on #IDFCFIRSTBank
1. Break of Structure
2.Taken Support at Fibonacci Golden Zone
3.Volume increase after a contraction


FIBONACCI PROJECTIONS FOR BTCUSD FOR 04-04-2023
The plotted levels are Fibonacci projections for BTCUSD for 4th April 2023. Please review and comment accordingly.

BANKNIFTY INDEX FIBONACCI EXTENSIONS FOR 03-APRIL-2023
The chart is plotted with today's (03-04-2023) trend based Fibonacci extensions. The extensions are plotted for both uptrend and downtrend.

"NATIONALUM" crossing crucial Fibonacci levels.NSE:NATIONALUM has been above 0.50 Fibonacci levels and MACD and STOC RSI also are in the positive note.
TARGET 1 : 84.25
TARGET 2: 86.75
STOP LOSS : 78.55
Disclaimer: The following information is for educational and informational purposes only and should not be construed as financial advice or a recommendation to buy, sell or hold any stock or investment. Technical analysis is a method of evaluating securities by analyzing statistics generated by market activity, such as past prices and volume. However, the future performance of a stock or investment cannot be guaranteed based on technical analysis alone, and other factors, such as economic conditions and company fundamentals, should be considered when making investment decisions. Before making any investment decisions, please consult with a licensed financial advisor and conduct your own research to determine if an investment is suitable for your individual circumstances and risk tolerance. Past performance is not indicative of future results, and investing involves risk, including the possible loss of principal.

NASDAQ at important 0.618 Fibonacci support levelNasdaq is at critical .618 fibonacci support level AND AAPL is ALSO at 0.382 fibonacci support level.
If Nasdaq holds this level for weekly cbsl today 6/Jan/2023 AND AAPL closes above 126 usd expect ATLEAST 500 points bounce.

LT (Larsen & Toubro) bullish with fibonacci resistance crossLT is at a good support zone. It is showing signs of breakout and retesting support. If able to sustain above fibonacci support of 61.8% (1840) on daily time frame, we can 1945 target soon.

Wolfewaves on DXY and coupled up with strong Fibonacci TVC:DXY Wolfewaves on DXY and coupled up with strong Fibonacci . Until DXY curtailed below 109 to 110 region, it could be said that it has made the top, and there needs a correction in the same. With strong supports around 104, where there could be a consolidation drama, then expecting it to fall till 98. This cycle according to my theory should complete by Feb 25th of 2023.

CADILAHC : 50% Fibonacci retracement After posting a fresh 52-weeks low of around 198 during March 13, 2020; CADILAHC has seen spectacular run up and in that optimism stock convincingly crossed its previous 52-weeks high of around 536 (July 14, 2017) and registered a fresh all-time high of around 670 during mid May,21. stock has seen decent profit booking from its all-time high and corrected in past few months. However, the fall got arrested near 521 which coincided with its previous all-time high of (July, 2017) along with the same the daily 200-SMA support placed near 520. If we take Fibonacci retracement of its entire move from the bottom of 406 (March 19, 2021) to the top of 670 (May 14, 2021) then 50% retracement comes near 536. The weekly 50-SMA which was pegged near 500 played a role of sheet anchor and in the previous instance the said MA also played a similar role. The weekly RSI (14) momentum indicator which travelled till 81.67 and during the course of correction it came near 44.31 and signaled “Positive Reversal” which is an indication of reversal.

23-JUL-21 BANKNIFTY FIBONACCI BUYINGReasons to Buy
1. ABC Pattern
2. Fibonacci level @ 0.5-0.6
3. 50 MA Crossover
PROFIT - 1 LOT * 373 = 25*373 = 9325 PERFECT STRATEGY WHEN THE CROSSOVER OCCURS

23-JUL-21 BANKNIFTY FIBONACCI BUYINGReasons to Buy
1. ABC Pattern
2. Fibonacci level @ 0.5-0.6
3. 50 MA Crossover

# trade with fibonacci retracementsaplltd : 807.95
trade setup:
1. buy up to 781
2. keep stop loss as 740 on closing basis
3. targets 856/915/1001/1128+
technical buy based on :
1, fibonacci (.786/.886)
2. support / demand zone
3. trendline
4. triangle
5. value
