ONGC HITS FIRST FIBONACCI LEVELONGC
ONGC has hit the first fibonacci level and is expected to retrace from the point since a bearish candle has formed.
Search in ideas for "FIBONACCI"

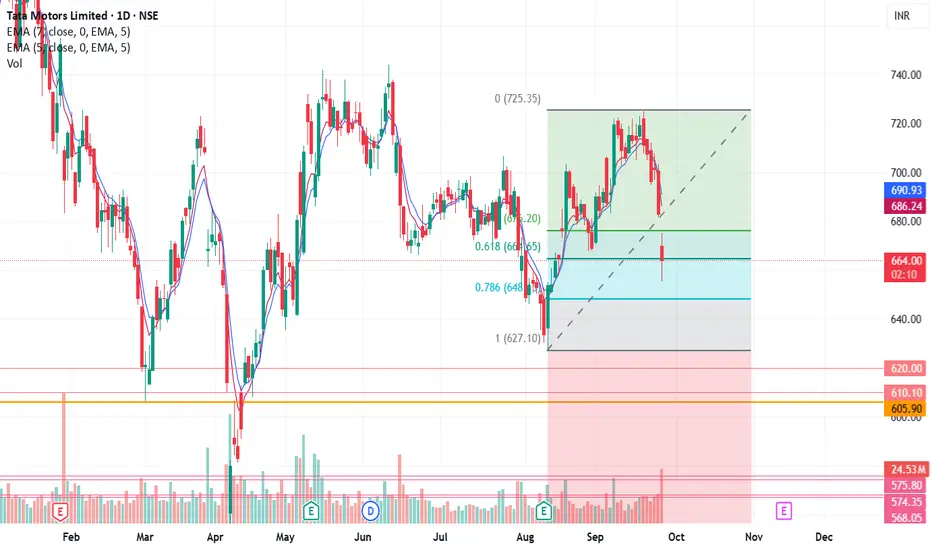
On Golden level of Fibonacci RetracementWith recent bullish momentum in the Auto industry, this looks like a good time to catch Tatamotors as it is on the Fibonacci Retracement golden level. I am bullish on this. Pinbar candle on the bottom on a daily basis gives me more confidence.
Multi-Confirmation Price Action: Fibonacci Zones, Base BreakoutsExplore multi-confirmation techniques using Fibonacci retracement to identify high-probability base breakout zones. Learn how to spot double bottom and inverted head & shoulders patterns at demand levels and execute confirmation trades for precision entries

OLA Perfect Reversal fibonacciNow this is thepower of the fibonacci Level in the market, How this is perfectly work

Morepen Lab - Bullish Flag and Fibonacci RetracementMorepen Lab has formed a bullish flag pattern, and today it has successfully broken out.
The price has retested the Fibonacci level at 38, where it formed a bullish piercing pattern, signaling potential upside momentum.
Price take support of 50 period EMA.
Additionally, this level coincides with a significant demand zone on the chart, suggesting strong buying interest. Keep an eye on this stock for further upward movement

BTC Target Reached, 0.5 Fibonacci Retracement after TL BreakoutBitcoin reached the 0.5 Fibonacci Retracement level after a Trendline Breakout. I shared this analysis on September 30th.

JK CEMENT Fibonacci Retracement Levels!JK Cement ~ 3095 Level Act As Hidden Resistance Near ~ 78% Fibonacci Retracement, Sell With Stop ~ 3140, Target ~ 2900, Dec Expiry.

fibonacci retracement levelcan retrace upto level of 0.618 which is 381 then it will move up, can buy now or we can buy after retracement

BANK NIFTY - FIBONACCI RETRACEMENTBanknifty has made a reversal candle exactly at the .618 fibonacci retracement levels as you see in this chart, if tomorrow the price breaks today's low then it may further come to 37100 levels..
caution: Be in SELL ON RISE MINDSET, careful in taking long position until the price breach the todays high.

Bank Nifty 1 Hr Chart with Fibonacci Retracement Target 38200Bank Nifty 1 Hr Chart with Fibonacci Retracement towards Target of 38200
Option/ Future buyers- Buy only December Month expiry
Also with a view of Monthly and weekly expiry.. Volatility will be there to eat premiums are on both Side.
Dont trade option with November Month Expiry. Still if you want to trade , go only with 1 lot of 38000 with very stick stop loss as per your Risk management.

Nifty 2 hour chart with Fibonacci Retracement towards 18300Nifty 2 hour Chart with Fibonacci Retracement for better Trading opportunity .
Any Rise above the Retracement of 50 %. Chances of reaching 18300 is EVIDENT

Bounce from Fibonacci levels CRISIL taking support near 61% fibonacci levels and bouncing back. Expect a decent rally in the same.
Positional Buy :
Company : CRISIL
Entry Price : 2770
Stoploss : 2536.8
Target 1 : 3100
Target 2 : 3241.

A short view of BTC via Fibonacci retracementsA short view of fibonacci retracements for 2-3% upside on a 7-10 day time period.

A short view of BTC via Fibonacci retracementsThis is just a short term outlook looking at previous trend patterns of BTC buy-sell cycles on a period of 3 months. A basic extrapolation of fibonacci levels can indicate short term long strategies of 2-3% upside over a period of 7-10 days. Let me know what you think.


HAL Following Fibonacci RetracementsOnly some charts follow Fibonacci Retracement levels this beautifully. Keep a watch on this as Retracement Levels will act as good Support and Resistance levels in the future as well.

support at Fibonacci level, buy for 10-15% returnsHas taken a support at Fibonacci retracement and is closed above the important level.


Small cap Index take support at Fibonacci level and forms DojiSmall cap take support at Fibonacci level and forms Doji..
Can Small Cap bounce back from this level?
Previous time (2008 year) when small cap made correction it took 15 bars.
this time also will it take same?

Nifty retraces from 50% fibonacci levelNifty formed a bearish candle from 50% fibonacci level. A short pullback can be expected. Also, the stochastic indicator showed a bearish divergence further showing the possibility of a pullback.
Entry: 520
Target: 500/495
Stoploss: 530

Varun Beverages (VBL) Approaching Key Fibonacci Resistance |Varun Beverages Ltd. (NSE: VBL) is exhibiting a strong upward move after rebounding from the major support zone near ₹450 (0.786 Fibonacci level). The price has surged past crucial levels and is headed towards a key resistance zone between ₹539 (0.618 Fibonacci retracement) and ₹564 (0.786 Fibonacci retracement) after a sustained period of consolidation.
Key Observations:
• Significant support was respected in the ₹449–₹475 range, leading to a breakout.
• The next resistance zone lies at the ₹539–₹564 range (highlighted by the Fibonacci retracement levels).
• If the momentum sustains and bulls take control, a move towards ₹595 and ₹615 (Fibonacci extension target) is possible.
• Major volumes have accompanied this move, indicating strong buying interest.
• Traders should watch for price action and potential reversal signs

Banknifty Fibonacci Time zones Analysis📊 Fibonacci Time Zones: A Gateway to Market Timing 🕰️
The Fibonacci Time Zone Tool is a unique and powerful feature in TradingView, based on the mathematical sequence introduced by Leonardo Fibonacci, a 13th-century Italian mathematician. Widely used in financial markets, this tool helps traders identify potential time-based turning points.
🔑 How It Works:
By plotting three key points—two highs and one low (or vice versa)—this tool extends Fibonacci ratios (0, 0.618, 1, 1.618, etc.) as vertical lines on the chart. These lines represent potential time cycles where significant market events or reversals could occur.
✨ Historical Context:
The Fibonacci sequence gained prominence in trading thanks to Ralph Nelson Elliott, who incorporated it into his Elliott Wave Theory. His work highlighted the importance of natural cycles and ratios in financial markets.
📖 Recommended Reading: "Elliott Wave Principle: Key to Market Behavior" by Frost and Prechter explores this concept in depth.
📈 This Week's Market Observation:
Plotted on the Fib Time Zone Tool using:
March 2020 Low
October 2021 High
June 2022 Low
This week marks the 1.618 Fibonacci Extension—the Golden Ratio, often associated with significant turning points.
🚦 Key Levels to Watch:
1️⃣ Above 49,798 (the high from 2 days ago): Signals a potential reversal to the upside.
2️⃣ Invalidation Level: Low of January 10, 2025.
Doesn't this look like a GUN :D
⚡ Why This Matters:
The confluence of Fibonacci time zones and price levels could indicate a pivotal moment for the index. Stay alert for a breakout or reversal as the market reacts to this significant golden ratio!
🌐 Pro Tip: Combine the Fib Time Zone tool with other indicators like volume and candlestick patterns to confirm market behavior around these time zones.
📥 Share your thoughts or let us know if you’re using this tool in your analysis!

Comprehensive Exploration of Fibonacci RetracementUnderstanding the Fibonacci Retracement Tool:
Mathematical Roots: The Fibonacci retracement tool finds its origins in the intriguing Fibonacci sequence—a mathematical concept where each number is the sum of the two preceding ones (e.g., 0, 1, 1, 2, 3, 5, 8, 13, and so forth). This sequence forms the groundwork for a technical analysis tool that seeks to unveil potential support and resistance levels in financial markets.
Application in Technical Analysis: Traders and analysts harness the power of Fibonacci retracement to decipher probable levels where price movements might stall, reverse, or undergo significant shifts. The tool is a crucial component of the trader's arsenal, offering insights into market sentiment and potential turning points.
Deconstructing Fibonacci Retracement Levels:
Connecting Pivotal Points: The process of employing Fibonacci retracement involves connecting two critical points on a price chart—the high and low of a recent price swing. This connection gives birth to horizontal lines, each corresponding to a specific percentage level. Key retracement levels include 23.6%, 38.2%, 50%, 61.8%, and 78.6%.
Degrees of Retracement: Each retracement level serves as a numerical representation of the extent to which the price retraces a prior move. Traders often observe these levels as potential zones of interest, although it's crucial to note that they do not guarantee support or resistance but rather signify areas worthy of attention.
Significance Amplified: The Self-Fulfilling Prophecy:
Market Psychology at Play: One of the fascinating aspects of Fibonacci retracement is its role as a self-fulfilling prophecy. The efficacy of these retracement levels is often heightened by the collective belief and actions of market participants who use and trust in the tool. As a result, Fibonacci retracement becomes a dynamic force influencing market behavior.
Strategic Applications of Fibonacci Retracement:
Price Reversal Zones: Fibonacci retracement strategically identifies zones where price reversals may occur. For instance, in the context of an uptrend, a retracement to the 61.8% Fibonacci level might signal a potential entry point for traders anticipating a resumption of the upward trajectory.
Entry/Exit Confirmation: Traders frequently intertwine Fibonacci retracement with other technical indicators to confirm entry or exit points. This multi-faceted approach provides a more robust foundation for decision-making.
Trend Strength Assessment: Beyond predicting reversals, Fibonacci retracement aids in assessing the strength of a prevailing trend. Shallow retracements (23.6% or 38.2%) may indicate a resilient trend, while deeper retracements (61.8% or 78.6%) could signify a weakening trend or the possibility of a trend reversal.
In Conclusion: Unlocking Potential with Fibonacci Retracement:
Versatile Decision-Making Tool: The Fibonacci retracement tool stands as a versatile instrument in the trader's toolkit, offering not just numerical levels but a nuanced understanding of market sentiment and potential trend shifts. Its application extends beyond mere prediction, providing traders with actionable insights for more informed decision-making in the dynamic world of financial markets.
