AUDUSD - 15M PROJECTIONDISCLAIMER: The Company accepts no accountability or obligation for your trading and speculation results, and you consent to hold the Company innocuous for any such outcomes or misfortunes. We are not financial advisers or account managers; We are Forex traders. The recordings on this channel are rigorously for educational and amusement purposes. Trading Forex implies dangers, and you can lose all your venture ; consequently, you exclusively must take a chance.
Search in ideas for "FOREX"

GER30 - 15M BUYDISCLAIMER: The Company accepts no accountability or obligation for your trading and speculation results, and you consent to hold the Company innocuous for any such outcomes or misfortunes. We are not financial advisers or account managers; We are Forex traders. The recordings on this channel are rigorously for educational and amusement purposes. Trading Forex implies dangers, and you can lose all your venture ; consequently, you exclusively must take a chance.
DLong

GOLD 1H SELLDISCLAIMER: The Company accepts no accountability or obligation for your trading and speculation results, and you consent to hold the Company innocuous for any such outcomes or misfortunes. We are not financial advisers or account managers; We are Forex traders. The recordings on this channel are rigorously for educational and amusement purposes. Trading Forex implies dangers, and you can lose all your venture ; consequently, you exclusively must take a chance.

USDCHF 1H PROJECTIONDISCLAIMER: The Company accepts no accountability or obligation for your trading and speculation results, and you consent to hold the Company innocuous for any such outcomes or misfortunes. We are not financial advisers or account managers; We are Forex traders. The recordings on this channel are rigorously for educational and amusement purposes. Trading Forex implies dangers, and you can lose all your venture ; consequently, you exclusively must take a chance.

USDCAD - 1H PROJECTIONDISCLAIMER: The Company accepts no accountability or obligation for your trading and speculation results, and you consent to hold the Company innocuous for any such outcomes or misfortunes. We are not financial advisers or account managers; We are Forex traders. The recordings on this channel are rigorously for educational and amusement purposes. Trading Forex implies dangers, and you can lose all your venture ; consequently, you exclusively must take a chance.

CHFJPY Risky Trade buy limiteBuy Limit - 139.000
SL - 138.900
DISCLAIMER: The Company accepts no accountability or obligation for your trading and speculation results, and you consent to hold the Company innocuous for any such outcomes or misfortunes. We are not financial advisers or account managers; We are Forex traders. The recordings on this channel are rigorously for educational and amusement purposes. Trading Forex implies dangers, and you can lose all your venture ; consequently, you exclusively must take a chance.

USDCADDISCLAIMER: The Company accepts no accountability or obligation for your trading and speculation results, and you consent to hold the Company innocuous for any such outcomes or misfortunes. We are not financial advisers or account managers; We are Forex traders. The recordings on this channel are rigorously for educational and amusement purposes. Trading Forex implies dangers, and you can lose all your venture ; consequently, you exclusively must take a chance.

EURGBP 30M PROJECTIONDISCLAIMER: The Company accepts no accountability or obligation for your trading and speculation results, and you consent to hold the Company innocuous for any such outcomes or misfortunes. We are not financial advisers or account managers; We are Forex traders. The recordings on this channel are rigorously for educational and amusement purposes. Trading Forex implies dangers, and you can lose all your venture ; consequently, you exclusively must take a chance.

AUD-USD Forex pair swing trade for 12/6/2020 Note : For learning , refer to the chart for the entry and exit
Like share and subscribe , share your ideas .

Don't miss the great sell opportunity in GBPUSDShort-Term Forecast:
Trading suggestion:
". There is still a possibility of temporary retracement to suggested resistance line (1.3033).
if so, traders can set orders based on Price Action and expect to reach short-term targets."
Technical analysis:
. GBPUSD is in a downtrend and the continuation of downtrend is expected.
. The price is below the 21-Day WEMA which acts as a dynamic resistance.
. The RSI is at 25.
Take Profits:
TP1= @ 1.2802
TP2= @ 1.2733
TP3= @ 1.2609
TP4= @ 1.2525
TP5= @ 1.2259
SL: Break Above R2
❤️ If you find this helpful and want more FREE forecasts in TradingView
. . . . . Please show your support back,
. . . . . . . . Hit the 👍 LIKE button,
. . . . . . . . . . . Drop some feedback below in the comment!
❤️ Your Support is very much 🙏 appreciated! ❤️
💎 Want us to help you become a better Forex trader ?
Now, It's your turn !
Be sure to leave a comment let us know how do you see this opportunity and forecast.
Trade well, ❤️
ForecastCity English Support Team ❤️

Don't miss the great buy opportunity in USDSGDMidterm forecast:
. While the price is above the support 1.3430, beginning of uptrend is expected.
. We make sure when the resistance at 1.3754 breaks.
. If the support at 1.3430 is broken, the short-term forecast -beginning of uptrend- will be invalid.
Technical analysis:
. The RSI downtrend #1 is broken, so the probability of beginning of uptrend is increased.
. A peak is formed in daily chart at 1.3985 on 06/22/2020, so more losses to support(s) 1.3550 and minimum to Major Support (1.3430) is expected.
. Price is below WEMA21, if price rises more, this line can act as dynamic resistance against more gains.
. Relative strength index (RSI) is 42.
Take Profits:
TP1= @1.3754
TP2= @1.3885
TP3= @1.4035
TP4= @1.4270
TP5= @1.4635
TP6 Free
❤️ If you find this helpful and want more FREE forecasts in TradingView
. . . . . Please show your support back,
. . . . . . . . Hit the 👍 LIKE button,
. . . . . . . . . . Drop some feedback below in the comment!
❤️ Your Support is very much 🙏 appreciated! ❤️
💎 Want us to help you become a better Forex trader ?
Now, It's your turn !
Be sure to leave a comment let us know how do you see this opportunity and forecast.
Trade well, ❤️
ForecastCity English Support Team ❤️

GBPUSD showing breakout in coming daysFOREXCOM:GBPUSD
In 4 hours map pair showing sideways market and narrowing its the chart that shows breakout towards up or down.
and lots of important news coming on the way so we will observe the next move and trade
Today GBP have lots of news so trade wise.
Check More details traderand.co

EURUSD - 4H - SHORTFOREXCOM:EURUSD
Hello traders , here is the full multi time frame analysis for this pair, let me know in the comment section below if you have any questions, the entry will be taken only if all rules of the strategies will be satisfied. wait for more Smart Money to develop before taking any position . I suggest you keep this pair on your watchlist and see if the rules of your strategy are satisfied...
Keep trading
Hustle hard
Markets can be Unpredictable, research before trading.
Disclaimer: This trade idea is based on Smart money concept and is for informational purposes only. Trading involves risks; seek professional advice before making any financial decisions. Informational only!!!

AUDUSD 15M IDEAFOREXCOM:AUDUSD
Hello traders , here is the full multi time frame analysis for this pair, let me know in the comment section below if you have any questions, the entry will be taken only if all rules of the strategies will be satisfied. wait for more Smart Money to develop before taking any position . I suggest you keep this pair on your watchlist and see if the rules of your strategy are satisfied...
Keep trading
Hustle hard
Markets can be Unpredictable, research before trading.
Disclaimer: This trade idea is based on Smart money concept and is for informational purposes only. Trading involves risks; seek professional advice before making any financial decisions. Informational only!!!

USD/JPY SD + OTE + PD Array AnalysisStandard Deviation Entry Model on FOREXCOM:USDJPY
1. Inducement on 15min TF
2. Targets + Mini reversal zones marked out
3. 1H PD Array (FVG) Equilibrium tapped
4. Entry Triggered
5. 1st Target HIT
6. Waiting for Standard Deviation ultimate target to hit
I'll like to know more your thoughts on this!
Share your analysis as well!

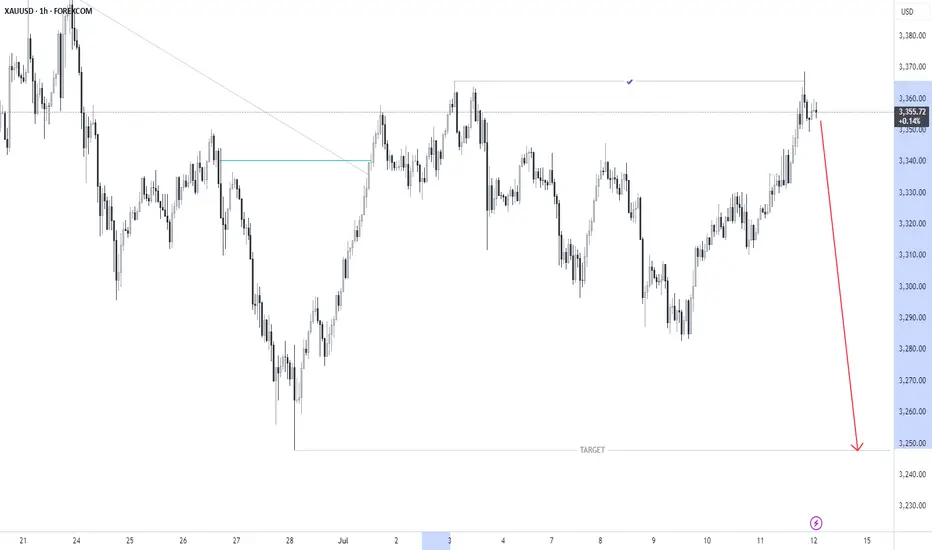
XAUUSD - 1H SHORT (GOLD)FOREXCOM:XAUUSD
Hello traders , here is the full multi time frame analysis for this pair, let me know in the comment section below if you have any questions, the entry will be taken only if all rules of the strategies will be satisfied. wait for more Smart Money to develop before taking any position . I suggest you keep this pair on your watchlist and see if the rules of your strategy are satisfied...
Keep trading
Hustle hard
Markets can be Unpredictable, research before trading.
Disclaimer: This trade idea is based on Smart money concept and is for informational purposes only. Trading involves risks; seek professional advice before making any financial decisions. Informational only!!!
EURUSD SHORT - 15M/1HFOREXCOM:EURUSD
Hello traders , here is the full multi time frame analysis for this pair, let me know in the comment section below if you have any questions, the entry will be taken only if all rules of the strategies will be satisfied. wait for more Smart Money to develop before taking any position . I suggest you keep this pair on your watchlist and see if the rules of your strategy are satisfied...
Keep trading
Hustle hard
Markets can be Unpredictable, research before trading.
Disclaimer: This trade idea is based on Smart money concept and is for informational purposes only. Trading involves risks; seek professional advice before making any financial decisions. Informational only!! !

GBPUSD - 15M OUTLOOKFOREXCOM:GBPUSD
Hello traders , here is the full multi time frame analysis for this pair, let me know in the comment section below if you have any questions, the entry will be taken only if all rules of the strategies will be satisfied. wait for more Smart Money to develop before taking any position . I suggest you keep this pair on your watchlist and see if the rules of your strategy are satisfied...
Keep trading
Hustle hard
Markets can be Unpredictable, research before trading.
Disclaimer: This trade idea is based on Smart money concept and is for informational purposes only. Trading involves risks; seek professional advice before making any financial decisions. Informational only!!!

Gold hits important support. Is the downtrend over?
📊 Trump's "reciprocal tariffs" policy is affecting the entire financial market in general and gold prices in particular. The trade war is approaching and the market continued to fall sharply on Monday. Not staying out of the game, OANDA:XAUUSD is also inevitable to sell off when market volatility increases. Let's analyze the next developments of gold from the perspective of **Technical Analysis:** and the opportunity to find profits at this time:
🔹 **Frame D**: After 3 consecutive days of decline, FOREXCOM:XAUUSD prices have temporarily maintained the upward price trend. And currently the price is at an important support area, the old peak area 1 month ago. Whether the correction ends here or not, we will need to consider further in the next time frames
🔹 **H4 frame**: The important key zone has been broken, the bearish price structure has not changed, it is not yet possible to confirm that this downtrend has ended.
🔹 **H1 frame**: The bearish price structure is very clear, however, the selling force is not as strong as before. The support area still brings a cautious mentality to the bears, plus the profit-taking action for SELL positions after the past 3 days.
✅**Trading plan:*
Looking at the price structure, although the price is at an important support area, we are still not sure that this downtrend has ended, so the BUY option will not be considered. However, the current area is no longer suitable for setting up a SELL position. The priority at the moment is to wait for the price to return to the marked resistance area to TRADE WITH THE MEDIUM TERM TREND. The market volatility is very high at the moment so pay attention to reduce the corresponding Volume and Stoploss with the loss you can accept.
💪 **Wishing you success in achieving profits!**

XAU#25: Is the correction over? What's next?Prices OANDA:XAUUSD stabilized around $3,022/ounce after a slight decline two days ago, reflecting strong safe-haven demand due to economic and geopolitical uncertainty. So is this correction over? Let's look at the next plan FOREXCOM:XAUUSD :
1️⃣ **Fundamental analysis:**
📊 Risks of economic recession and war conflict still exist:
🔹The Trump administration's reciprocal tariff policy may be more moderate than expected, reducing concerns about trade conflicts, but Wall Street is still betting on a 50% chance of a US recession due to slow currency circulation. This is one of the factors supporting Gold's rise
🔹 Risks from the Middle East and Ukraine are still unknown. Negotiations are still reaching certain agreements, but the impact on market confidence is insignificant. The fear psychology is still pushing money into Gold as a safe haven asset.
2️⃣ **Technical analysis:**
🔹 **D Frame**: The uptrend remains unchanged. Closing the session last Friday with a bearish candle is considered a profit-taking move after a series of days of gold price increase.
🔹 **H4 Frame**: The 3000 area is playing an effective support role when the price bounces back. However, the correction wave has not shown any signs of ending.
🔹 **H1 Frame**: The bearish price structure is very clear. If the 301x area is still held, the price may seek the resistance zones above to confirm the price reaction.
3️⃣ **Trading plan:*
✅ From the basic information to the reflected horizontal line, it can be seen that at the present time, the price can still continue to decrease. However, there are certain risks when FOMO establishes a SELL position in the current area. The price may not drop deeply to the lower area immediately but will sweep SL at both ends. We can wait for the price reaction in the upper resistance area to find a safer position.
💪 **Wishing you success in achieving profits!**

XAU#24: Gold hits $3,000. Will there be a correction?💎 💎 💎 So OANDA:XAUUSD has successfully achieved the $3,000 mark thanks to tariffs and economic growth concerns. Let's continue to plan for gold FOREXCOM:XAUUSD : 💎 💎 💎
1️⃣ **Fundamental analysis:**
📊 The trade war due to tariffs as well as expectations of slowing inflation and concerns about economic growth will push the Federal Reserve to cut interest rates this year are the main drivers of gold's safe-haven demand.
2️⃣ **Technical analysis:**
🔹 **D Frame**: Gold broke through the resistance area of 2955 strongly and reached the 3000 mark the next day. The uptrend is very clear. Although the weekend closed with a pinbar, this is likely to be short-term profit-taking pressure as the market enters the weekend trading day and comes from the 3000 round mark
🔹 **H4+H1 frame**: the price returns to a strong uptrend after accumulating the 2900~292x area. The price reaction at the psychological level of 3000 is weak when the price does not have a clear corrective reaction.
3️⃣ **Trading plan:*
✅ There is still no clear sign of adjustment. Gold prices will continue to increase if trade tensions escalate from tariff retaliation orders. Although touching the psychological resistance of 3000, the price reaction is insignificant, showing that market sentiment is still optimistic about the prospect of gold's increase. The top priority is not to FOMO according to the price line. We can wait for the price to return to the support area to look for trading opportunities.
💪 **Wishing you success in achieving profits!**

XAU#23: Gold Continues SW – Waiting for a Boost from CPI News?🔥 Immediately after the decline FOREXCOM:XAUUSD , there was a recovery with a large amplitude. Looking at the price reaction, we will plan the next step OANDA:XAUUSD : 🔥
1️⃣ **Fundamental analysis:**
📊Gold rises on tariff concerns, but is under pressure from the Ukraine-Russia ceasefire agreement
🔹Gold prices rise on a weaker USD and increased demand for safe-haven, as concerns about a US economic recession become more evident.
🚀The US market faces risks from Trump's tax policy, Fed interest rates and slowing growth of large technology companies. Weak CPI & PPI data could prompt the Fed to ease policy, creating conditions for gold prices to continue to be supported.
📌 In recent days, trade wars and geopolitics have continuously coordinated the price of gold. Continuous declarations of tax imposition, response and withdrawal have caused the price to fluctuate strongly.
2️⃣ **Technical analysis:**
🔹 **Frame D**: The bullish price structure has not changed. Yesterday's price increase brought momentum to the prospect of gold's increase. However, to break out of the SW zone, we will need strong enough momentum from both news and price structure.
🔹 **Frame H4**: The downtrend has been confirmed when the price reacted strongly in the resistance zone. The price continues to be in the old SW zone. We will have to wait for confirmation from the price structure in this area to predict the trend and wait for the opportunity to establish a position.
🔹 **Frame H1**: The bearish price structure has been established and yesterday was a recovery to the resistance zone. It is too early to say that the price will break through the SW area.
3️⃣ **Trading plan:*
⛔ At the current price range, the price line is likely to SW waiting for today's CPI news. If we have not established a position, we should not FOMO at this time. Because the information given at this time can change at any time and the price line has not been clearly confirmed.
✅ An ideal scenario when the price has a correction to retest the H4 trendline. The upward momentum will be clearer when the price bounces from support. However, yesterday's price increase has not ended yet, so we should wait for the price structure to appear more clearly to place an order.
💪 **Wishing you successful trading!**

XAU#22: Gold SW for 3 Days! What's Next?🔥 OANDA:XAUUSD has been SW for the past 3 days of the weekend. Today we will look at the next scenario for FOREXCOM:XAUUSD to look for trading opportunities: 🔥
1️⃣ **Fundamental analysis:**
📊Trump's erratic tariff policy increases uncertainty, boosting demand for safe havens.
🔹USD falls sharply to a 4-month low, making gold more attractive to international investors.
🚀India steps up investment in gold, with jewelers and retail investors using gold options for speculation and hedging.
📌Gold remains a safe haven asset, especially amid concerns about India's economic growth and global instability.
2️⃣ **Technical analysis:**
🔹 **D frame**: 3 consecutive SW days, however, it can be seen that the upward trend of gold has not changed. The SW price zone is also quite high compared to the most recent bottom, indicating an upward prospect for gold
🔹 **H4 frame**: The temporary bullish price structure was broken and there was a strong reaction at the most recent peak area with a previous pinbar.
🔹 **H1 frame**: In the H1 frame, we can see the hesitation more clearly. Although the previous price continuously set higher bottoms, the upward momentum is weakening. If the price breaks through 2905. There is a high possibility that we will see a correction to the lower support zone
3️⃣ **Trading plan:*
⛔The current area is no longer safe to establish a BUY position. We will wait for a clearer opportunity in the lower support zone
✅ The current priority is to look for a SELL position. The expected scenario is that if the price breaks through 2905, we can completely establish a position.
💪 **Wishing you successful trading!**
