GOLD 30M ProjectonDISCLAIMER: The Company accepts no accountability or obligation for your trading and speculation results, and you consent to hold the Company innocuous for any such outcomes or misfortunes. We are not financial advisers or account managers; We are Forex traders. The recordings on this channel are rigorously for educational and amusement purposes. Trading Forex implies dangers, and you can lose all your venture ; consequently, you exclusively must take a chance.
Search in ideas for "FOREX"

USDCAD Sell LimitDISCLAIMER: The Company accepts no accountability or obligation for your trading and speculation results, and you consent to hold the Company innocuous for any such outcomes or misfortunes. We are not financial advisers or account managers; We are Forex traders. The recordings on this channel are rigorously for educational and amusement purposes. Trading Forex implies dangers, and you can lose all your venture ; consequently, you exclusively must take a chance.

USDCHFDISCLAIMER: The Company accepts no accountability or obligation for your trading and speculation results, and you consent to hold the Company innocuous for any such outcomes or misfortunes. We are not financial advisers or account managers; We are Forex traders. The recordings on this channel are rigorously for educational and amusement purposes. Trading Forex implies dangers, and you can lose all your venture ; consequently, you exclusively must take a chance.

EURUSDDISCLAIMER: The Company accepts no accountability or obligation for your trading and speculation results, and you consent to hold the Company innocuous for any such outcomes or misfortunes. We are not financial advisers or account managers; We are Forex traders. The recordings on this channel are rigorously for educational and amusement purposes. Trading Forex implies dangers, and you can lose all your venture ; consequently, you exclusively must take a chance.

EURNZD SellDISCLAIMER: The Company accepts no accountability or obligation for your trading and speculation results, and you consent to hold the Company innocuous for any such outcomes or misfortunes. We are not financial advisers or account managers; We are Forex traders. The recordings on this channel are rigorously for educational and amusement purposes. Trading Forex implies dangers, and you can lose all your venture ; consequently, you exclusively must take a chance.

GBPUSD Sell OrderDISCLAIMER: The Company accepts no accountability or obligation for your trading and speculation results, and you consent to hold the Company innocuous for any such outcomes or misfortunes. We are not financial advisers or account managers; We are Forex traders. The recordings on this channel are rigorously for educational and amusement purposes. Trading Forex implies dangers, and you can lose all your venture ; consequently, you exclusively must take a chance.

Classic Double Top!Let's Start by admitting the fact that price action works like crisp in FOREX.
A beautiful breakout at $1.36459 made GBPUSD hit $1.37437 - $1.37493 Levels. Which happened to be a small time resistance level.
(During October 2021)
Price then reacted to the resistance and set up its camp down at $1.37007 Levels.
Selling pressure was still intact when it tried crossing $1.37437 - $1.37493 Levels again - 1st Indication for a possible Double top.
I.e, $1.37007 Levels Could possibly be the Neck Line.
Hah! That's what happened!
Price Almost respected our resistance level, and started its jouney downwards. - 2nd Indication for a Double Top.
EMA 9 Going below EMA 21 + RSI breaking its 47 levels Made themselves in the play for going short.
Candle at 7:30 with its good selling pressure and closing below the neckline confirmed the death of $1.37007 levels - THE FINAL INDICATION.
And the trade went on it's journey downwards as predicted.

Trading Signal For GBPNZD Forex Trading Signal:
There is a Trading Signal to Sell in GBPNZD Currency Pair.
Traders can open their Sell Trades NOW
Rank : ⭐️
⬇️Sell now or Sell on 1.9588
⭕️SL: Close above 1.9660
🔵TP1 @ 1.933
🔵TP2 @ 1.917
🔵TP3 @ 1.894
If you liked our ideas, please support us with your likes 👍 and comments.

Dollar Index Cast ForwardExpecting Bullish weeks and reversal after New interest rates are out:
With Dollar index moving higher, expect it to rise until the next FED meeting on 22nd September 2021. Technically, Price will look to sweep liquidity built during the past few bearish months! Remember Trends in this timeframe (monthly) last for a long time. Once the key level of 97.750 is broken, expect a bullish period for dollar.
Track interest rates: Investing . com
To watch seasonal tendency charts : equityclock . com
Note: The above is just for educational purposes. Forex market is subjective in nature. Trading is subjective to financial risks, please do your own analysis and manage your risk properly!

EUR USD Head&Shoulders BreakdownThe Forex major has finally broke down the textbook h&s shoulder and also broke and retested 200 EMA. Also took rejection on Fib level of 38.20. Further fall can be seen in EURUSD. Nearest support can be seen at 1.16100 which is also a Fib level of 61.80.

Live Challenging Market Analysis Buy USDCAD @ 1.25725Live Challenging Market Analysis Buy USDCAD @ 1.25725
Target @ 1.37131
Entry 2 @ 1.24000
Target Buy 1 & 2 @ 1.37131
Our Unique Features:
—————————————————————
1. Follow our 15 signals ….10% equity will increase in your account for sure.
2. We are not Trailing stop! or average the trades.
3. 2% Risk Management Per trade.
4. Risk vs Reward up to 1:7.
Note:
Trade signals would usually have a risk to reward ratio of 1:2.
It means that even 2 out of 4 signals hits their SL marks, the other two would have closed with profit.
This allows you to be good in overall pips profit.
Signals are usually inter-day (Based on the daily candle) therefore, trades would usually have a holding time of an average minimum of 24 hours.
Note: Everything works with Best money management.
Note: Please leave comments for any query.
Disclaimer: This is my trading experience, it is not an invite or recommendation to trade.
Best Wishes
Forex Tamil


JPYINR Currency Trend Analysis & Trade Setup !!TREND ANALYSIS & TRADE SETUP
Follow Chart Instruction.
Do not be Hurry for entry.
Wait for Proper Entry Setup.
Buy/Sell with Best Risk Reward.
Educational Chart Only.
You can Comment and ask the TREND ANALYSIS of any STOCK/SCRIPT/INDEX/FOREX.
Wait for entry setup, if available then Long/short.
R:R is 8 to 12 times.

EURUSD Following Down Channel Pattern - Forex Technical AnalysisWe are doing EURUSD Analysis in Daily Time frame
as you can see right now market is Holding Down channel line Support area. if we take entry from here then our risk to reward was perfect that is 1:3
If our target hitted then we will be in 120 pips profit
Target : 1.13584
Stop area : 1.11660
Note: This is only for Educational Purpose this is not an Investment advice.
Please support the setup with your likes, comments and by following on Trading View.
Thanks
Adil Khan

NZDUSD SHORT-MID termWelcome to my !NZDUSD analysis. NZD is giving us some good trades this month and i believe it will continue for the coming week.
i believe we are completing the 4th wave /B wave of 1-2-3-4-5 / ABC correction.
We have formed a contracting triangle with abcde waves and the price should breakout of the triangle upwards
Wave E seems to be done however POINT 1 ( anchored note ) : this could be just an ( a) of E, but since the price is very close to C wave we would take this as completion going into the trade.
Typically i like to play the triangle scenario safe and market buy on the breakout of the BD trendling.
however POINT 2 : the preferred target for me is the 0.70xx range and the RR just isnt that great standing at about 1.22
The RSI is showing us a hidden bullish divergence with a nice bullish candle to close the day. FOREXCOM:NZDUSD
Trade how i am taking would be market buy at about 0.680x area
target 1 : 0.70xxx a potential of 3 RR
target 2 ( being positive ) : 0.71 a potential of 4 RR
Stop loss : 0.6735/0.6712
pips from entry : 65-88 ( your risk management your own preferred stop loss )
i like to place the stop loss below the suggest low of E at 0.67350 ish, can be placed few pips below the low of C at 0.67120 or something. it all comes down to your Position sizing and risk management.
ill be looking carefully at the Stop loss and move accordingly.
My last trade was worth only a small amount of profit on the overrall trade. losing one position with stop loss and carefully taking profits on the other one before price moving in the different direction. link below if you want to check that out.

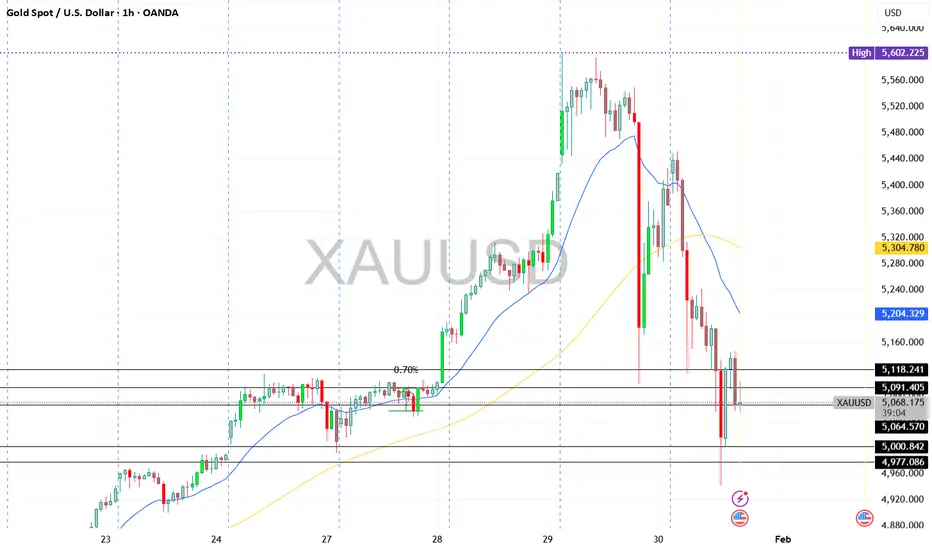
XAUUSD (Gold) | BEST TRADING SETUP | 13th Feb'2026Gold is trading near 4957 with short-term bearish pressure, while the higher timeframe trend remains bullish.
Lower timeframes show selling momentum, indicating a possible correction. However, the overall structure on Daily & Weekly charts still supports buying on dips.
Key Levels
Resistance: 4975 | 5000–5015
Support: 4930 | 4917 | 4889
Scenarios
🔼 Bullish: Break & sustain above 5000 → 5035+
🔻 Bearish: Breakdown below 4930 → 4917 → 4889
Volatility remains high — trade with proper risk management.
⚠️ Disclaimer:
This analysis is for educational purposes only and not financial advice. Trading in Forex/Commodities involves high risk. Please consult your financial advisor before taking any trade.

GOLD MARKET VOLATILITY - REALITY CHECK Noise is high around XAUUSD with headlines like “trillions wiped out” and “gold crashing”.
Let’s keep it factual.
Gold is volatile due to profit-booking after a historic rally, geo-political uncertainty, and US policy expectations.
This is correction + consolidation, not a confirmed crash.
💡 “Trillions wiped out” = notional intraday value swings, not permanent losses.
Key Levels to Watch (XAUUSD)
Resistance: 5250 – 5300
Support: 5080 – 5000 (major demand zone)
Below 5000: Only if volatility expands with strong volume
Key Takeaway for Traders 🎯
High volatility ≠ clear direction
Avoid revenge or blind trades
Let price settle → trade with risk control
🛑 Staying out is also a strategy
📊 Focus on Forex / Crypto / Indices if Gold is unstable
Risk management > FOMO
GBPUSD – Breakout Retest Looks Healthy, Bulls in ControlGBP/USD has been trading below a falling resistance trendline for quite some time. Recently, price managed to break above this trendline, which is the first sign that selling pressure is weakening.
After the breakout, price did not continue straight up. Instead, it came back for a retest, and that retest is holding well so far. This is usually a healthy sign, showing that buyers are willing to step in at higher levels instead of letting price fall back below structure.
What Price Is Telling Us:
Price is respecting the previous resistance as support and forming higher lows. Sellers are trying, but they are unable to push price back below the trendline. This behavior often appears when the market is preparing for continuation rather than reversal.
As long as price holds above this zone, the bullish bias remains intact, with upside levels marked on the chart. A clean breakdown below the structure would invalidate this view.
This is a structure-based idea, not a prediction. Let price do the work.
If this analysis helped you, like, follow, and comment for more clean Forex breakdowns.
Disclaimer: This analysis is for educational purposes only and does not constitute financial advice. Trading involves risk, and past performance does not guarantee future results. Please manage risk responsibly.

EUR/USD – Accumulation After Sell-Off, Structure-Based Long IdeaEUR/USD has seen a strong sell-off, followed by a sharp reaction from a well-defined support zone. This area has already proven its strength by absorbing selling pressure and pushing price higher.
After the bounce, price is now consolidating near support instead of breaking down further, indicating potential accumulation at these levels.
What Price Is Telling Us: Price is holding above the support zone with multiple rejections and overlapping candles, showing a clear loss of bearish momentum. Sellers are failing to push price lower despite earlier strength.
This type of behavior often appears before a corrective move or continuation higher, especially after an impulsive decline.
If this analysis helped you, like, follow, and comment for more clean Forex breakdowns.
Disclaimer: This analysis is for educational purposes only and does not constitute financial advice. Trading involves risk, and past performance does not guarantee future results. Please manage risk responsibly.


USD/CAD – Liquidity & Structure Based Short IdeaUSD/CAD has been trading inside a well-defined rising channel for a while. Price is now approaching the upper boundary of this channel, a zone where sellers have previously stepped in with strength.
This area is not just resistance, it’s also a liquidity zone, where stop-losses of late buyers are resting above recent highs. Such zones often attract smart money activity before a directional move.
What Price Is Telling Us: Price is currently stalling near resistance instead of expanding higher. We can observe Multiple rejections near the channel top, Overlapping candles showing loss of bullish momentum and Lack of strong follow-through despite previous volume spike.
This behavior often appears before distribution or a corrective move, especially when price is trading at premium levels.
If this analysis helped you, like, follow, and comment for more clean Forex breakdowns.
Disclaimer: This analysis is for educational purposes only and does not constitute financial advice. Trading involves risk, and past performance does not guarantee future results. Please manage risk responsibly.

$Gold: Breakdown or Bounce?🔻 #Gold Breakdown or Bounce? 🔺
Price tested a critical level (upward sloping trendline - Breakdown Retest ) after a bearish engulfing and is now pulling back. Will the breakdown continue, or can bulls reclaim control? 👀
Trendline break 🚨
Breakdown retest ⚠️
Key levels to watch:
🚧 Resistance: $4099.40 - $4126.08 / $4185.91 - $4195.21 / $4355.80 - $4381.44
🛡 Support: $4024.53 / $3932.10 - $3930.62 / $3953.00
Below $3953 → opens downside toward $3500.20–$3432.84 📉
Between ATH & $3953 → market likely stays trendless/choppy ⚖️
TVC:GOLD #Gold #XAUUSD #Forex #BearishEngulfing #CandleStickPatterns #BreakdownRetest #BearishReversal #PriceAction #ForexTrading
📌 #Disclaimer: This analysis is shared for educational purposes only. It is not a buy/sell recommendation. Please do your own research before making any trading decisions.

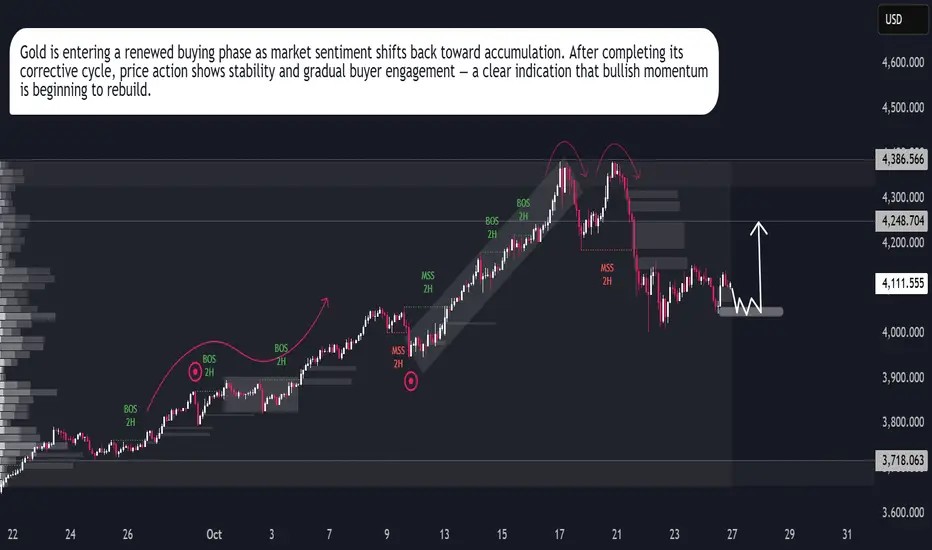
Gold Forecast — Market Turning BullishGold (XAU/USD) maintains a strong long-term bullish trend, supported by rising investor demand and global macroeconomic stability. After completing a healthy correction phase, the market is showing renewed strength, indicating a potential continuation of the broader uptrend.
Current price action reflects accumulation behavior among institutional traders, signaling confidence in gold’s long-term value growth. The consistent pattern of higher lows and steady momentum suggests that buyers are firmly in control, preparing for another upward expansion cycle.
From a fundamental perspective, global inflation concerns, a weaker U.S. dollar, and geopolitical tensions continue to support gold prices. Investors are increasingly seeking protection in safe-haven assets, which further strengthens gold’s long-term position in the market.
Technical structure and sentiment both align with a buy-side outlook, highlighting the potential for gold to extend gains as liquidity continues to build in the current price zones.
In summary, gold remains in a strong buying phase, with market data, investor sentiment, and macroeconomic indicators all favoring sustained upward momentum.
Keywords: Gold forecast, XAU/USD analysis, gold long-term trend, gold price outlook, bullish gold market, gold accumulation phase, forex gold trading, gold price prediction 2025.