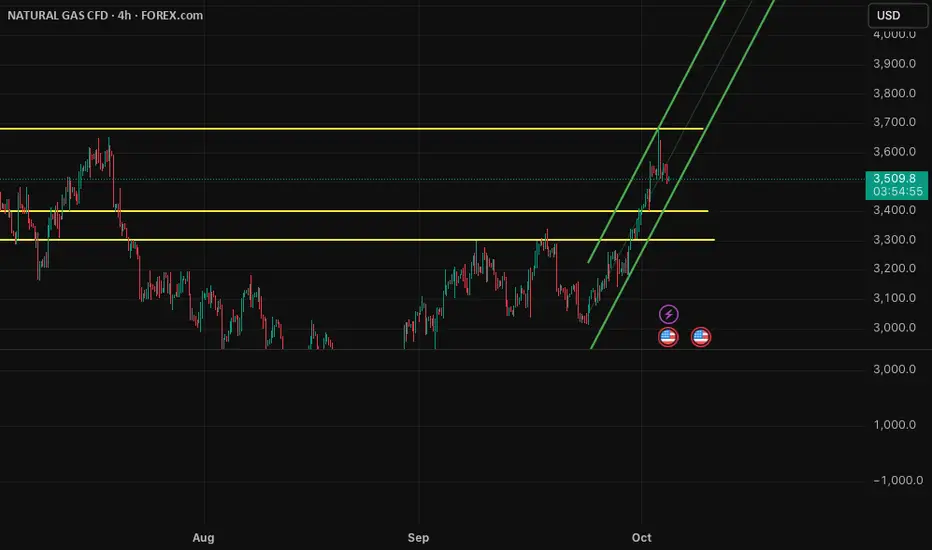
NG Price (FOREXCOM) Outlook: Potential Drop Toward 3.400–3.300Natural gas surged to 3.682 (FOREXCOM CFD), supported by yesterday’s inventory drop and the short-term cold weather forecast.
However, in the short term, if weather conditions normalize, we may see downward pressure on NG prices, with potential retracements to 3.400 and further to 3.300 levels.
Search in ideas for "FOREX"
Gold Price Awaits FOMC – Liquidity Levels in PlayGold price continued to slide into liquidity zones during the late US session yesterday and reacted perfectly at the MMFLOW BUY ZONE 3314 – 3316, delivering over +70 pips profit to traders ✅.
At present, on M5–M15, Gold is showing signs of a short-term recovery. However, for a strong upside move, buyers must break through the 3320 – 3322 resistance zone. A confirmed breakout here could trigger momentum towards higher KeyLevels, allowing price to retest important supply zones.
📈 Upside Targets (Intraday): 333x and 334x remain the key areas to watch for take-profits or potential reversal setups.
🔔 Why This Week Matters – The FOMC Decision
The highlight of the week is the FOMC meeting during the US session. Markets are awaiting clarity on the Fed’s next move. Any hint towards a September rate cut could trigger massive bullish momentum, breaking Gold out of its corrective channel.
👉 Asian & European sessions: Focus remains bullish toward 333x – 334x, with potential SELL setups at resistance.
⚠️ US session with FOMC: Expect extreme volatility – risk management is critical.
📉 MMFLOW Technical Trading Plan
🔹 BUY Scalp Setup
Entry: 3311 – 3309
SL: 3305
TP: 3315 → 3320 → 3325 → 3330 → 3340 → 3350 → 3360+
🔹 BUY Zone (FOMC Plan)
Entry: 3290 – 3288
SL: 3282
TP: 3295 → 3330 → 3335 → 3340 → 3350 → 3360 → 3370+
🔸 SELL Scalp Setup
Entry: 3342 – 3344
SL: 3348
TP: 3338 → 3332 → 3328 → 3324 → 3320
🔸 SELL Zone (FOMC Plan)
Entry: 3360 – 3362
SL: 3368
TP: 3355 → 3350 → 3345 → 3340 → 3330
⚠️ Key Notes for Indian Traders
FOMC = high volatility event – manage your exposure carefully.
Stick to strict TP/SL discipline to protect capital.
Smart traders know: KeyLevels = Profits ✅
🔥 Follow MMFLOW TRADING for daily Gold price analysis, liquidity maps, and Smart Money insights – designed for Forex & Gold traders in India.

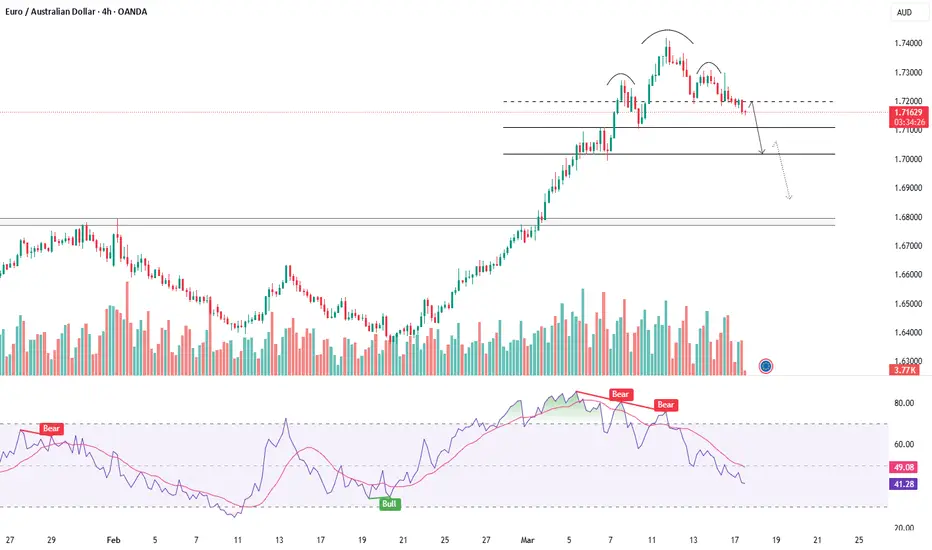
EURAUD - IS THE DOWNTREND ABOUT TO KICK OFF?Symbol - EURAUD
The EURAUD pair is currently testing a key resistance level on the weekly chart. A false breakout has occurred following a liquidity sweep, with no apparent continuation of the bullish trend. Additionally, the chart is displaying a familiar pin-bar reversal pattern.
After the price exited the consolidation range, which was capped by the 1.6787 resistance level, a distribution pattern began to form, targeting liquidity located just above the weekly resistance at 1.7196. This target has now been reached, and the price is consolidating beneath the base of the reversal structure, signaling the potential for further downward movement. There is a likelihood of either liquidation or a downward impulse toward the 1.7100 - 1.7000 zone. The forex market has exhibited a relatively calm demeanor since the week's opening, allowing technical factors to dominate market behavior until fundamental influences come into play.
Key resistance levels: 1.7196, 1.7304
Key support levels: 1.7107, 1.7016
Interest lies in the areas just below the local lows; however, from a technical standpoint, the market is primarily focused on liquidity beyond the 1.6787 level. Given that there are no significant barriers beneath 1.7016, a break of this support would likely open up a clear path towards the next liquidity zone.
WHY DO 97% OF TRADERS LOSE MONEY IN THE MARKET?🧠 WHY DO 97% OF TRADERS LOSE MONEY IN THE MARKET?
And what should you truly prepare before you begin?
You’ve probably heard this one before:
“97% of traders lose money.”
Not because they’re not smart.
Not because they lack a good strategy.
But because they enter the market with the wrong mindset and unrealistic expectations.
❌ The market is not a gold mine — not for everyone
Many people step into trading thinking:
“Forex is a money printer. Anyone can just come in and take what they want.”
But here’s the truth:
👉 The market doesn’t hand out profits. It takes money from the unprepared and gives it to the disciplined.
It doesn’t care about your dreams — it only respects your readiness.
💸 You will lose money — and it will sting
Even if you believe your strategy is solid, it will fail at some point.
And when it does, the price you pay is real money — your own money.
And because it’s your hard-earned money, you’ll feel the pain. You’ll get emotional.
You’ll want to get it back. You’ll enter trades impulsively.
And that’s exactly when the market will drag you by the nose.
⚠️ The biggest mistake: thinking a good strategy is enough
Most new traders believe:
“Once I have a working strategy, I’ll be consistently profitable.”
But the truth is:
Every strategy fails sometimes
The market doesn’t follow your logic
A bad entry isn’t what ruins you — refusing to cut the loss is
🧘♂️ So what should you actually prepare before trading?
If you’re about to start trading — or afraid to fail early — make sure to prepare:
✅ A solid foundation of knowledge
✅ A mindset that accepts loss without losing control
✅ The ability to say: “It’s okay to lose a trade — I just need to survive long enough to learn and grow.”
📌 Other people’s strategies won’t make you profitable
Yes, I often share my outlooks, plans, and even potential entry zones.
But always remember:
My view is just a perspective — not a guarantee of success.
Trading is personal.
You’ll only become consistently profitable when:
You trust in a system you’ve practiced yourself
You take trades because you see the logic, not because someone else agrees with you
🔄 Trading is a process: Try – Fail – Learn – Repeat
I’ve lost. I’ve been stubborn. I’ve gotten emotional.
And I learned:
You don’t need to win all the time.
You just need to survive your losses and come back smarter.
A stop-loss isn’t failure.
It’s the most mature decision you can make in a chaotic environment.
🤝 I won’t promise that you’ll make money
The knowledge I share — the views I post —
may not make you rich.
But I believe:
They can help you avoid losing money needlessly.
Don’t believe anyone 100% — not even me.
Take what you learn, test it, and turn it into your own conviction.
That’s how you grow.
❤️ Final thoughts
Trading isn’t a game of prediction — it’s a test of psychology.
You don’t have to be the best trader.
You just need to protect your capital, protect your mindset, and keep showing up.
Wishing you all a peaceful weekend with your loved ones.
Tomorrow, we return to the market — sharper, calmer, and more disciplined.
The market will always be there. The real question is: will you still be here to trade it next month, next year?
— AD | Money Market Flow

Tech Mahindra Ltd.### **Comprehensive Analysis of Tech Mahindra Ltd (NSE: TECHM)**
#### **1. Fundamental Analysis:**
**Overview:**
Tech Mahindra Ltd, a part of the Mahindra Group, is a leading global provider of digital transformation, consulting, and business re-engineering services. It offers services in areas such as IT services, enterprise applications, cloud computing, artificial intelligence, and cybersecurity. Tech Mahindra operates across various industries, including telecommunications, retail, manufacturing, banking, and healthcare.
**Key Financials (as of latest available data):**
- **Market Capitalization**: ₹1,08,500 crore (as of Feb 2025)
- **Revenue Growth**: Tech Mahindra has demonstrated steady revenue growth, with notable expansion in digital services, including cloud and AI solutions. The company has benefitted from strong demand for its digital transformation and automation offerings.
- **Profitability**: The company maintains a solid profitability margin, and its net profit has grown consistently over recent quarters, driven by increasing demand from key clients and strategic acquisitions.
- **Debt Levels**: Tech Mahindra has a relatively healthy balance sheet with a low debt-to-equity ratio, which allows for financial flexibility. The company’s cash flow is strong, helping to fund growth initiatives.
**Recent Developments:**
- **Acquisitions and Strategic Partnerships**: Tech Mahindra has made several strategic acquisitions to expand its digital services portfolio. Recent acquisitions in cloud, cybersecurity, and AI space aim to further strengthen its position in the digital transformation market.
- **Client Base and Geographic Expansion**: The company has strengthened its position in key markets like North America, Europe, and Asia, expanding its client base through strategic partnerships with telecom and retail giants.
- **Focus on Telecom & 5G**: Tech Mahindra’s deep-rooted expertise in the telecommunications sector has positioned it well to take advantage of 5G rollouts globally, which is expected to be a growth driver for the company in the coming years.
**Key Strengths:**
- Strong brand reputation with a wide array of IT services.
- Extensive client base across diverse industries and geographies.
- Expertise in emerging technologies like AI, cloud computing, and 5G.
- Strong management with a focus on digital transformation and innovation.
**Risks:**
- **Competition**: Tech Mahindra faces intense competition from global IT services giants like Tata Consultancy Services (TCS), Infosys, and Wipro. Competitive pressure could impact profitability and growth rates.
- **Currency Fluctuations**: Being an export-oriented company, Tech Mahindra is susceptible to fluctuations in the currency markets, especially the INR/USD exchange rate, which can affect margins.
- **Geopolitical Risks**: Tech Mahindra’s operations in multiple regions expose it to geopolitical risks, which can affect business continuity and market conditions.
---
#### **2. Technical Analysis:**
**Current Price Action (as of February 2025):**
- **Stock Price**: ₹1,210 (as of Feb 2025)
- **52-week High/Low**: ₹1,400 (High) – ₹1,020 (Low)
- **Recent Trend**: Tech Mahindra has been in a consolidation phase after a strong rally in 2023. The stock has recently tested the ₹1,200 mark and could either break out to the upside or face further corrections, depending on broader market conditions.
**Moving Averages:**
- **50-Day Moving Average (50-DMA)**: ₹1,225
- **200-Day Moving Average (200-DMA)**: ₹1,275
- Tech Mahindra is trading just below its 50-DMA and 200-DMA, suggesting that the stock may be in a short-term downtrend. However, a crossover above the 50-DMA could signal a potential bullish reversal.
**Relative Strength Index (RSI):**
- RSI is at **48**, which indicates the stock is neither overbought nor oversold, showing that the stock has room to move in either direction. An RSI above 70 would indicate overbought conditions, while an RSI below 30 would indicate oversold conditions.
**MACD (Moving Average Convergence Divergence):**
- The MACD line is currently below the signal line, which suggests a bearish trend in the short term. A cross above the signal line could indicate a change in momentum towards the upside.
**Volume Analysis:**
- The volume has been steady in recent weeks, with occasional spikes during periods of price movement. A breakout above the current resistance could be confirmed by an increase in volume, signaling a strong upward trend.
---
#### **3. Support and Resistance Levels:**
**Support Levels:**
- **₹1,150-1,160**: This zone has historically acted as strong support for the stock. If the stock faces downward pressure, this level could prevent further declines.
- **₹1,100**: A secondary support level exists around ₹1,100, which could serve as a critical level for the stock in the event of deeper corrections.
**Resistance Levels:**
- **₹1,250-1,270**: The immediate resistance lies around ₹1,250-1,270, which is near the 200-DMA. A breakout above this level could trigger an upward move towards higher levels.
- **₹1,350-1,400**: The stock faces stronger resistance near ₹1,350-1,400, which corresponds to its 52-week highs. A break above this zone could lead to a more sustained bullish rally.
**Key Levels to Watch for Short-Term Movement:**
- **Immediate Resistance**: ₹1,250 (50-DMA)
- **Immediate Support**: ₹1,150 (recent low)
---
#### **4. Risk and Reward Outlook:**
**Risk Factors:**
- **Global Economic Uncertainty**: Economic slowdowns in key markets like the U.S. and Europe could impact demand for Tech Mahindra's services, especially in sectors like banking and telecom.
- **Currency Volatility**: The company’s exposure to forex risks, particularly with the USD and INR, can impact margins.
- **Regulatory Risks**: Any changes in data privacy or cybersecurity laws in regions like the U.S. and EU could potentially affect Tech Mahindra’s business operations and compliance costs.
**Reward Potential:**
- **Growth in Digital Services**: The global shift towards digital transformation provides Tech Mahindra with a solid growth outlook, particularly in AI, cloud computing, and telecom-related services (e.g., 5G).
- **Strong Market Position**: As a leading player in the telecom and IT services sector, Tech Mahindra stands to benefit from the continued demand for automation, cloud computing, and cybersecurity services.
---
#### **5. Investment Recommendation:**
- **Long-Term Investors**: Tech Mahindra is well-positioned for long-term growth, particularly with its strong presence in emerging technologies like AI, cloud, and 5G. Investors looking for exposure to the digital transformation theme could consider holding Tech Mahindra for the long term, especially if the stock pulls back to levels closer to ₹1,150-1,160.
- **Short-Term Traders**: For short-term traders, a breakout above **₹1,250-1,270** could signal the start of a short-term rally toward ₹1,350-1,400. Traders should monitor for volume confirmation during any breakouts above resistance levels.
---
### **Disclaimer:**
The information and analysis provided here are for educational and informational purposes only. We are not registered with SEBI (Securities and Exchange Board of India) or any other regulatory body, and this should not be construed as investment advice. Stock market investments are subject to market risks, and past performance is not indicative of future results. Before making any investment decisions, it is important to conduct thorough research, seek advice from a certified financial advisor, and understand your risk tolerance. The views expressed are based on publicly available data and personal analysis and may not necessarily reflect the views of other professionals or organizations.

XAU#9: FED keeps interest rates unchanged. Information supportin💎 💎 💎 The previous plan helps you make a profit. Please like and follow the channel to follow the earliest trading plan 💎 💎 💎
🔥So Gold has returned to the support zone of 2745 and reacted strongly as the previous plan. Here's our next trading plan 🔥
1️⃣ **Fundamental analysis:**
📊 🔴Market speculation that US may impose import tariffs on gold
London gold market participants are racing to borrow central bank gold stored in London as gold deliveries to the US surge on speculation that the US may impose import tariffs
🚀 🔴Fed keeps rates unchanged, drops mention of inflation "progress" in policy statement
2️⃣ **Technical analysis:**
🔹 **D frame:** yesterday closed as a Hanging Man candle. However, the price action after this candle still needs market confirmation in today's trading session
🔹 **H4 frame:** The support zone of 2745 is playing an important role. The price is still in an upward structure.
🔹 **H1 frame:** The trendline zone that matches the support of 2745 is showing a strong reaction after the interest rate announcement. If the price can break through the resistance zone above, Gold will have enough momentum to break through the old peak
3️⃣ **Trading plan:**
⛔ In the current area, it will be risky if we take a SELL position here. Although it is also a resistance zone, H4 has a hugging candlestick pattern with an increasing structure. If H4 closes at 2752, we will consider this option later
✅If anyone has an order in the 2745 area, Congratulations!!! You can wait for a higher profit. If not, you can choose to react to test the trendline again on the H1 frame for confirmation. We will wait for a price structure on a small time frame like m15 to establish a position.
💪🚀 **Wish you successful trading!**
📌 For any questions, please contact directly. I am ready to answer for you for free
#trading #trade #xauusd #newtrader #newbie #xau #forex #tradingview #plants #trader #tradingforex

XAU#7: The bullish wave engulfs the trader's account
💎 💎 💎 Plan #6 above helps you make a profit. Leave a comment and tag your friends to share. 💎 💎 💎
So the bullish wave has reached the old peak as analyzed by #6. Let's see the next comments and trading strategies.
1️⃣ **Fundamental analysis:**
📊 Putin: Ready to discuss the Russia-Ukraine conflict and energy issues with Trump. If there is really a negotiation. Gold prices may be under pressure
🚀Trump hinted at easing tariff policies and called on the Federal Reserve to cut interest rates. This is the driving force that has pushed gold to hover near the record high reached in October last year
2️⃣ **Technical analysis:**
🔹 **W frame:** Last week ended with a strong bullish candle in the resistance area. This confirms that the market sentiment is extremely optimistic about establishing a new price peak.
🔹 **H4 frame:** The uptrend is still very strong with no signs of correction
🔹 **H1 frame:** The price structure is increasing in a stepwise manner. It will be difficult to see a correction.
3️⃣ **Trading plan:**
⛔ In previous articles, my top priority for you is to never go against the market trend at this time. Especially, you are not allowed to hold losses or place SELL orders against the trend. Many accounts have burned because of blocking the gold head when the trend is so strong
✅The uptrend will continue next week. The top priority is still to find a BUY entry point when the price reaches the support zone.
💪🚀 **Wish you successful trading!**
📌 For any questions, please contact directly. I am ready to answer for you for free
#trading #trade #xauusd #newtrader #newbie #xau #forex #tradingview #plants #trader #tradingforex

EURUSD ORDER BLOCK | LONG TRADEHi Trader
Eurusd taken previous 1hr and 4hr liqduity so Buying expected
according to SMC. (Forex Mentorship available)
5 min CHoCH is best to take Long trade
Note - Only for education purpose

XAU/USD is looking good for downside in 1hrGold is looking good for a downside in 1hr timeframe till daily FVG.You can take entry on 5 min timeframe and manage your trade according to your risk reward. #XAUUSD #Forex #trading

Traps in Forex.Traps are very common moves played by big players at accumulation and distribution levels. They do so to grab the liquidity from retail traders. Liquidity grab is done by SL hunting of retail traders, and for SL hunting traps are being lay by fake breakout or breakdown of support or resistance level ( also known as accumulation or distribution level in western style). But, as a trader this traps can be played smartly by retail to gain some good move. I have attached a snapshot of my few trades from last month. I have mentioned how I traded those traps.
Note: I have prepared this analysis today to post it for learning purpose. I don't remember my exact entry and exit price.

GOLD & BTC Price Action Analysis | Key Levels & Breakout InsightIn this video, we analyze the price action of Gold and Bitcoin, focusing on key levels and potential breakout opportunities. Using weekly time frame analysis, we'll discuss significant trends, support, resistance levels, and market behavior. Stay tuned for valuable insights that can help guide your trading decisions.
#GoldPriceAction #BitcoinAnalysis #BTC #XAUUSD #ForexTrading #CryptoTrading #PriceActionTrading #BreakoutStrategy #AlzubairFX #TechnicalAnalysis #SwingTrading #TradingInsights #HindiTrading

EURJPY LONGFOREXCOM:EURJPY
Hello traders , here is the full multi time frame analysis for this pair, let me know in the comment section below if you have any questions, the entry will be taken only if all rules of the strategies will be satisfied. wait for more Smart Money to develop before taking any position . I suggest you keep this pair on your watchlist and see if the rules of your strategy are satisfied...
Keep trading
Hustle hard
Markets can be Unpredictable, research before trading.
Disclaimer: This trade idea is based on Smart money concept and is for informational purposes only. Trading involves risks; seek professional advice before making any financial decisions. Informational only!!!!

Weekend Forex & Crypto Analysis | Price Action Trading Insights In this weekend market analysis, I provide an in-depth look at the upcoming opportunities in both Forex and Crypto markets using price action trading strategies. This video includes key support and resistance levels, price patterns, and potential breakout zones to prepare you for the trading week ahead. Whether you trade currency pairs or cryptocurrencies, these insights will help shape your trading strategy.
📊 What's Covered:
Detailed price action analysis for major Forex pairs and Cryptocurrencies.
Key market trends and potential breakout opportunities.
How to trade using weekly support/resistance zones for both Forex and Crypto.
This analysis is ideal for traders focusing on swing trading and looking to capitalize on both Forex and Crypto markets. Stay ahead of the curve with my expert market insights!
🔔 Subscribe to Alzubair FX for weekly price action analysis and trading tips.
#ForexTrading #CryptoTrading #PriceAction #WeekendAnalysis #SwingTrading #ForexAndCrypto #TechnicalAnalysis #ForexPriceAction #CryptoPriceAction #AlzubairFX #ForexAndCryptoAnalysis #TradingStrategies

Tour d'horizon paires Forex: GBPJPY/GBPCAD/EURCAD/USDCAD/USDCHFBonjour à toutes et à tous,
Petit tour d'horizon des paires forex citées dans le titre.
Horizon: swing moyen terme.
Le but de cette vidéo est de partager ma vision sur ces paires forex et d'obtenir vos retours constructifs.
Je ne fais pas la météo de la veille en disant: "il aurait fallu...".
Merci par avance de vos retours constructifs.
Que diriez vous d'échanger en live sur un créneau en fin de journée?
NB: Il ne s'agit en aucun cas de conseils en investissements.
Merci pour vos retours et votre soutien
Laurent

EURJPY LONG - 15MFOREXCOM:EURJPY
Hello traders , here is the full multi time frame analysis for this pair, let me know in the comment section below if you have any questions, the entry will be taken only if all rules of the strategies will be satisfied. wait for more Smart Money to develop before taking any position . I suggest you keep this pair on your watchlist and see if the rules of your strategy are satisfied...
Keep trading
Hustle hard
Markets can be Unpredictable, research before trading.
Disclaimer: This trade idea is based on Smart money concept and is for informational purposes only. Trading involves risks; seek professional advice before making any financial decisions. Informational only!!!!

AUDCHF - POSITIONAL LONG TRADE IN FOREX FOR HUGE PROFITSymbol - AUDCHF
AUDCHF is currently trading at 0.57300
I'm seeing a trading opportunity on buy side.
Buying AUDCHF pair at CMP 0.57300
I will be adding more if 0.56900 comes & will hold with SL of 0.56500
Targets I'm expecting are 0.58950 - 0.59550
Disclaimer - Do not consider this as a buy/sell recommendation. I'm sharing my analysis & my trading position. You can track it for educational purposes. Thanks!

EURAUD - 15M (LONG)FOREXCOM:EURAUD
Hello traders , here is the full multi time frame analysis for this pair, let me know in the comment section below if you have any questions, the entry will be taken only if all rules of the strategies will be satisfied. wait for more Smart Money to develop before taking any position . I suggest you keep this pair on your watchlist and see if the rules of your strategy are satisfied...
Keep trading
Hustle hard
Markets can be Unpredictable, research before trading.
Disclaimer: This trade idea is based on Smart money concept and is for informational purposes only. Trading involves risks; seek professional advice before making any financial decisions. Informational only!!!!

NASDAQ - IDEA - SETUPFOREXCOM:NAS100
Hello traders , here is the full multi time frame analysis for this pair, let me know in the comment section below if you have any questions, the entry will be taken only if all rules of the strategies will be satisfied. wait for more Smart Money to develop before taking any position . I suggest you keep this pair on your watchlist and see if the rules of your strategy are satisfied...
Keep trading
Hustle hard
Markets can be Unpredictable, research before trading.
Disclaimer: This trade idea is based on Smart money concept and is for informational purposes only. Trading involves risks; seek professional advice before making any financial decisions. Informational only!!!!

US30 SetupFOREXCOM:US30
Hello traders , here is the full multi time frame analysis for this pair, let me know in the comment section below if you have any questions, the entry will be taken only if all rules of the strategies will be satisfied. wait for more Smart Money to develop before taking any position . I suggest you keep this pair on your watchlist and see if the rules of your strategy are satisfied...
Keep trading
Hustle hard
Markets can be Unpredictable, research before trading.
Disclaimer: This trade idea is based on Smart money concept and is for informational purposes only. Trading involves risks; seek professional advice before making any financial decisions. Informational only!!!!

EURPLN - Long Opportunity in Forex!Currency Pair - EURPLN
I am seeing a good trading opportunity in EURPLN.
Taking long positions here at CMP 4.28325
My SL would be 4.27300
Target I'm expecting is 4.34500 - 4.35000
That's 1:6 RR trade.
Disclaimer - Do not consider this as a buy/sell recommendation. I'm sharing my analysis & my trading position. You can track it for educational purposes. Thanks!

US OIL BULLISH MOMENTUM DETECTEDUS OIL faceing a trendline support on week chat
Hence a good opportunity for all forex and CFD user to grab this one
It will be bullish for more than 1 mongth
Due to week chat analysis
Hence analyse yourself for short-term trade
just buy side only
Market is bullish
So trade only buy side on your trade setup

USDCAD ShortFOREXCOM:USDCAD
Hello traders , here is the full multi time frame analysis for this pair, let me know in the comment section below if you have any questions, the entry will be taken only if all rules of the strategies will be satisfied. wait for more Smart Money to develop before taking any position . I suggest you keep this pair on your watchlist and see if the rules of your strategy are satisfied...
Keep trading
Hustle hard
Markets can be Unpredictable, research before trading.
Disclaimer: This trade idea is based on Smart money concept and is for informational purposes only. Trading involves risks; seek professional advice before making any financial decisions. Informational only!!!!

HEAD AND SHOLDER NECK LINE BREAEDHEAD AND SHOLDER
NECK LINE breaked
a good fall will expected on forex
EURAUD pattern shows
grab the oppurtunity for forex trader
